- Space Engineering University, Department of Aerospace Science and Technology, Bei Jing, China
This study numerically investigated the thermoacoustic combustion instability characteristics of a scaled rocket combustor based on a hybrid of the Reynolds-averaged Navier–Stokes and large–eddy simulation method. The turbulence–combustion interactions were treated using flamelet generated manifold approach. An unstable case was simulated with detailed reaction mechanisms (GRI-Mech 3.0). The obtained results agree well with experiment data from Purdue University, in terms of pressure oscillations frequency and power spectral density spectrum. The combustion instability mode was identified to be coupled with the first longitudinal acoustic mode of the combustion chamber by dynamic model decomposition method. According to Rayleigh index analysis, the unstable driving source was found to be located near the combustor step, which was further confirmed by time-averaged flow fields. Detailed three-dimensional vortex ring shedding evolutions at the combustor step were tracked with fine time resolution. Results indicate that the combustion instability arises from periodic vortex ring shedding at the combustor step and interacting with the chamber wall. The unburnt reactants were rolled up by the shedding vortex ring, which would not break up until impact with the chamber wall. Therefore, the mixing performance was significantly enhanced, leading to sudden heat release. Consequently, the thermal energy is added to the acoustic field, and the first longitudinal mode is thus reinforced, giving rise to large amplitude axial velocity oscillations which prompt the generation of the new vortex ring. The results of the present investigation will support the design and development of high-performance rocket engines.
Introduction
Combustion instability arising from the coupling between the chamber acoustic resonance modes and pulsated heat release (Lyu et al., 2021), occurs in many applications, especially in high power density engines, such as gas turbines, and rocket engines (Urbano et al., 2016; Ilbas et al., 2021; Jiang et al., 2021). This coupling may induce disturbances inside the combustion chamber, which may cause large amplitude oscillations. Such oscillations can produce high thermal and mechanical stresses on the combustion chamber, leading to performance degradation, mechanical vibrations, or even failure (Franzelli et al., 2010). The present study focused on the combustion instability in a high-pressure choked combustor, such as a rocket engine. In such engines, high power density presents and the nozzle throat is acoustically choked. As such, even small perturbations can rapidly develop into high-amplitude oscillations. Once unstable combustion appears during the rocket engine development process, it may take significant time and cost to remedy it, as was the case for the well-known Rocketdyne F-1 engine (Oefelein and Yang, 1993).
In most cases, extremely destructive transverse unstable combustion can be suppressed by resonant cavities or baffles (Smith et al., 2010a). However, the transverse modes were treated with careful design, causing longitudinal oscillations with lower frequencies (NguyenTuan et al., 2018). Fundamental comprehension of the combustion instability process has been developed by Rayleigh in the 1870s (Rayleigh, 1878), who demonstrated that the stability of a combustion system can be identified by the sign of the integral value of the product of pressure and heat release rate in an oscillation circle. A positive integral value indicates the driving combustion instability, and vice versa. In practice, the Rayleigh criterion can be described by Equation 1 (Harvazinski et al., 2013).
where
Over the past 2 decades, many investigations have been conducted, both experimentally (Kim et al., 2008; Ruan et al., 2020; Liu et al., 2021a) and theoretically (Culick, 1970; Coates and Horton, 1974; Bhatia and Sirignano, 1991; Sattelmayer, 2003). Typically, the longitudinal combustion instability has mostly been examined systematically at Purdue University (Smith et al., 2006, 2010b; Yu, 2009; Wierman et al., 2012). Various scaled combustors with a single injector have been applied to study the longitudinal combustion instability mechanisms, including the Discretely Variable Resonance Combustor (DVRC (Frezzotti et al., 2014)), Continuously Variable Resonance Combustor (CVRC (Yu et al., 2008)), and Full-Flow Staged Combustor (Lemcherfi et al., 2019). A careful design of the acoustic coupling between the injector and combustion chamber allows exciting unstable combustion easily. In addition, various instability modes have been found in CVRC experiments via continuously changing the oxidizer post length. These experiments provided abundant diagnoses of the combustion flow field, such as dynamic pressure (Sisco, 2007), temperature (Buschhagen et al., 2018), and chemiluminescence (Bedard et al., 2014). The results indicated that the combustion chamber step height and oxidizer post length have a significant influence on combustion instability. However, restricted by high temperature and pressure in the combustion chamber, the experiments show powerless in capturing the detailed flow dynamics inside the chamber.
With recent advancements in computer architectures, it has become popular to study combustion instability through high-fidelity numerical method (Zhao et al., 2019; Xia et al., 2021a; Zhou et al., 2021). Extensive comparisons between numerical simulations and experimental data have been presented in Ref. (Smith, 2010), and the ability of the numerical method to correctly capture the complicated physical behaviors of the combustion chamber has been demonstrated in Refs. (Nozari and Karabeyoğlu, 2015; Duvvuri et al., 2020; Liu et al., 2021b). Numerical studies on combustion instability have been performed using either Large-eddy simulation (LES) or a hybrid Reynolds-averaged Navier-Stokes (RANS)/LES method. Initially, only a 2D axisymmetric model or a section of the combustor (Smith et al., 2010c; Schmitt et al., 2011; Murayama et al., 2018) (in the azimuthal direction) was simulated, and most numerical studies were limited to one- or two-step reaction mechanisms. Such simplifications present several limitations. Firstly, the 3D turbulent mixing is ignored, which is very important for diffusion combustion. Secondly, the vortex stretching/tilting and other vorticity generation mechanisms are neglected. Third, the products in the combustion chamber cannot cross through the axisymmetric line of surfaces, which introduces non-physical boundary conditions. Almost all simulated results have shown that the 2D axisymmetric simulation results agreed only with experiments data qualitatively (Smith et al., 2010b). Compared with experimental results, the unstable combustion frequency is usually overestimated by ≥ 15% (Smith et al., 2010c; Srinivasan et al., 2015), and the amplitude of pressure oscillations is underestimated by up to 40% (Garby et al., 2013). Comparative study of 2D axisymmetric and full 3D numerical simulation of CVRC was conducted by Garby et al. (Fuller, 2019) using dynamic thickened flame and LES models. It was reported that the numerical results of full 3D configuration simulation were more consistent with that of experiments. Furthermore, Harvazinski et al. (Harvazinski et al., 2013) found that the 3D simulation results agreed well with experimental results. Almost all numerical simulations (both axisymmetric and full 3D) overpredict the characteristic frequency.
Most previous studies have treated turbulence chemistry interactions by solving the species transport equations (Smith et al., 2008, 2010a, 2010c; Smith, 2010), leading to not only numerical rigidity but also high computational cost, restricting the reaction mechanisms to one- or two-steps. Harvazinski et al. (Harvazinski et al., 2016) conducted a full 3D numerical simulation with detailed reaction mechanisms (GRI-Mech 1.2), however, the model is significantly expensive compared to the global chemical reaction. Possibly due to inefficient 3D grid resolution, the same oscillation amplitudes were obtained as for the global chemical reaction. Recently, the flamelet progress variable (FPV (Peters, 2000)) approach has been successfully used to predicate unstable combustion in CVRCs (2D axisymmetric) (NguyenTuan et al., 2018). The FPV model has been proven to be much cheaper compared to previous simulations. The reason for its low computational cost lies mainly in the fact that it does not solve the transport equations themselves; instead, the turbulent combustion properties are determined by a series of flamelet libraries or pre-established lookup tables (NguyenTuan et al., 2018). To the best of the author’s knowledge, taking computational cost into account, previous numerical investigations on CVRCs have been limited by either grid resolution, dimensionality (2D or 3D), or chemical mechanisms (detailed or simplified). A full 3D investigation with a detailed reaction mechanism is required to explore the complete flow dynamics inside a combustion chamber, including vortex shedding and interaction with the chamber wall.
Therefore, to fully characterize the combustion instability mechanisms of CVRC, this study performed a full 3D simulation (with suitable grid resolution) with detailed (GRI Mech 3.0 (Gregory et al., 2018), 53 species and 325 steps) reaction mechanism. This paper is organized as follows. Combustor Model and Numerical Methods summarizes the combustor configurations and numerical methods for treating turbulence and chemical reactions. Result and Discussion presents the results, detailed discussion, and comparison with existing experiments. Finally, Conclusion concludes the paper.
Combustor Model and Numerical Methods
Single-Element Combustor
A schematic of the single-element combustor is depicted in Figure 1. The combustor is composed of a hot oxidizer mixture generator, oxidizer injector, fuel injector, and dump combustor with a choked nozzle, which has the same configuration as the CVRC developed by Yu et al. (Yu, 2009). The CVRC is named as such because the length of the oxidizer post can be changed continuously. The simulation in this study was performed following the experimental tests of Yu et al. (Yu, 2009; Yu et al., 2009, 2012) to investigate the longitudinal combustion instability in a choked CVRC model. In Yu et al.’s experiments, the oxidizer mixture consists of 52% H2O and 48% O2 (by weight) decomposed from the hydrogen peroxide through a catalyst bed. The mixture flows through the oxidizer manifold and was then injected into the oxidizer post through the choked oxidizer injector (Figure 1). Gaseous methane (CH4) was ejected from an annulus consisting of a fuel injector and manifold. The oxidizer and fuel were mixed inside the recess chamber (region between the fuel injector tip and combustor step) and were introduced into the combustion chamber by a shear coaxial injector. The key geometrical parameters of the single-element combustor are listed in Table 1.
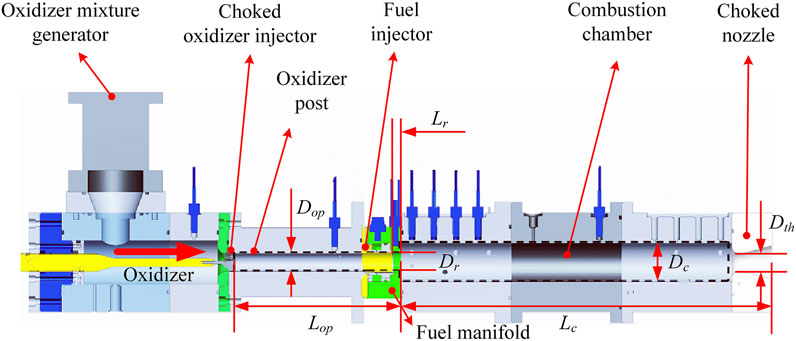
FIGURE 1. Schematic of the single-element combustor (reproduced from (Yu et al., 2009))
The experimental investigations focused on the effects of varying oxidizer post length, which was done both continuously and discretely. The present study aimed to extract the longitudinal combustion instability mechanisms of the combustor model. Therefore, only a fixed oxidizer post length (114.3 mm) was examined. The present study is based on the near most unstable condition in the experiments, corresponding to the geometric configuration detailed in Table 1.
Numerical Framework
Turbulence Model
Stress-blended eddy simulation (SBES (Menter, 2016)) is a hybrid RANS/LES turbulence model developed by Ansys Inc., which could provide optimal treatment for the problem of grid-induced separation and switch swiftly from RANS to LES in separating shear layers. The model applies a blending function to automatically switch between RANS and LES models according to local flow characteristics.
Various applications (Yu et al., 2020; Xia et al., 2021b, 2021c) have demonstrated that the SBES method could achieve a satisfactory balance between calculation accuracy and computational expense. Therefore, the SBES method was used to treat turbulence in the present study.
The blending function for SBES is denoted by
where
Turbulent Combustion Model
Premixed and diffusion combustion are the two limits of combustion, respectively. In practice, the fuel and oxidizer generally have been mixed partly before combustion, because of turbulence. When the degree of mixing is not spatially homogeneous, such a combustion mode is called partially premixed combustion. A vigorous interaction between the fuel and oxidizer could develop in the recess region before they enter the combustion chamber. A partially premixed combustion model was thus adopted in this work. The flamelet generated manifold (FGM (Verma et al., 2019; Jurić et al., 2021)) model has previously been applied to treat turbulent chemical processes and has been widely used to treat combustion (Ramaekers, 2011; Verma et al., 2019).
The FGM maps complex, multidimensional chemical reaction information into one or more characteristic variables (such as mixture fraction f, scalar dissipation rate
and one equation for temperature as follows:
where
The scalar dissipation
where D is a diffusion coefficient.
We assumed that the scalar dissipation rate
where
Based on the model described above, a detailed chemical reaction mechanism was considered by solving the transport equations of
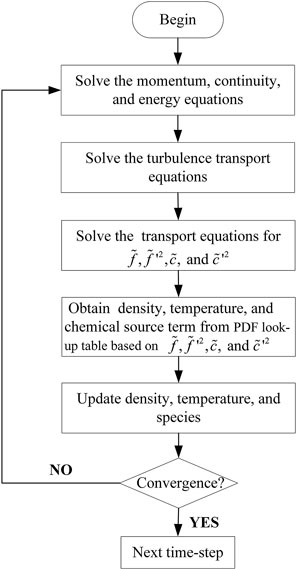
FIGURE 2. Flowchart of one-time step of the numerical program for the present model (only four specie transport equations were solved, which massively decrease computational cost compared to previous numerical simulations (Smith et al., 2008; Smith et al., 2010a; Smith et al., 2010c; Smith, 2010))
Computational Domain and Boundary Conditions
As indicated in Figure 3, the computational domain consists of the choked oxidizer injector, fuel injector, combustion chamber, and choked nozzle. The oxidizer mixture and fuel inlets were set as constant mass-flow inlets and the mass flow rate of methane and oxidizer are 27.67 g/s and 319.78 g/s respectively. The hot oxidizer (1029K) is composed of 58% water vapor and 42% oxygen by weight. The outlet was set as pressure outlet and the initial pressure is 101,325 Pa. Adiabatic non-slip conditions were adopted for all walls. According to previous research (Yu, 2009; Smith et al., 2010a, 2010b), the combustion instability mechanism of the single-element combustor is expected to be related to the vortex shedding at the combustor step. Consequently, the grids around the combustor step were refined to resolve steep pressure and vorticity gradients, as detailed in the close-up view of Figure 3B. After the grid independence study (as illustrated in Grid Independence Study), approximately 10.3 million cells were applied to conduct the present study, using 128 processors. The finest grids were located in the refined region and were about
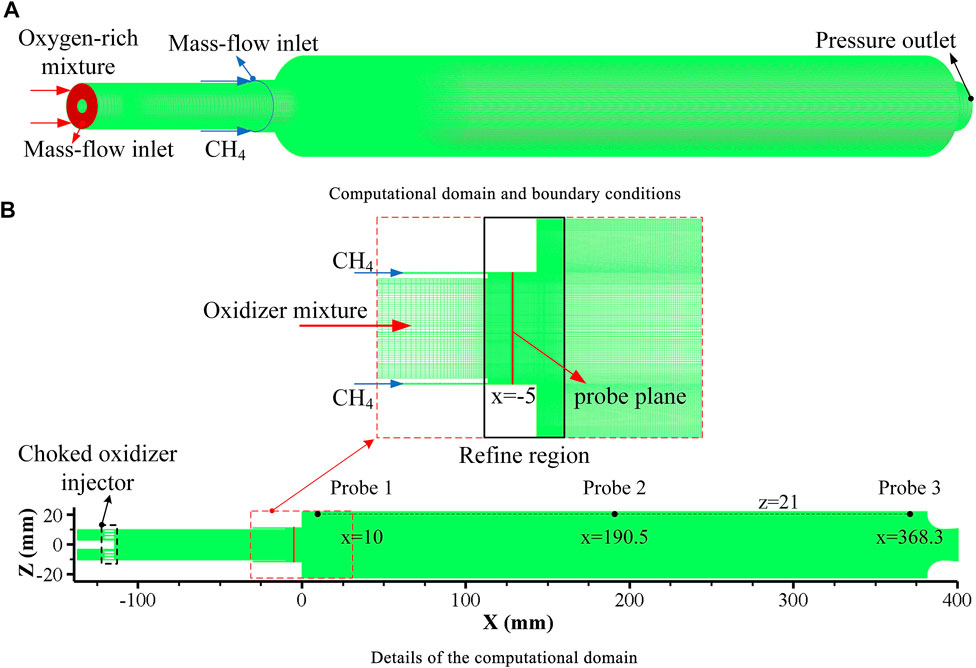
FIGURE 3. Computational domain and boundary conditions. (A) Computational domain and boundary conditions, (B) Details of the computational domain.
To record the signals (e.g., pressure, heat release, velocity) inside the model combustor, three probes were set in the combustion chamber, as depicted in Figure 3B. The probe plane, a mass flow rate detection surface (other signals were also recorded) located at x = -5 mm, is displayed in Figure 3B. All probes (referred to as probes 1–3) are located at z = 21 mm (very close to the combustion chamber wall) to simulate high-frequency pressure transducers. Probe 2 is in the middle of the combustion chamber to capture the pressure node, and probe 1 is distributed upstream of the chamber. Particularly, probe 3 is set at x = 368.3 mm for comparison with the experiments (Yu, 2009).
Numerical Scheme
The present numerical study was based on a 3D FGM model and performed on ANSYS Fluent V2020 R1. Turbulence was solved by SBES method. The SGS model was WALE. Scalar fluxes were discretized in a second-order upwind format. The pressure-implicit with splitting of operators’ method (Issa, 1985) was employed to deal with the pressure velocity coupling terms. A bounded-central differencing scheme was applied to discretize the momentum equations. Second-order temporal accuracy was received by applying an implicit dual-time method.
Grid Independence Study
As mentioned above, the present simulation was based on experiments at Purdue University (Yu, 2009). The oxidizer post length was continuously varied in the experiments, and results demonstrated that the limit cycle behavior was quasi-stationary at any given tube length (Yu et al., 2012). Consequently, the present fixed oxidizer post length results can be compared with the experimental results (Yu et al., 2012) to verify the model accuracy. To provide a high temporal resolution, a time step of 2e-7 s was used. Given the limited computing resources, the simulations were performed for no more than 30 ms. The following results indicate that the initial transient caused by ignition had been died out and a record length of about 11 ms (18.5–29.5 ms, probe 3) for statistical analysis.
To ensure appropriate numerical accuracy, a grid independence study was performed on three different levels of mesh resolution. The frequency spectrum is one of the most important characteristics of combustion instability, so it was simulated on all three grids. Meanwhile, the root mean square (RMS) pressure was also evaluated. Figures 4A–C present the corresponding power spectral density (PSD) plots for all three grids. The results demonstrate that the deviation of both frequency and magnitude between the intermediate grid and fine grid was almost consistent. The RMS pressures of various grids are displayed in Figure 4D. It was found that the solution starts to converge at the intermediate grid. Thus, given the computational cost and simulation accuracy, the intermediate grid proved suitable for the present study.
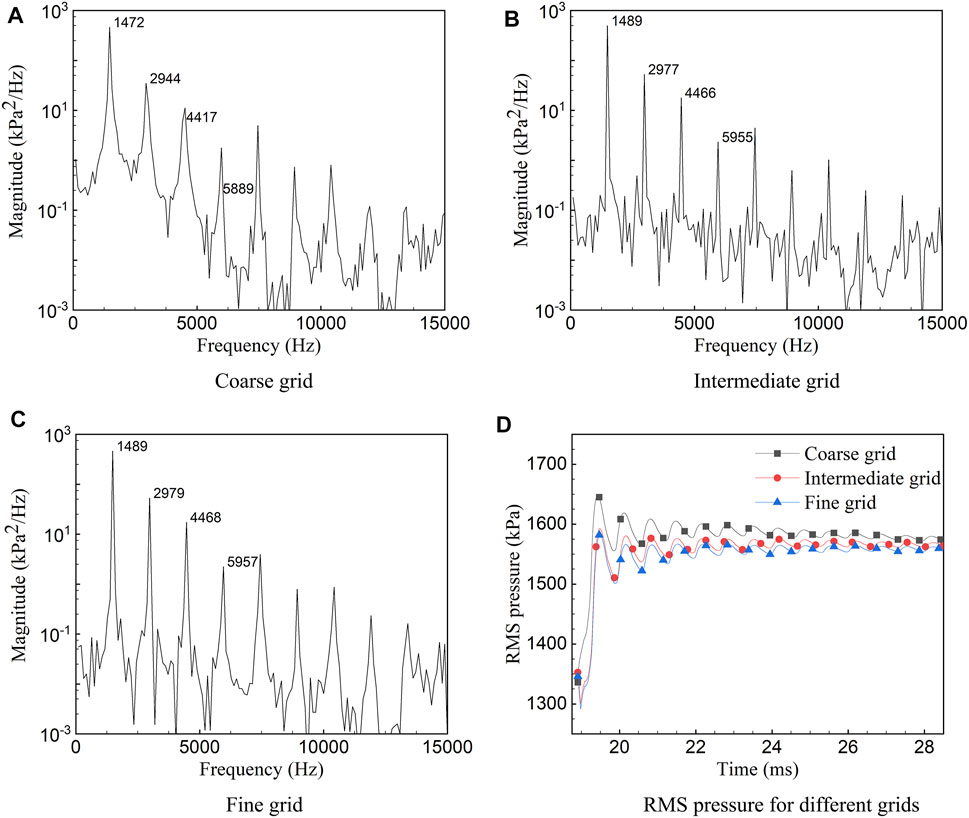
FIGURE 4. PSD and RMS pressure of various resolution grids. The pressure signals recorded at probe 3 were used for the present analysis. (A) Coarse grid (7.7 million cells). (B) Intermediate grid (10.3 million cells). (C) Fine grid (11.5 million cells). (D) RMS pressure for different grids.
Results and Discussion
Various analysis methods were used to evaluate the computational data, some mainly for identifying the combustion instability mode, and others for investigating the mechanisms of the instability. The results are arranged basically according to the analysis methods and their purposes.
Combustion Instability Mode
Power Spectral Density and Mode Shape
Pressure time traces at probe 1, probe 2 and probe 3 are shown in Figure 5. These probes were selected mainly due to their proximity to the predicted locations of pressure anti-nodes (probes 1 and 3) and pressure node (probe 2). The relatively large pressure oscillations would be captured at probe 1 and probe 3 and smaller ones at probe 2. In present study, pressure oscillations were predicted mainly in the longitudinal mode, thereby allowing these probes to accurately identify the dominant unstable behavior. Consistent with expectations, the pressure oscillations at probes 1 and 3 are much larger than that at probe 2, as evident by Figure 5. An almost fixed temporal phase difference can be found between probes 1 and 3, and the pressure wave of probe 2 peaks twice in one cycle. The plot also shows that the mean chamber pressure approximately 1.5 MPa, and the experiment (Yu et al., 2012) was designed to be at a target chamber pressure of 1.58 MPa. However, in practice, relatively low combustion efficiencies were achieved resulting in a mean chamber pressure of approximately 1.38 MPa. The slightly higher mean chamber pressure in the present computational may result from the higher combustion efficiencies and lower heat loss (the adiabatic wall). In general, good agreement was achieved with the experiment in the aspect of mean chamber pressure, demonstrating a reasonably accurate evaluation of the global combustion process.
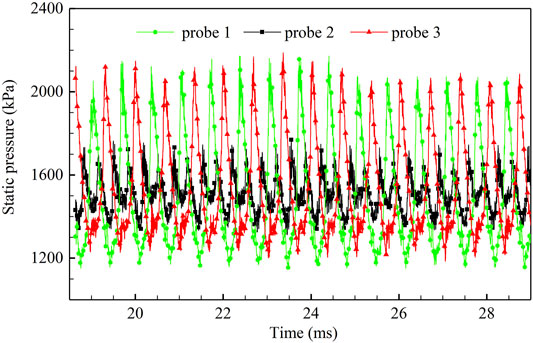
FIGURE 5. Pressure time traces of probes1, 2, and 3. The amplitude of the pressure time traces at probe 2 is much lower than at probes 1 and 3, and almost peaks twice in one cycle.
The dominant frequencies can be identified by performing PSD analysis on the pressure time signals. The PSD analysis results are given in Figure 6A on a semi-log scale. The x axis is the frequency on a linear scale, and the ordinate is the spectral content on a traditional logarithmic scale. Care must be given to the y axis, as each major tick denotes an order magnitude of spectral content change. As indicated in Figure 6, the present computational PSD results are listed on the left, and the experimental (Yu et al., 2012) results are on the right to further verify the present numerical model. The PSD analysis of Figure 6A was based on the pressure signals measured at probe 3, which was in the same location as the pressure signals recorded in the experiment (Yu et al., 2012) (x = 368.3 mm, Figure 6B). A dominant frequency of 1,489 Hz, corresponding to the first longitudinal acoustic mode of the combustor, is identified, as evident in Figure 6A. Compared with the combustion instability frequency in the experiments (Yu, 2009; Smith, 2010) (the first longitudinal acoustic frequency was 1,390 Hz), the present simulated frequency is slightly higher by less than 7.2%, which is more accurate than in previous numerical studies (Smith et al., 2008, 2010a, 2010c; Smith, 2010). It is worth noting that all walls in the present study were considered adiabatic walls. Therefore, the static temperature and speed of sound in the combustion chamber were higher than those in the experiments. Thus, it is reasonable that the frequency was slightly higher than that in the experiments (Yu, 2009; Smith, 2010). In addition, the plot in Figure 6A also suggests that higher harmonics appear in the pressure time signal. Comparing Figures 6A,B, not only does the dominant frequency of the present PSD analysis agree well with the experimental results, but also the non-linear harmonic behavior that occurred in the experiment was also captured in the present simulation. In particular, the increasing then decreasing trend between modes 4, 5, and 6 was captured by the simulation. Accordingly, the accuracy of the model in capturing the combustion dynamics of the present combustor has been verified.

FIGURE 6. Comparison of PSD analysis between numerical results and experimental (Yu et al., 2012) data. The relative error between computed dominant frequency (1,489 Hz) and experimental result (1,390 Hz) is within 7.2%, and that for pressure oscillations is 19.2%. (A) Present numerical result (recorded at probe 3) (B) Experimental result (measured at x = 368.3 mm).
To analyze the mode shape inside the combustion chamber, the instantaneous pressure waves of the combustor centerline over an entire cycle are plotted in Figure 7. The plot not only shows how the pressure changes with time and axial positions inside the combustor but also gives an indication of the pressure oscillation envelope. As shown in Figure 7, the maximum values (in the combustion chamber
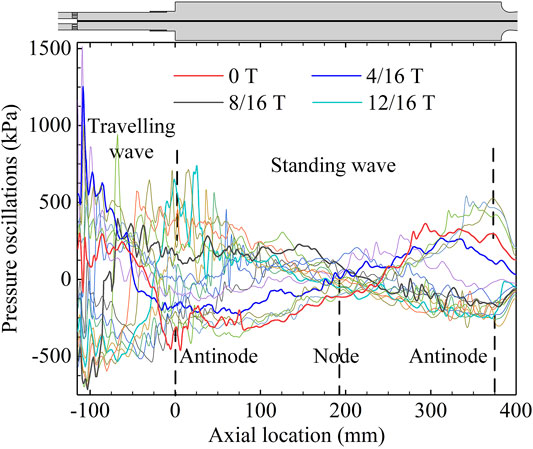
FIGURE 7. Pressure mode shapes in the model combustor. Oscillating pressure of the centerline (the black line on the top of the plot) over an entire cycle. Only four instantaneous pressure waves are highlighted.
Dynamic Mode Decomposition Analysis
Dynamic mode decomposition (DMD (Tu et al., 2014)) is a purely data-driven matrix decomposition technique that does not rely on any prior physical law and aims to characterize data modes using extracted low-dimensional structures. The temporal and spatial modes of the data sets can be decomposed individually by DMD, which makes the method particularly suitable for analyzing the thermoacoustic instability at specific frequencies (Koizumi et al., 2020). Over the past 10 years, several forms of DMD have been developed, and the version used in this study, named exact DMD, was summarized by Tu et al. (Tu et al., 2014). Detailed mathematical algorithms of exact DMD can be found in Ref (Tu et al., 2014).
A total of 201 snapshots of Y slice from the full 3D high-fidelity pressure fields, corresponding to six cycles have been applied to perform DMD analysis. The snapshots are auto-saved every 100 time-steps in the numerical simulation, where the time resolution is
where θ(r) is truncation function. b(i) is the amplitude of the ith mode. n is total number of modes, and j represents the first j modes. Figure 8A presents the amplitude of the first 11 modes, and the relationships between the mode number and truncation function. As evident in Figure 8A, the first 11 modes are enough to make the truncation function up to 95%, which means that the pressure fields can be well reconstructed using the first 11 modes (the deviation from the numerical real pressure field is less than 5%). Therefore, the first 11 modes were selected to realize the pressure field reconstruction (mean field Mode 0, and 5 pairs of conjugate modes, named Mode 1–5).
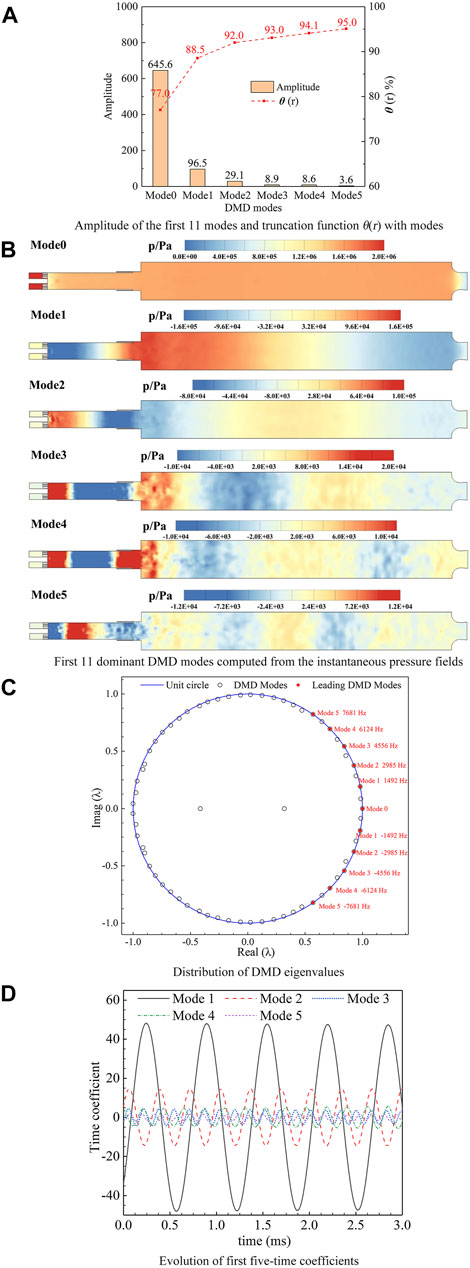
FIGURE 8. DMD analysis results. (A) Amplitude of the first 11 modes and truncation function θ(r) with modes. (B) First 11 dominant DMD modes computed from the instantaneous pressure fields. (C) Distribution of DMD eigenvalues. (D) Evolution of first five-time coefficients.
The first 11 dominant modes are highlighted, corresponding to the modes shown in Figure 8B. As Figure 8D shows, the oscillation amplitude of the Mode1 (first longitudinal mode) is much higher than that of others, which indicates the dominance of the first longitudinal mode (1,492 Hz). Comparing this with the experimental results (1,390 Hz) demonstrates the reasonable accuracy of the present numerical model. The modes 2, 3, 4, 5 are the 1st, 2nd, 3rd, and 4th harmonics of Mode1, because their frequencies are integer multiples of Model 1 frequency. It is noteworthy that the Model1 suggests large pressure oscillations near the combustor step (Figure 8B Model1), which is of great importance to analysis the combustion instability mechanisms Because the amplitudes of the first five-time coefficients remain nearly constant, it can be concluded that the thermoacoustic instability can be maintained during the thermoacoustic coupling process.
Flow Field Snapshots
Instantaneous Flow Fields
Comparing with spectrum analysis, the instantaneous graphs of a specific Y-plane slice make it possible to give a glance at the entire flow field of the combustor. When the time interval between the graphs is small enough, the snapshots can be converted to flow animations, from which the dynamic characteristics can be clearly evaluated, and used to aid interpretation of combustion instability mechanisms. During computations, all data of the entire flow field were auto-saved every 0.02 ms for approximately two periods. This frame rate is sufficient (approximately 34 frames per cycle) to produce high-resolution animations, making it possible to track the dynamic characteristics of the flow field in detail. In this section, the instantaneous snapshots at t = 20.8237 ms are discussed to gain a global comprehension of the flow field. Second, a series of high-time-resolution images are presented to track the dynamic characteristics of the flow field in detail.
Instantaneous snapshots at a given instance, of pressure, vorticity, mass fraction of CH4, heat release rate, and temperature are illustrated by Figure 9. Taking all plots in Figure 9 into account, the combustion appears to occur mainly upstream of the combustion chamber, and there seem to be certain relationships between the plots. Figure 9A shows a low pressure at the combustor step and relatively high pressure around the nozzle, confirming the first longitudinal acoustic mode. As we can see from Figure 9B, vorticity is generated from the choked slot and propagates downstream along with the oxidizer post. Moreover, vorticity also emanates near the combustor step, and the vortices shedding can be easily identified (Figure 9B) slightly downstream of the combustor step. Considering Figures 9B,C together, the CH4 appears to be carried by the vortices, which could be accountable for the vorticity and mass fraction of CH4 being in phase.
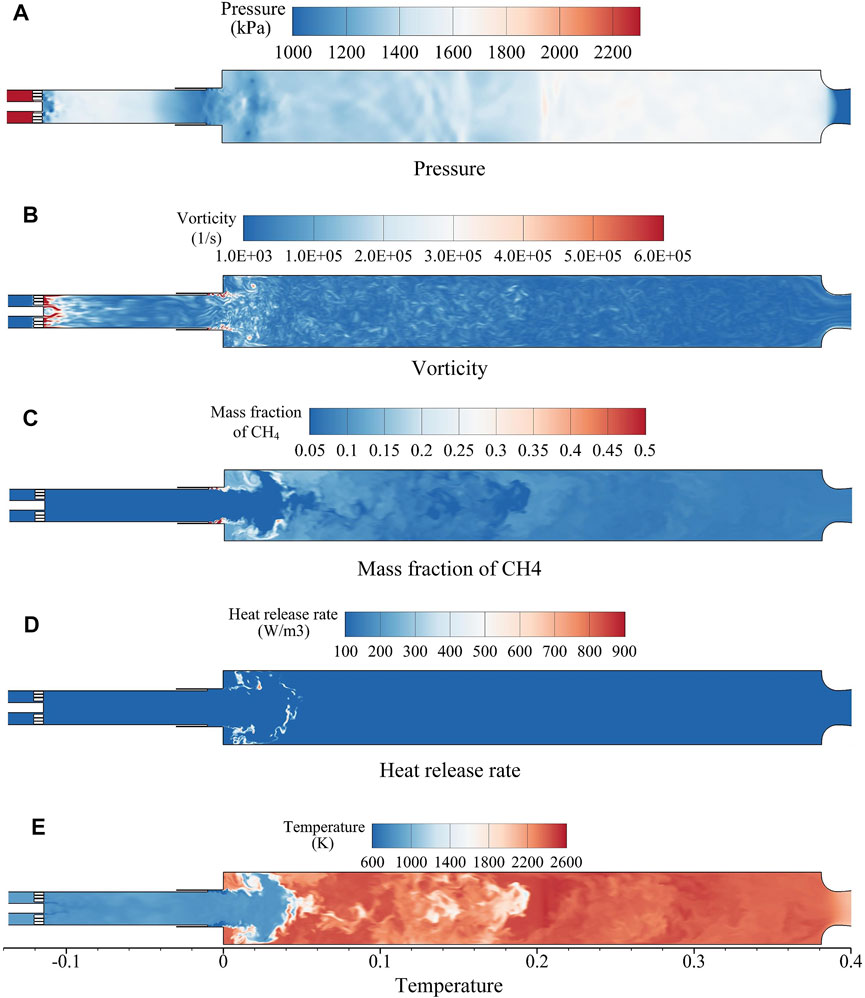
FIGURE 9. Instantaneous snapshots of (A) pressure, (B) vorticity, (C) mass fraction of CH4, (D) heat release rate, and (E) temperature at t = 20.8237 ms
The instantaneous flow field snapshots are very important for confirming the reasonableness of the computational results as well as understanding the flow dynamics and combustion instability mechanisms inside the combustor. Therefore, a series of high-time-resolution plots are desirable to track the dynamic characteristics of the flow field in detail.
A series of high-time-resolution flow field snapshots (mass fraction of CH4, vorticity, heat release, and pressure) are given in Figure 10. As shown in Figure 10 0T, along with the CH4 ejecting into the combustion chamber, vortices emerge at the combustor step. The fuel is trapped in the vortices, causing the fairly low propellant mixing efficiency, which further results in a lower heat release rate near the combustor step (Figure 10 1/6T). Meanwhile, the pressure plot shows a low pressure near the combustor step and a pressure antinode at the nozzle. With vortices shedding, the fuel is rolled up, expended downstream and on both sides, and the high-pressure waves travel upstream from the nozzle. Further, the vortices impact the combustion chamber wall due to the small step height of the combustor (Figure 10 2/6T). The fuel is carried by the vortices and distributed more evenly, as evident by the improved heat release. After the vortices interacts with the chamber wall, the vortices are broken into small vortices, and the mixing efficiency is strongly enhanced, leading to uniform distribution of CH4, as demonstrated in Figure 10 3/6T. The mixing efficiency is greatly enhanced, and the fuel is distributed evenly in the upstream half of the combustor. Consequently, the heat release is increased, and the high-pressure wave propagates further upstream (Figure 10 3/6T). As detailed in Figure 10 4/6T, the heat release further rises due to the turbulent mixing, and high pressure occurs at the combustor step, demonstrating the spatial coupling between heat release and pressure. The high pressure propagates upstream into the oxidizer post and downstream to the choked nozzle. Because of the high pressure in the recess region, the propellant cannot eject from the oxidizer post, which is accumulated near the upstream of the recess region, as evident in Figure 10 4/6T (plot of CH4 mass fraction). Inspection of Figure 10 5/6T indicates that the pressure near the combustor step gradually dissipates, and the propellant package flows downstream in preparation for the next cycle. It can be deduced that the periodic generation and release of propellant parcels are of great importance in sustaining the combustion instability.
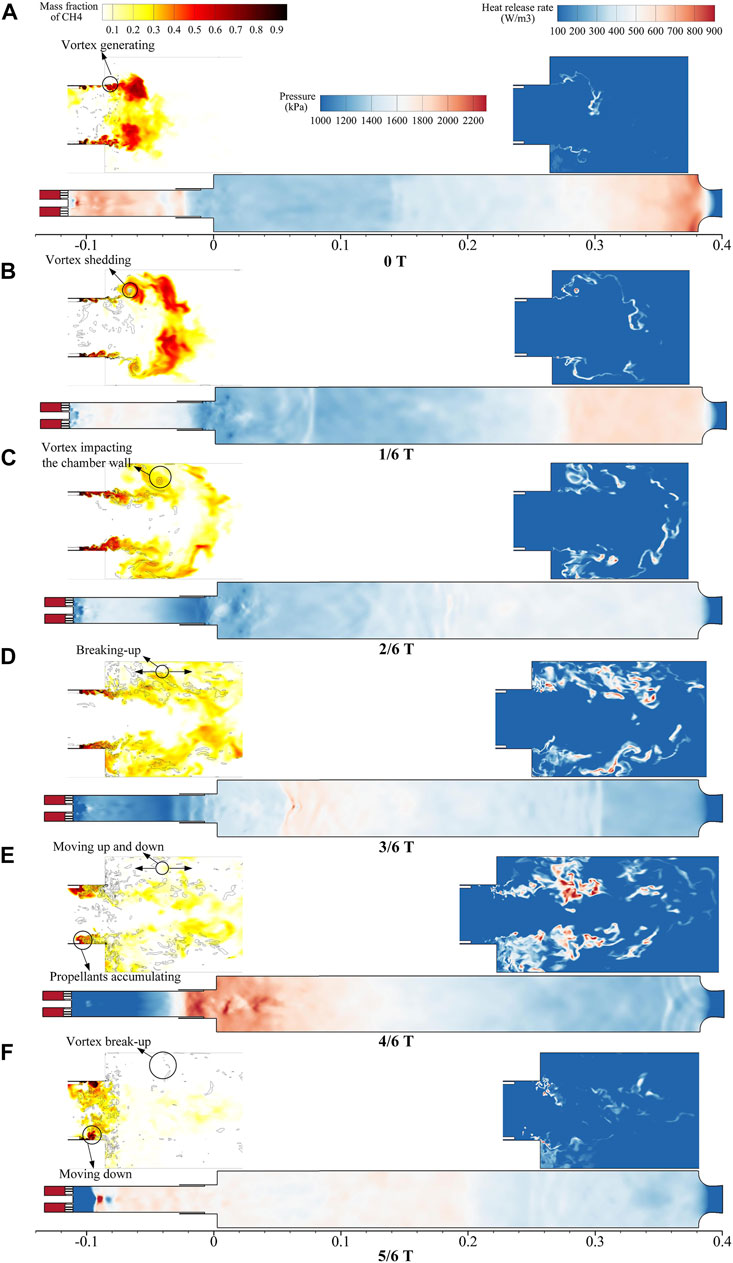
FIGURE 10. Detailed evolution of flow field in one cycle. The majority of CH4 and combustion occur upstream of the combustion chamber. Therefore, the flow fields of CH4 and heat release are shown only upstream of the combustor and scaled by a factor of 2. Black lines in the mass fraction of the CH4 plot denote vorticity.
In dump combustors, vortices which play a critical role in combustion process, are generated in the shear layer at the backward-facing step. When the vortex roll-up process is accompanied by interaction with sidewalls, the interface between the fuel/oxidizer mixture and hot combustion products increases, resulting in fine-scaled turbulent mixing improvement and pulsated heat release. To further investigate the unstable vortex shedding behaviors at the combustor step, the Strouhal number (NguyenTuan et al., 2018) is evaluated as follows:
where
The pressure waves propagate upstream inside the oxidizer post and downstream in the combustion chamber, leading to high-amplitude axial velocity oscillations, which induce the generation of the new vortex. The signals (the data was band-pass filtered) of the probe plane were recorded as face-averaged and are plotted in Figure 11. As can be seen from Figure 11, the pressure and axial velocity are almost out of phase. When the high-pressure waves propagate to the probe plane, the flow in the axial direction is blocked, followed by a decrease in axial velocity. Therefore, the propellant accumulates inside the oxidizer post. When the pressure near the probe plane drops, the axial flow is accelerated and the mass flow rate increases, as shown in Figure 11. With the acceleration of flow in axial direction, the propellant is injected downstream to the combustion chamber periodically, culminating in pulsated heat release. Pulsation of axial velocity will induce oscillations of the propellant mass flow rate, which is essential for maintaining combustion instability.
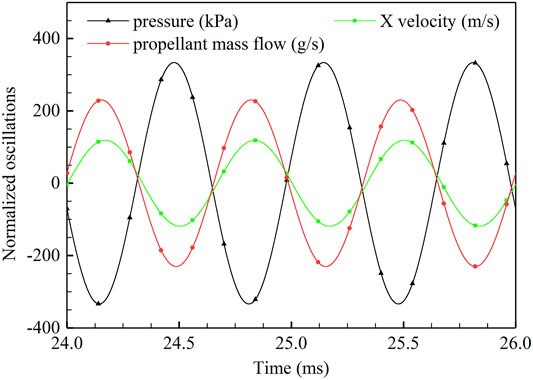
FIGURE 11. Normalized oscillations of pressure, CH4 mass fraction, X-velocity, and O2 mass fraction at probe plane. The signals were band-pass filtered with a center frequency of 1,489 Hz and a bandwidth of 100 Hz.
Benefits from full 3D simulation, the 3D vortex structures, interactions between vortices and CH4 are presented in Figure 12. The results suggest that periodic vortex generating and shedding play a crucial role in driving the combustion instability. As shown in Figure 12 0T. 3D vortex ring is identified at the combustor step, because of the oscillated axial velocity, and much gaseous CH4 is trapped inside the vortex ring. The vortex ring sheds and approaches the combustion chamber wall. Meanwhile, the CH4 is rolled up by vortex ring. Further, the vortex ring interacts with the combustion chamber wall (Figure 12 1/6T). The CH4 is simultaneously transported to the upstream (large recirculation zone) and downstream. The large vortex ring breaks into small vortices, which massively enhances the mixing performance (Figure 12 2/6 T and 3/6T). As such, a large amount of well-mixed propellant is concentrated near the combustor step (large recirculation zone). Combustible gas is consumed quickly, leading to pulsated heat release, causing pressure disturbance near the combustor step, as shown in Figure 10E.
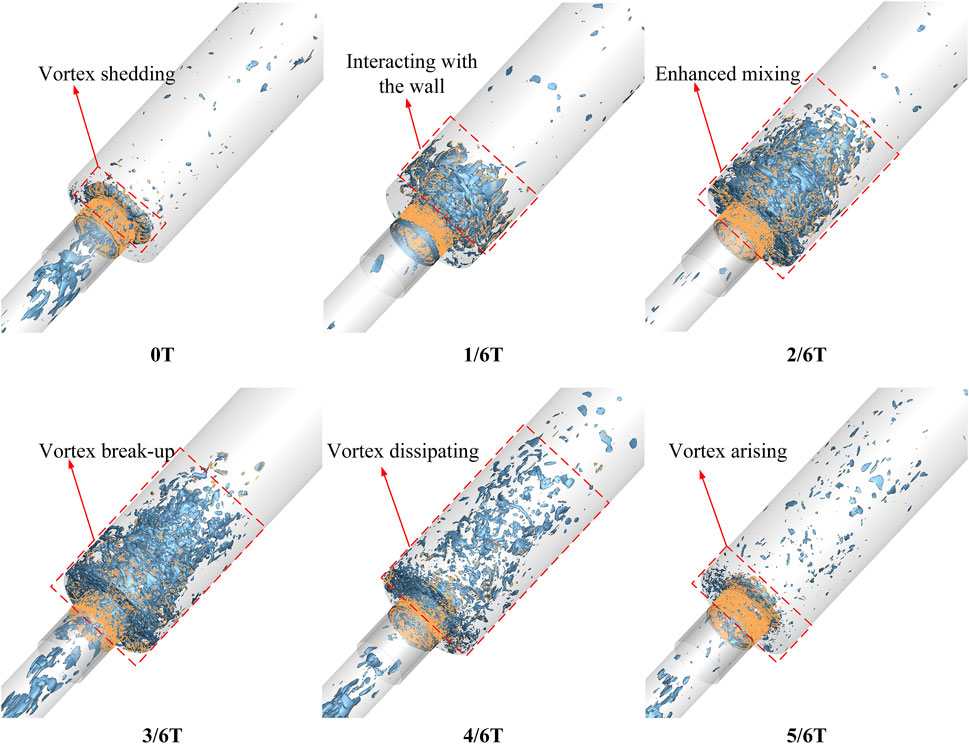
FIGURE 12. Instantaneous 3D vortex iso-surface (value 2.0e+6*s−1) with CH4 mass fraction iso-lines (orange line, value 0.4).
Time-Averaged Flow Fields
Although the time-averaged flow field fails to show the dynamic characteristics, it can illustrate the global features of the combustion chamber and help to comprehend the mechanism of the combustion instability. The time-averaged results [root mean squared error (RMSE)] for CH4 mass fraction, temperature, pressure, and axial (X) velocity are presented in Figure 13. The RMSE flow fields indicate the deviations between the measured and true values (estimated with the mean value in the present study). Consequently, the RMSE results can be used to demonstrate the oscillation features of the fields.
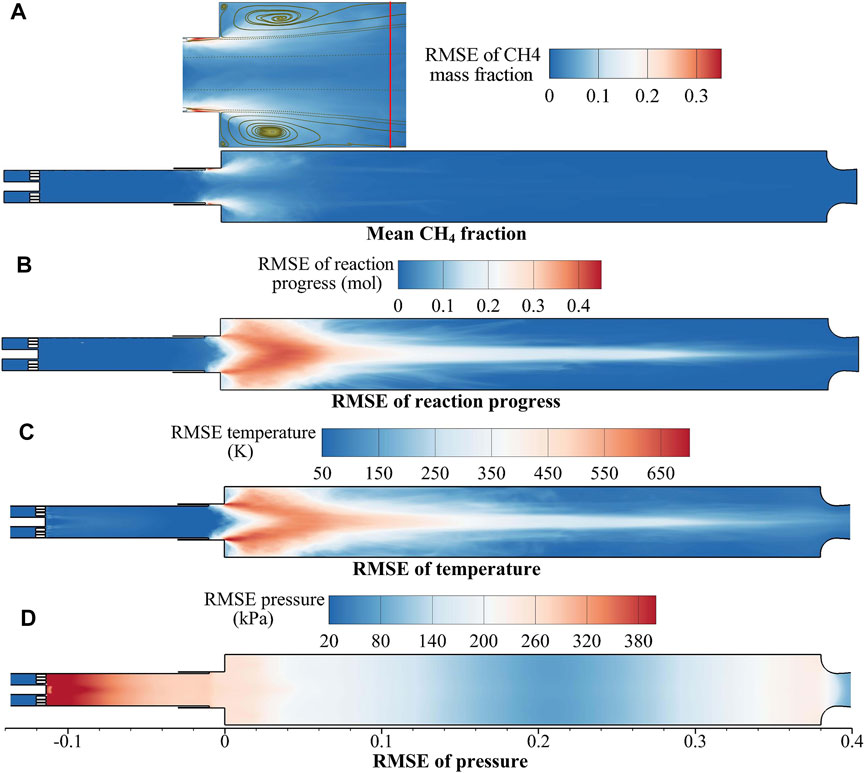
FIGURE 13. RMSE flow fields (A) mass fraction of CH4, (B) reaction progress, (C) temperature, and (D) pressure.
As shown in Figure 13A, the CH4 mass fraction oscillates severely near the combustor step. A detailed plot of the CH4 RMSE around the combustor step is given in the upper left of Figure 13A with the streamlines superimposed. The streamlines reveal the recirculation region after the combustor step, accompanied by the reattachment point (as marked by the vertical red line). Comparison of Figures 13A,B, and (C) show that the mass fraction of CH4 and reaction progress oscillate extremely in the recirculation region. Therefore, severe heat release pulsation (corresponding to periodic thermal excitation source) occurs at the combustor step, which results in temperature oscillation, as evident in Figure 13C. Figure 13D suggests that intensive pressure oscillations occur at the combustor step and nozzle, and the pressure varies sightly near the middle of the combustion chamber, confirming the first longitudinal mode of the combustion instability. The pulsated heat release at the combustor step acts as the energy source for the pressure oscillation. Thus, a pressure antinode appears at the combustor step, demonstrating the spatial consistency of heat release and pressure oscillation.
Combustion Instability Mechanism
To further confirm the driving (positive Rayleigh index) and damping (negative Rayleigh index) locations inside the combustion chamber, Rayleigh index analysis is conducted. The definition of Rayleigh index used in the present work was the same as that used by Harvazinski et al. (Harvazinski et al., 2013), which is given by Eq. 1.
The Rayleigh index displayed in Figure 14, shows the most eye-catching peak near the combustor step. More precisely, the positive Rayleigh index is mainly concentrated in the shear layer and large recirculation zone. The zero contours in the close-up view indicate that there is a negative region near the centerline (oxidizer post), which suggests damping effects in the center of the oxidizer post. These results demonstrate that the primary driving source of the present combustion instability lies at the back step of the chamber. At locations away from the combustor step, the Rayleigh index reduces to zero or even becomes negative, demonstrating the disappearance of driving in these zones. Compared with Figure 12, the driving regions almost coincide with the vortex shedding zones, further affirming the vortex shedding driving mechanism of the combustion instability.
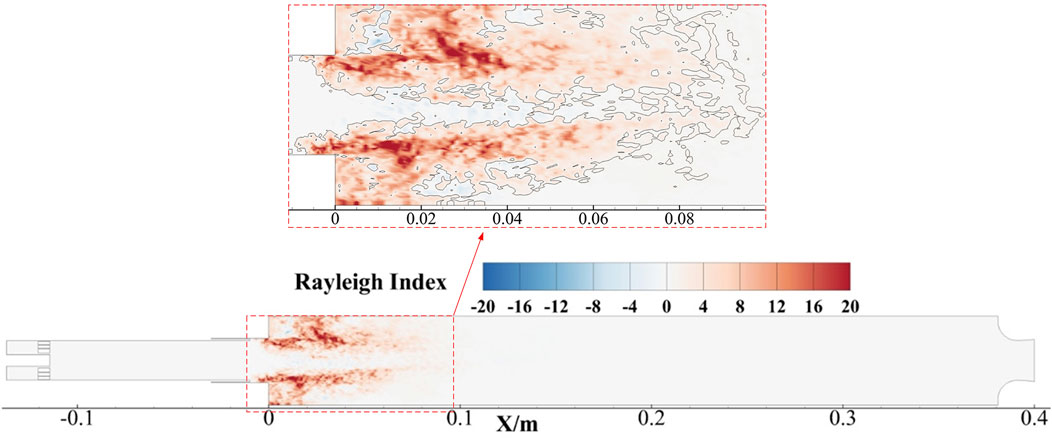
FIGURE 14. Rayleigh index of the center plane (YZ). A close-up view near the combustor step with zero contours is on the top of the plot.
Combined with the above analyses, it seems that the self-sustaining combustion instability mechanism in the present combustor model could be described by the mass flow rate of propellant injecting to the combustion chamber, periodic oscillations, and subsequent vortex shedding and interaction with the combustion chamber wall. In terms of the present dump combustion chamber, the periodic vortex shedding appears at the combustor step caused by the pulsated axial velocity. Part of the unburned propellant is trapped in the vortex, and a local flameout state is formed affected by the step velocity gradients. The heat release rate decreases as dose the pressure (Figure 10B). Along with the growth of the vortex, the vortex impacts the chamber wall and breaks up into small vortices (Figure 12). Propellant mixing is strongly promoted by the vortex break-up, and the reaction progress speeds up, generating a heat release pulsation. The pulsated heat release, just like the periodic thermal energy source, provides energy for combustion instability, leading to acoustic pressure oscillations (Figure 10). The energy added to the acoustic field is in phase with the pressure oscillations, which reinforced the acoustic resonance mode. The acoustic resonance causes high-amplitude axial velocity oscillations (mass flow rate oscillations) which induce the generation of the new vortex. The vortex plays a role in delaying the phase of heat release. The propellant is rolled up and carried into the combustion chamber by the vortex and is unable to burn out immediately. A lot of heat will not be released until the vortex impacts the chamber wall. In this way, the phase of heat release is modulated by the vortex shedding to be close to the phase of the pressure, and self-sustaining combustion instability occurs.
Conclusion
Based on a hybrid RANS/LES and FGM methods, a comprehensive numerical study was conducted to investigate the unstable combustion characteristics of a CVRC. Severe combustion instability was captured for the combustor. The unstable combustion modes were identified by the PSD and DMD techniques. Rayleigh index was introduced to evaluate the coupling relationship between pressure and heat release rate. Finally, the combustion instability mechanisms in the CVRC were clarified by tracking snapshots of the flow fields.
The numerical results agree well with experimental results in terms of unstable combustion instability frequency and PSD analysis. The pressure waves propagate upstream to the oxidizer post and downstream to the chamber, arousing axial velocity and mass flow rate of propellant oscillations both in the oxidizer post and combustion chamber. A pressure wave mode, extracted by the DMD method, is coupled with the first longitudinal acoustic mode of the combustion chamber. According to a study of the temporal phase difference, the pressure oscillations and heat release rate are almost in phase at the head of the combustion chamber, and the driving source is mainly located upstream of the chamber, which was further confirmed by the Rayleigh index and time-averaged flow field snapshots.
The flow field evolutions in one cycle were tracked in detail with fine time resolution. 3D vortex ring shedding processes were captured. It was found that the mass flow rate oscillations inside the oxidizer post, along with large vortex ring shedding and interaction with the chamber wall are of great importance in maintaining unstable combustion. The unburnt reactants are rolled up by the vortex. As the vortex ring impacts the chamber wall, it breaks into small vortices, which greatly enhances the turbulent mixing, leading to sudden heat release. The energy added to the acoustic field is in phase with the pressure oscillations, which reinforces the acoustic resonance mode. The acoustic resonance causes high-amplitude axial velocity oscillations (propellant mass flow rate oscillations), which induce the generation of the new vortex.
Data Availability Statement
The raw data supporting the conclusions of this article will be made available by the authors, without undue reservation.
Author Contributions
GK mainly contributed to numerical simulation model. RY and XB contributed primarily to data processing and writing. TY contributed primarily to data processing. NW mainly provided financial support for the numerical simulation.
Funding
National Natural Science Foundation of China (No. 12002386, 51876219).
Conflict of Interest
The authors declare that the research was conducted in the absence of any commercial or financial relationships that could be construed as a potential conflict of interest.
Publisher’s Note
All claims expressed in this article are solely those of the authors and do not necessarily represent those of their affiliated organizations, or those of the publisher, the editors, and the reviewers. Any product that may be evaluated in this article, or claim that may be made by its manufacturer, is not guaranteed or endorsed by the publisher.
Acknowledgments
The authors would like to express their sincere acknowledgments for support from Department of Aerospace Science and Technology. The authors gratefully acknowledge the computing resources provided by Beijing Beilong Super Cloud Computing Co., Ltd. The company was not involved in the study design, collection, analysis, interpretation of data, the writing of this article or the decision to submit it for publication.
References
Bedard, M. J., Sardeshmukh, S. V., Fuller, T., Anderson, W. E., and Tanabe, M. (2014). “Chemiluminescence as a Diagnostic in Studying Combustion Instability in a Practical Combustor,” in 50th AIAA/ASME/SAE/ASEE Joint Propulsion Conference, Cleveland, OH, July 28–30, 2014. doi:10.2514/6.2014-3660
Bhatia, R., and Sirignano, W. A. (1991). One-dimensional Analysis of Liquid-Fueled Combustion Instability. J. Propulsion Power 7 (6), 953–961. doi:10.2514/3.23413
Buschhagen, T., Gejji, R., Philo, J., Tran, L., Enrique Portillo Bilbao, J., and Slabaugh, C. D. (2018). Experimental Investigation of Self-Excited Combustion Instabilities in a Lean, Premixed, Gas Turbine Combustor at High Pressure. J. Eng. Gas Turbines Power 140 (11), 111503. doi:10.1115/1.4039760
Coates, R. L., and Horton, M. D. (1974). Further Considerations on the Interaction of Sound and Flow in Rocket Motors and T-Burners. Combustion Sci. Technol. 9 (3-4), 95–102. doi:10.1080/00102207408960343
Culick, F. E. C. (1970). Stability of Longitudinal Oscillations with Pressure and Velocity Coupling in a Solid Propellant Rocket. Combustion Sci. Technol. 2 (4), 179–201. doi:10.1080/00102207008952247
Duvvuri, P. P., Shrivastava, R. K., and Sreedhara, S. (2020). Numerical Optimization of a Diesel Combustion System to Reduce Soot Mass and Particle Number Density. Fuel 266, 117015. doi:10.1016/j.fuel.2020.117015
Franzelli, B., Riber, E., Sanjosé, M., and Poinsot, T. (2010). A Two-step Chemical Scheme for Kerosene-Air Premixed Flames. Combustion and Flame 157 (7), 1364–1373. doi:10.1016/j.combustflame.2010.03.014
Frezzotti, M. L., Terracciano, A., Nasuti, F., Hester, S., and Anderson, W. E. (2014). “Low-order Model Studies of Combustion Instabilities in a DVRC Combustor,” in 50th AIAA/ASME/SAE/ASEE Joint Propulsion Conference, Cleveland, OH, July 28–30, 2014. doi:10.2514/6.2014-3485
Garby, R., Selle, L., and Poinsot, T. (2013). Large-Eddy Simulation of Combustion Instabilities in a Variable-Length Combustor. Comptes Rendus Mécanique 341 (1), 220–229. doi:10.1016/j.crme.2012.10.020
Girimaji, S. S. (1991). Assumed β-pdf Model for Turbulent Mixing: Validation and Extension to Multiple Scalar Mixing. Combustion Sci. Technol. 78 (4-6), 177–196. doi:10.1080/00102209108951748
Gregory, P. S., Golden, D. M., Frenklach, M., Moriarty, N. W., Eiteneer, B., Goldenberg, M., et al. (2018). “GRI-Mech 3.0,” Tech. rep., UC Berkeley. Available at: http://combustion.berkeley.edu/gri-mech/(Accessed December 01, 2018).
Harvazinski, M. E., Anderson, W. E., and Merkle, C. L. (2013). Analysis of Self-Excited Combustion Instabilities Using Two- and Three-Dimensional Simulations. J. Propulsion Power 29 (2), 396–409. doi:10.2514/1.B34732
Harvazinski, M. E., Talley, D. G., and Sankaran, V. (2016). “Application of Detailed Chemical Kinetics to Combustion Instability Modeling,” in 54th AIAA Aerospace Sciences Meeting, San Diego, CA, January 4–8, 2016. doi:10.2514/6.2016-1931
Ilbas, M., Kumuk, O., and Karyeyen, S. (2021). Numerical Study of a Swirl Gas Turbine Combustor for Turbulent Air and Oxy-Combustion of Ammonia/kerosene Fuels. Fuel 304, 121359. doi:10.1016/j.fuel.2021.121359
Issa, R. I. (1985). Solution of the Implicitly Discretised Fluid Flow Equations by Operator-Splitting. JCoPh 62 (1), 40–65. doi:10.1016/0021-9991(86)90099-9
Jiang, Y., Lee, B.-H., Oh, D.-H., and Jeon, C.-H. (2021). Optimization of Operating Conditions to Achieve Combustion Stability and Reduce NOx Emission at Half-Load for a 550-MW Tangentially Fired Pulverized Coal Boiler. Fuel 306, 121727. doi:10.1016/j.fuel.2021.121727
Jurić, F., Stipić, M., Samec, N., Hriberšek, M., Honus, S., and Vujanović, M. (2021). Numerical Investigation of Multiphase Reactive Processes Using Flamelet Generated Manifold Approach and Extended Coherent Flame Combustion Model. Energ. Convers. Manage. 240, 114261. doi:10.1016/j.enconman.2021.114261
Kim, H. J., Seo, S., Lee, K. J., Han, Y. M., Lee, S. Y., and Ko, Y. S. (2008). Stability Rating Tests for the Length-Optimization of Baffles in a Liquid Propellant Combustion Chamber Using a Pulse Gun. Aerospace Sci. Technol. 12 (3), 214–222. doi:10.1016/j.ast.2007.06.003
Koizumi, H., Tsutsumi, S., Omata, N., and Shimizu, T. (2020). “Thermoacoustic Coupling Mechanism of Combustion Instability in a Continuously Variable Resonance Combustor,” in AIAA Scitech 2020 Forum, Orlando, FL, January 6–10, 2020. doi:10.2514/6.2020-1071
Lemcherfi, A. I., Gejji, R., Fuller, T. L., Anderson, W. E., and Slabaugh, C. D. (2019). “Investigation of Combustion Instabilities in a Full Flow Staged Combustion Model Rocket Combustor,” in AIAA Propulsion and Energy 2019 Forum, Indianapolis, IN, August 19–22, 2019. doi:10.2514/6.2019-3948
Liu, X., Wang, H., Zheng, Z., and Yao, M. (2021). Numerical Investigation on the Combustion and Emission Characteristics of a Heavy-Duty Natural Gas-Diesel Dual-Fuel Engine. Fuel 300, 120998. doi:10.1016/j.fuel.2021.120998
Liu, Y., Li, J., Zhang, T., and Yan, Y. (2021). Active Suppression of Swirl-Stabilized Combustion Instability. Fuel 287, 119559. doi:10.1016/j.fuel.2020.119559
Lyu, Z., Jia, X., Yang, Y., Hu, K., Zhang, F., and Wang, G. (2021). A Comprehensive Investigation of LSTM-CNN Deep Learning Model for Fast Detection of Combustion Instability. Fuel 303, 121300. doi:10.1016/j.fuel.2021.121300
Menter, F. (2016). Stress-Blended Eddy Simulation (SBES)—A New Paradigm in Hybrid RANS-LES Modeling. Symp. Hybrid RANS-LES Methods. doi:10.2514/1.59770
Menter, F. R. (1994). Two-equation Eddy-Viscosity Turbulence Models for Engineering Applications. AIAA J. 32 (8), 1598–1605. doi:10.2514/3.12149
Mohan, A. T., Visbal, M. R., and Gaitonde, D. V. (2015). “Model Reduction and Analysis of Deep Dynamic Stall on a Plunging Airfoil Using Dynamic Mode Decomposition,” in 53rd AIAA Aerospace Sciences Meeting, January 5–9, 2015, Kissimmee, FL. doi:10.2514/6.2015-1058
Murayama, S., Kinugawa, H., Tokuda, I. T., and Gotoda, H. (2018). Characterization and Detection of Thermoacoustic Combustion Oscillations Based on Statistical Complexity and Complex-Network Theory. Phys. Rev. E 97 (2), 022223. doi:10.1103/PhysRevE.97.022223
NguyenTuan, T. M., PopovPavel, P. P., and Sirignano, W. A. (2018). Longitudinal Combustion Instability in a Rocket Engine with a Single Coaxial Injector. J. Propulsion Power 34, 354–373. doi:10.2514/1.B36516
Nicoud, F., and Ducros, F. (1999). Subgrid-Scale Stress Modelling Based on the Square of the Velocity Gradient Tensor. Flow Turbulence and Combustion 62 (3), 183–200. doi:10.1023/A:1009995426001
Nozari, H., and Karabeyoğlu, A. (2015). Numerical Study of Combustion Characteristics of Ammonia as a Renewable Fuel and Establishment of Reduced Reaction Mechanisms. Fuel 159, 223–233. doi:10.1016/j.fuel.2015.06.075
Oefelein, J. C., and Yang, V. (1993). Comprehensive Review of Liquid-Propellant Combustion Instabilities in F-1 Engines. J. Propulsion Power 9 (5), 657–677. doi:10.2514/3.23674
Peters, N. (2000). Turbulent Combustion. Cambridge: Cambridge University Press. doi:10.1017/CBO9780511612701
Ramaekers, W. (2011). Development of Flamelet Generated Manifolds for Partially-Premixed Flame Simulations. Eindhoven, Netherlands: Technische Universiteitndhoven. doi:10.6100/IR716707
Rayleigh (1878). The Explanation of Certain Acoustical Phenomena 1. Nature 18 (455), 319–321. doi:10.1038/018319a0
Ruan, C., Chen, F., Yu, T., Cai, W., Mao, Y., Qian, Y., et al. (2020). Experimental Study on Combustion Stability Characteristics in Liquid-Fueled Gas Turbine Model Combustor: Fuel Sensitivities and Flame/flow Dynamics. Fuel 265, 116973. doi:10.1016/j.fuel.2019.116973
Sattelmayer, T. (2003). Influence of the Combustor Aerodynamics on Combustion Instabilities from Equivalence Ratio Fluctuations. J. Eng. Gas Turbines Power 125 (1), 11–19. doi:10.1115/1.1365159
Schadow, K. C., and Gutmark, E. (1992). Combustion Instability Related to Vortex Shedding in Dump Combustors and Their Passive Control. Prog. Energ. Combustion Sci. 18 (2), 117–132. doi:10.1016/0360-1285(92)90020-2
Schmitt, T., Méry, Y., Boileau, M., and Candel, S. (2011). Large-Eddy Simulation of Oxygen/methane Flames under Transcritical Conditions. Proc. Combustion Inst. 33 (1), 1383–1390. doi:10.1016/j.proci.2010.07.036
Sisco, J. C. (2007). Measurement and Analysis of an Unstable Model Rocket Combustor. Available at: https://docs.lib.purdue.edu/dissertations/AAI3291091/.
Smith, R., Xia, G., Anderson, W., and Merkle, C. (2010). “Computational Studies of the Effects of Oxidizer Injector Length on Combustion Instability,” in 46th AIAA/ASME/SAE/ASEE Joint Propulsion Conference & Exhibit, Nashville, TN, July 25–28, 2010. doi:10.2514/6.2010-6564
Smith, R., Xia, G., Anderson, W., and Merkle, C. (2010). “Extraction of Combustion Instability Mechanisms from Detailed Computational Simulations,” in 48th AIAA Aerospace Sciences Meeting Including the New Horizons Forum and Aerospace Exposition, Orlando, FL, January 04–07, 2010. doi:10.2514/6.2010-1152
Smith, R., Ellis, M., Xia, G., Sankaran, V., Anderson, W., and Merkle, C. L. (2008). Computational Investigation of Acoustics and Instabilities in a Longitudinal-Mode Rocket Combustor. AIAA J. 46 (11), 2659–2673. doi:10.2514/1.28125
Smith, R. J. (2010). Computational Investigations of High Frequency Acoustics and Instabilities in a Single-Element Rocket Combustor. West Lafayette, IN: PhD. Purdue University, 251. Available at: https://docs.lib.purdue.edu/dissertations/AAI3444748/.
Smith, R., Nugent, N., Sisco, J., Xia, G.-P., Sankaran, V., Anderson, W., et al. (2006). “Experimental and Computational Investigation of Combustor Acoustics and Instabilities, Part I: Longitudinal Modes,” in 44th AIAA Aerospace Sci. Meet. Exhibit, Reno, Nevada, January 09–12, 2006. doi:10.2514/6.2006-537
Smith, R., Xia, G., Anderson, W. A., and Merkle, C. L. (2010). Computational Simulations of the Effect of Backstep Height on Nonpremixed Combustion Instability. AIAA J. 48 (9), 1857–1868. doi:10.2514/1.40385
Srinivasan, S., Ranjan, R., and Menon, S. (2015). Flame Dynamics during Combustion Instability in a High-Pressure, Shear-Coaxial Injector Combustor. Flow Turbulence Combust 94 (1), 237–262. doi:10.1007/s10494-014-9569-x
Tu, J. H., Rowley, C. W., Luchtenburg, D. M., Brunton, S. L., and Kutz, J. N. (2014). On Dynamic Mode Decomposition: Theory and Applications. J. Comput. Dyn. (1), 391–421. doi:10.3934/jcd.2014.1.391
Urbano, A., Selle, L., Staffelbach, G., Cuenot, B., Schmitt, T., Ducruix, S., et al. (2016). Exploration of Combustion Instability Triggering Using Large Eddy Simulation of a Multiple Injector Liquid Rocket Engine. Combustion and Flame 169, 129–140. doi:10.1016/j.combustflame.2016.03.020
Verma, I., Yadav, R., Nakod, P., Sharkey, P., Li, S., and Meeks, E. (2019). “Flamelet Generated Manifold Simulation of Turbulent Non-premixed Bluff Body Flames,” in ASME 2019 Gas Turbine India Conference. Volume 2, Chennai, India, December 5–6, 2019. doi:10.1115/GTINDIA2019-2525
Wierman, M., Morgan, C., and Anderson, W. (2012). “Effect of Step Height on Level of Combustion Instability in a Subscale Transverse Rocket Combustor,” in 48th AIAA/ASME/SAE/ASEE Joint Propulsion Conference & Exhibit, Atlanta, Georgia, July 30–August 01, 2012. doi:10.2514/6.2012-4205
Xia, C., Brindhadevi, K., Elfasakhany, A., Alsehli, M., and Tola, S. (2021). Numerical Modelling of the Premixed Compression Ignition Engine for superior Combustion and Emission Characteristics. Fuel 306, 121540. doi:10.1016/j.fuel.2021.121540
Xia, Y., Sharkey, P., Orsino, S., Kuron, M., Menter, F., Verma, I., et al. (2021). Stress-Blended Eddy Simulation/Flamelet Generated Manifold Simulation of Film-Cooled Surface Heat Transfer and Near-Wall Reaction. J. Turbomach. 143 (1), 011008. doi:10.1115/1.4049133
Xia, Y., Stopford, P., Sharkey, P., and Verma, I. (2021). “GT2021-59100 Dynamic Mesh Adaption for Scale-Resolving Reacting Flow Simulations,” in Turbo Expo 2021 Turbomachinery Technical Conference & Exposition, June 7–11, 2021. doi:10.1115/GT2021-59100
Yu, X., Verma, I., Zore, K., and Sharkey, P. (2020). “AIAA-2020-0175 SBES/FGM Simulation of Forced Response of a Premixed Blu-Body Stabilized Flame,” in AIAA Scitech 2020 Forum, Orlando, FL, January 6–10, 2020. doi:10.13140/RG.2.2.32167.91043/1
Yu, Y. C. (2009). “Experimental and Analytical Investigations of Longitudinal Combustion Instability in a Continuously Variable Resonance Combustor (CVRC),”. Available at: https://docs.lib.purdue.edu/dissertations/AAI3378922/.
Yu, Y. C., Sisco, J. C., Rosen, S., Madhav, A., and Anderson, W. E. (2012). Spontaneous Longitudinal Combustion Instability in a Continuously-Variable Resonance Combustor. J. Propulsion Power 28 (5), 876–887. doi:10.2514/1.B34308
Yu, Y., Koeglmeier, S., Sisco, J., and Anderson, W. (2008). “Combustion Instability of Gaseous Fuels in a Continuously Variable Resonance Chamber (CVRC),” in 44th AIAA/ASME/SAE/ASEE Joint Propulsion Conference & Exhibit, Hartford,CT, July 21–23, 2008. doi:10.2514/6.2008-4657
Yu, Y., O'Hara, L., Sisco, J., and Anderson, W. (2009). “Experimental Study of High-Frequency Combustion Instability in a Continuously Variable Resonance Combustor (CVRC),” in 47th AIAA Aerospace Sciences Meeting including The New Horizons Forum and Aerospace Exposition, Orlando, FL, January 05–08, 2009. doi:10.2514/6.2009-234
Zhao, D., Gutmark, E., and Reinecke, A. (2019). Mitigating Self-Excited Flame Pulsating and Thermoacoustic Oscillations Using Perforated Liners. Sci. Bull. 64 (13), 941–952. doi:10.1016/j.scib.2019.05.004
Zhou, M.-m., Thornock, J., Zhan, Z., Dai, J., Smith, S. T., and Smith, P. J. (2021). Numerical Analysis of Particle Dispersion and Deposition in Coal Combustion Using Large-Eddy Simulation. Fuel 304, 121384. doi:10.1016/j.fuel.2021.121384
Nomenclature
Superscripts
Subscripts
i ith species
Keywords: combustion instability, numerical simulation, vortex ring shedding, DMD analysis, rocket propulsion
Citation: Kangkang G, Boqi X, Yongjie R, Yiheng T and Wansheng N (2022) Three-Dimensional Numerical Analysis of Longitudinal Thermoacoustic Instability in a Single-Element Rocket Combustor. Front. Energy Res. 10:835977. doi: 10.3389/fenrg.2022.835977
Received: 15 December 2021; Accepted: 10 January 2022;
Published: 04 February 2022.
Edited by:
Xiao Liu, Harbin Engineering University, ChinaReviewed by:
Fan Zhag, Tianjin University, ChinaQingfei Fu, Beihang University, China
Yang Li, Northwestern Polytechnical University, China
Copyright © 2022 Kangkang, Boqi, Yongjie, Yiheng and Wansheng. This is an open-access article distributed under the terms of the Creative Commons Attribution License (CC BY). The use, distribution or reproduction in other forums is permitted, provided the original author(s) and the copyright owner(s) are credited and that the original publication in this journal is cited, in accordance with accepted academic practice. No use, distribution or reproduction is permitted which does not comply with these terms.
*Correspondence: Ren Yongjie, U3BhY2VkcmVhbWVyQDE2My5jb20=
 Guo Kangkang
 Ren Yongjie
 Tong Yiheng