 Sufen Li
 Kaile Li
 Quanhu Zhang
94% of researchers rate our articles as excellent or good
Learn more about the work of our research integrity team to safeguard the quality of each article we publish.
Find out more
ORIGINAL RESEARCH article
Front. Energy Res., 23 March 2022
Sec. Nuclear Energy
Volume 10 - 2022 | https://doi.org/10.3389/fenrg.2022.835495
This article is part of the Research TopicRadiation Protection and Measurement in Nuclear ReactorsView all 9 articles
As a non-destructive testing and analysis technology, the neutron multiplicity measurement method plays an important role in the field of arms control verification. Great progress has been achieved in the fast neutron multiplicity measurement of plutonium, while there are few studies that have been conducted in the fast neutron multiplicity measurement of uranium. In this study, a set of fast neutron multiplicity measurement devices based on the BC501A liquid scintillation detector was built, and two small mass uranium samples with low density were studied. It is found that the change of the total neutron counting rate is irregular, and the coincidence counting rate will increase linearly with the mass. It is due to the energy loss caused by the scatter of the Am-Li source neutron with the sample, resulting in part of the neutron energy below the threshold. A simulation detection system is built by Geant4 to verify the reliability. On this basis, four kinds of packaging materials such as steel, copper, aluminum, and graphite were studied. The measurement results of different materials were compared and analyzed. The thickness of the material was studied, and the functional relationship curve was fitted. In this study, the fast neutron multiplicity measurement of small-mass and low-density uranium samples was carried out and verified. The influence of different packaging materials on the multiplicity measurement was analyzed, which is of great significance for the development of the fast neutron multiplicity measurement technology.
With the continuous development of the nuclear technology, nuclear energy has been applied in various fields. As the important fissile materials, uranium and plutonium play an important role in the nuclear energy utilization technology. Due to the particularity of nuclear materials, especially with the advancement of nuclear arms control and nuclear disarmament, the attribute certification analysis of nuclear materials has attracted more and more attention. The neutron multiplicity measurement method is an important non-destructive analysis technique. The effective mass of nuclear materials can be calculated by establishing the functional relationship between fission neutron and nuclear material properties. According to the spontaneous fission rate and induced fission rate of nuclear materials, different measurement methods can be adopted. 240Pu has a higher spontaneous fission rate, often using the passive measurement method (Sarwar, 2016). The passive measurement method does not need the external neutron source and mainly relies on the spontaneous fission reaction, while 235U and 237Np have higher induced fission rates, often adopting the active measurement method (Hua et al., 2020; Krick et al., 1996; Dolan et al., 2014). The active measurement method irradiates the nuclear material through the external neutron source to induce fission. At present, the neutron multiplicity measurement method is relatively mature, using 3He tube as the neutron detector, and the measurement model is AWCC (Stewart et al., 2000). The fast neutron multiplicity measurement is carried out by using a scintillation detector (BC501A, EJ-309, Stilbene) (Di et al., 2018; Li et al., 2018). The influence of the neutron scattering crosstalk is considered in the measurement, and the equation is corrected (Shin et al., 2017). Compared with the neutron multiplicity measurement equation, the fast neutron multiplicity measurement equation of plutonium deduces the high-order equation (Zhang et al., 2019). At present, the fast neutron multiplicity measurement mostly focuses on nuclides with a high spontaneous fission rate, such as 240Pu. There are few studies on nuclides with a high induced fission rate, such as 235U and 237Np, and most of them are concentrated on large mass and high-density samples (Kerr et al., 2007). Based on the six-probe liquid scintillation detection system, this work studies the fast neutron multiplicity measurement of two small-mass and low-density uranium samples, which is of great significance to broaden the application range of fast neutron multiplicity measurement technology.
Different from the coincidence counting method, the fast neutron multiplicity measurement method establishes an analysis model through neutron counting rate and sample parameters. The model is established on the basis of the “point model” and a series of assumptions, and the equations are deduced by introducing mathematical knowledge such as the probability-generating function and factorial moment (Favalli et al., 2015; Westcott, 1972), as shown in the following equations.
In Eqs 1–3,
The coupling coefficient
The parameters
The detection system consists of six liquid scintillation detectors, iron support, high-voltage power supply, NIM chassis, two four-channel pulse shape discriminators MPD-4, multi-channel scaler MCS6A, and computer. The structure is shown in Figure 1.
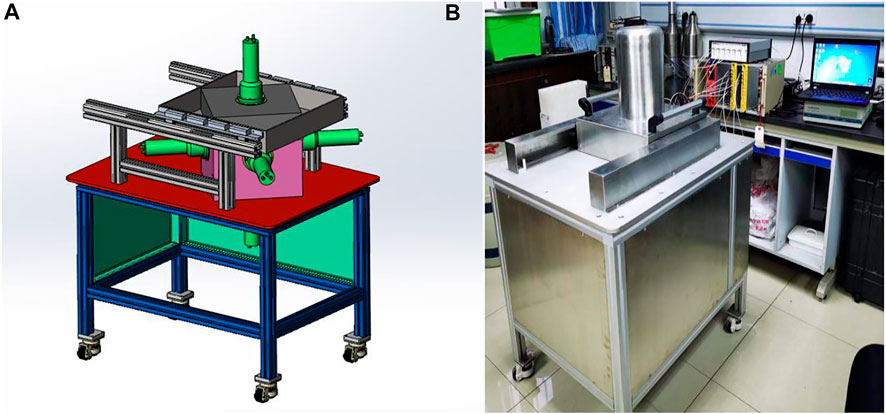
FIGURE 1. Model of the detection system: (A) Theoretical model diagram (B) Actual model diagram.
The liquid scintillator detector is BC501A with a density of 0.874 g/cm3 and a size of Φ 12.7 cm × 5.08 cm. The sample chamber is a closed square with a length of 15.24 cm. Six detectors are located at the center of each surface of the sample chamber. The threshold of the detector is set to 0.15 MeV.
The 252Cf standard source (1.9 × 10⁵cps) was placed at the center of the sample chamber, and the measurement time of the MCS6A scaler was set to 200 s. The measurement result is shown in Table 1. Taking the average neutron counting rate as
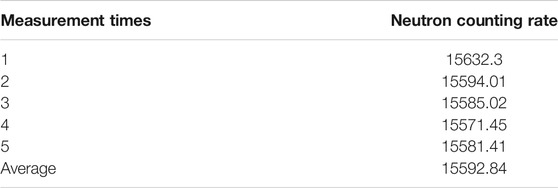
TABLE 1. Measurement result of the 252Cf standard source.
In the absence of radioactive sources, the background counting rate
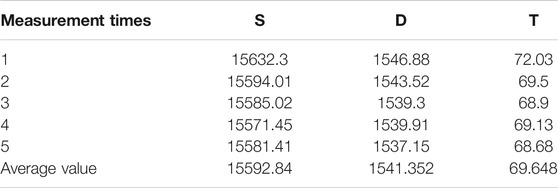
TABLE 2. Multiplicity measurement of the 252Cf standard source.
Substituting the average value to Eqs 7, 8, the coincidence factors
Two samples are measured, and they are all uranium trioxide (U3O8). Sample 1 is composed of 10 screw samples. The size of a single sample is about
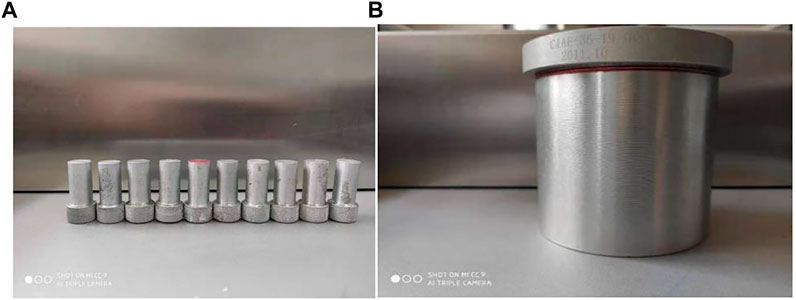
FIGURE 2. Uranium sample: (A) sample 1 (B) sample 2.
The Am-Li source with an intensity of 5 × 10⁴cps is placed on the two opposite corners of the device, respectively, as shown in Figure 3.
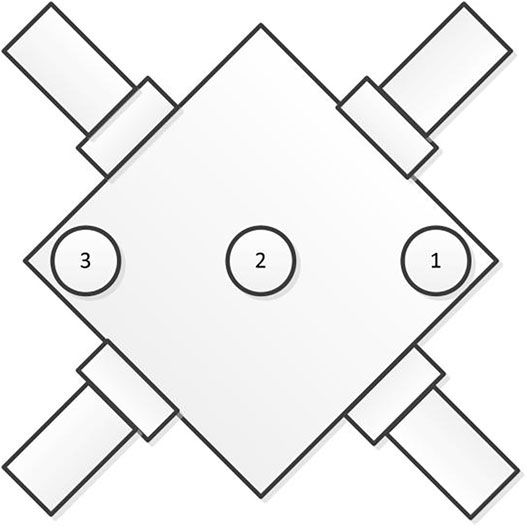
FIGURE 3. Plane distribution of Am-Li sources.
Points 1 and 3 are Am-Li sources, and point 2 is the sample. The background measurement of the Am-Li sources is performed, and the measurement time is set to 1,800 s. The result is shown in Tables 3–5.
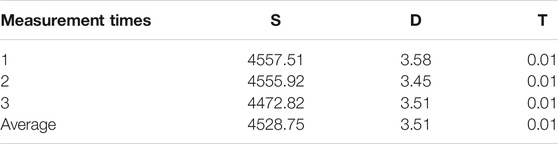
TABLE 3. Background measurement.
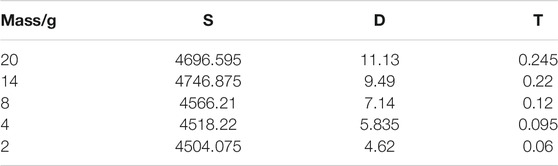
TABLE 4. Sample 1 measurement.
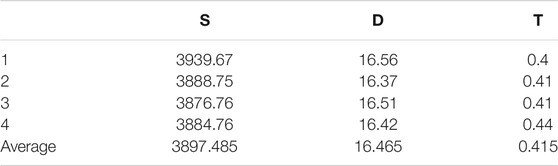
TABLE 5. Sample 2 measurement.
As shown in Figure 4, the double counting rate of sample 1 is fitted, and the fitting equation
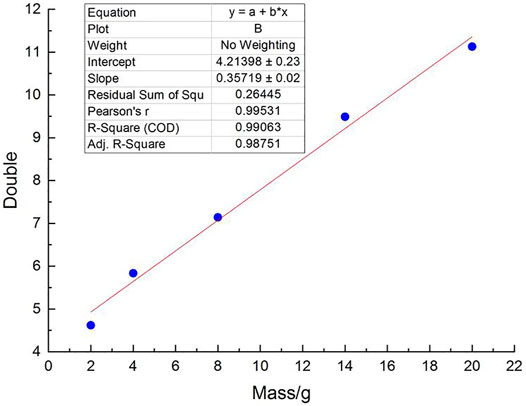
FIGURE 4. Fitting result of the coincidence counting rate.
From the sample 1 measurement, the change of the total counting rate is not obvious, while the change of the coincidence counting rate is obvious, which basically shows a linear relationship with the sample mass. The coincidence counting rate of sample 2 is relatively stable, but there is an experimental phenomenon that the total counting rate is lower than the background counting rate. Combined with the experimental results of sample 1 and sample 2, it is inferred that the background neutron emitted from the Am-Li source will scatter with the sample. Some low-energy neutrons are below the threshold of the detector after losing part of the energy, which makes it impossible to count. The coincidence neutron is mainly from the sample, which will not be affected and will increase with the sample mass.
From the aforementioned experimental results, the variation of the total counting rate is irregular and even lower than the background counting rate, while the coincidence counting rate and the triple counting rate have a good law of growth with the mass. The preliminary analysis is that the energy loss of partial background neutron results in a lower total counting rate. To verify the accuracy of the experimental result and further demonstrate the reasons for the irregular change of the total neutron counting rate, a simulation detection system is built by Geant4. The model is shown in Figure 5.
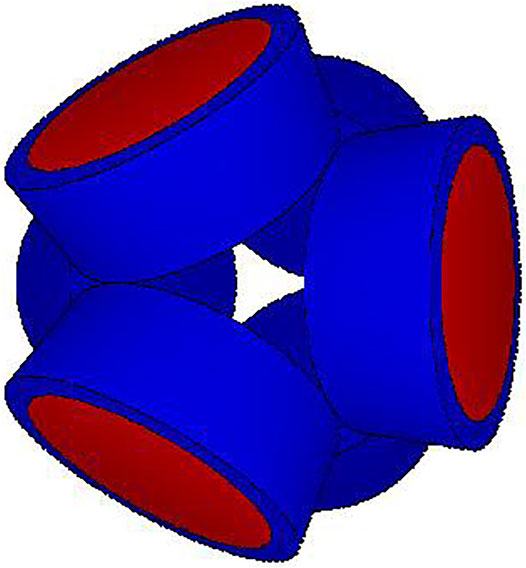
FIGURE 5. Simulation model.
The spatial layout and geometric size of the simulation detection system are consistent with the experimental device. The Am-Li source is set at points 1 and 3, and the source intensity is 5 × 10⁴. The sample with a density of 0.7 g/cm3 is set at point 2. Since the specific spectrum of the Am-Li source is unknown, the average energy of 0.3 MeV is adopted in the simulation, and the energy threshold of the detector is set to 0.15 MeV. The measurement result is shown in Table 6.
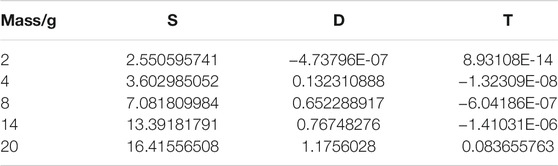
TABLE 6. Measurement result of sample 1.
As shown in Figure 6, the fitting equation is

FIGURE 6. Fitting result of the coincidence counting rate.
It can be seen from Table 6 that when the average energy is 0.3 MeV, the total counting rate and double counting rate will increase with the mass. Under the condition of the 0.15 MeV threshold, the background counting is 0, and the detector only records the neutron generated by the induced fission of the sample. So there is no decrease in the total counting rate. As the energy spectrum of the Am-Li source used in the experimental measurement is continuous, the background count cannot be 0. After placing the sample, the energy of some background neutrons is lower than the threshold due to scattering with the sample, resulting in the irregular change of the total counting rate. Referring to the neutron energy spectrum in reference (Weinmann-Smith et al., 2017), an approximate sectional energy spectrum is compiled to replace the real Am-Li source for measurement. The specific energy information is shown in Table 7, and the result is shown in Table 8.
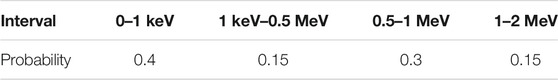
TABLE 7. Sectional energy spectrum.
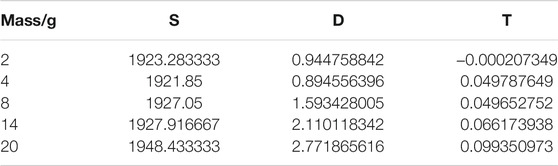
TABLE 8. Sample 1 measurement.
As shown in Figure 7, the fitting equation is
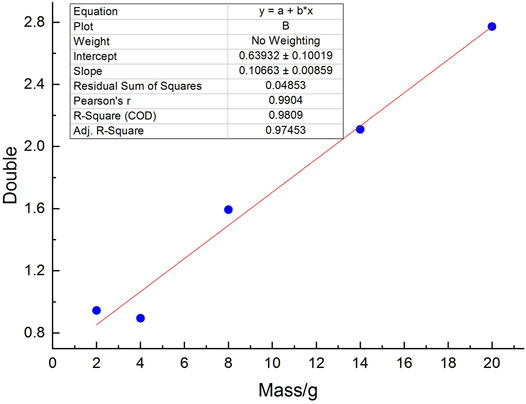
FIGURE 7. Fitting result of the coincidence counting rate.
Similar to the experimental measurement, the total counting rate changes irregularly with the mass, while the double counting rate and triple counting rate will increase regularly. However, the increase amplitude is obviously smaller than the experimental result, particularly due to the difference of the energy spectrum of the Am-Li source. Sample 2 is also measured, and the result is shown in Table 9.
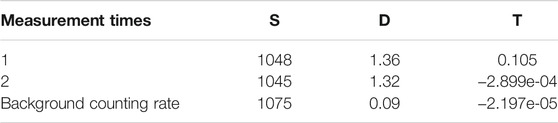
TABLE 9. Sample 2 measurement.
It can be seen from Table 9 that the total counting rate is lower than the background counting rate. Different from sample 1, sample 2 has lower density, larger volume, and smaller abundance, and the scattering effect is more obvious, which leads to more background neutrons unable to count. The experimental result is further verified by the simulation result.
To protect the sample from corrosion, pollution, and leakage, a layer of packaging material is usually installed on the outer layer of the sample. The U3O8 sample used in this study is wrapped with a layer of alloy material. To study the effect of packaging material, the measurement results of various packaging materials are analyzed.
To analyze the influence of material types, the thickness of the packaging layer is set to 2.5 cm uniformly. The radioactive source has a spherical shape with a density of 19.8 g/cm3. The intensity is 5 × 10⁴cps, and the energy is 0.3 MeV. Under four kinds of packaging materials of steel, aluminum, copper, and graphite, the results are obtained, as shown in Figures 8–10. The density of steel is 7.85 g/cm3. The density of aluminum is 2.7 g/cm3. The density of metallic copper is 8.96 g/cm3, and the density of graphite is 2.2 g/cm3.
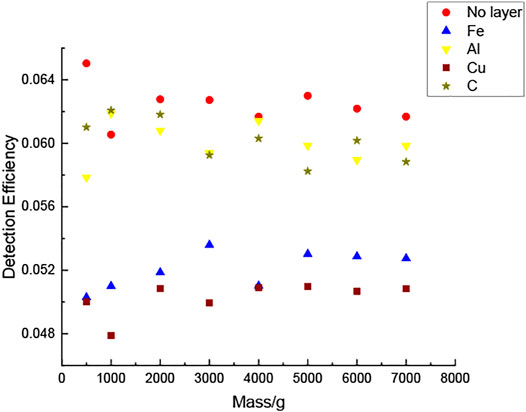
FIGURE 8. Detection efficiency of different packaging materials.
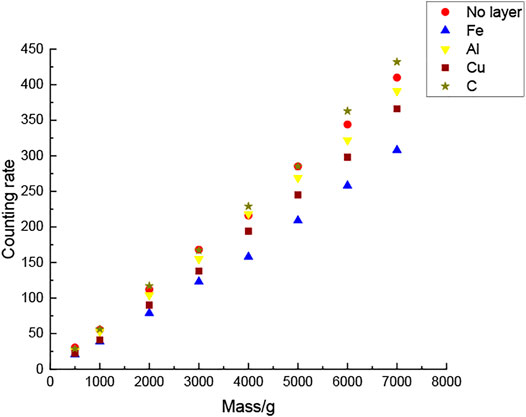
FIGURE 9. Total counting rate of different packaging materials.
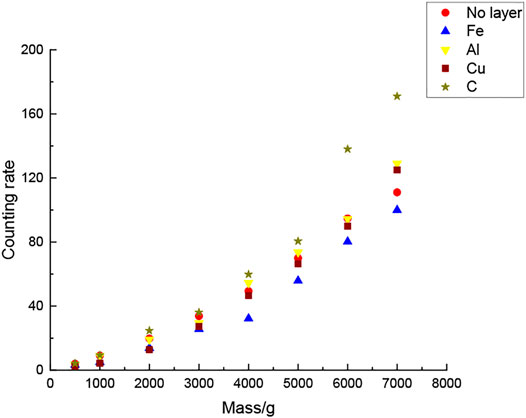
FIGURE 10. Double counting rate of different packaging materials.
It is found that the detection efficiency is reduced after the packaging material is added to the outer layer of the sample. Among them, the detection efficiency of Cu and Fe is lower, while the detection efficiency of C and Al is higher. Compared with other materials, the total neutron counting rate and double counting rate of Cu and Fe are lower, which is the reason for the lower detection efficiency. The scattering cross section of neutrons with hydrogen atoms is relatively high, while the scattering cross section of nuclides with a high atomic number such as metals are relatively low, especially aluminum and zirconium. Therefore, Al has a smaller effect on the measurement result. However, due to the high scattering cross section of C with neutrons, the energy is reduced, which leads to the increase of the induced fission rate of the sample. So the total counting rate is higher than that without the packaging material. Taking 1 kg sample as an example, under the same condition of energy, intensity, and time, the number of induced fission rate under different packaging materials is recorded, as shown in Table 10.
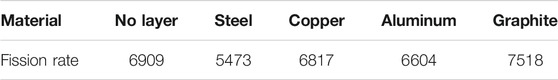
TABLE 10. Fission rate under different packaging materials.
To study the influence of thickness of the packaging layer on the measurement result, the thicknesses of 1.5, 2.0, and 2.5 cm are calculated by using the steel material, as shown in Figure 11.
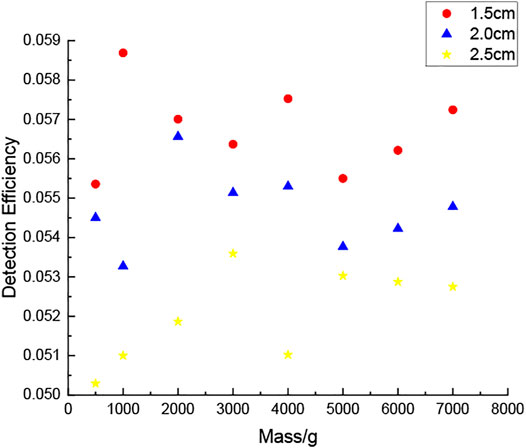
FIGURE 11. Detection efficiency of different thicknesses.
As we can see, with the increase of the thickness, the detection efficiency will gradually decrease. For 3,000 g sample, the detection efficiency of the thickness from 0.5 to 3.5 cm is calculated. The result is shown in Figure 12.
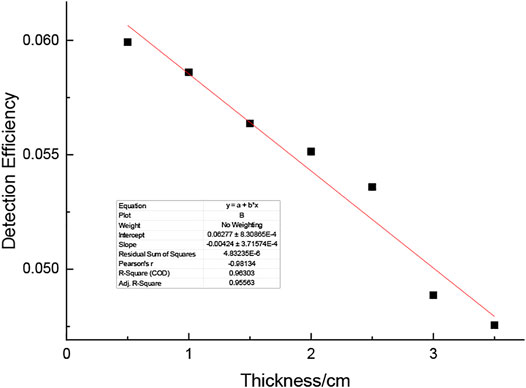
FIGURE 12. Fitting result of the thickness.
The fitting equation is
In this study, two kinds of small-mass and low-density U3O8 samples are measured by a six-probe detection system. It is found that the total neutron counting rate changes irregularly, and the coincidence counting rate increases with the mass. It is due to the energy loss of some neutrons emitted by the Am-Li source after scattering with the sample, which cannot be counted below the energy threshold, resulting in a decrease of the total counting rate. The coincidence neutron is almost from the sample, so it will increase with the mass. To verify this conclusion, a simulation detection system is built by Geant4. The monoenergetic neutron and sectional spectrum are used. It is found that the total counting rate and double counting rate will increase with the mass when using the monoenergetic neutron, while the total counting rate changed irregularly and the double counting rate increased linearly with the mass when using the sectional spectrum. The conclusion is verified through the simulation measurement. Meanwhile, different packaging materials such as steel, copper, aluminum, and graphite are studied, and the measurement results of different materials are analyzed and compared. In addition, the steel material with different thicknesses is studied. It is found that the detection efficiency is approximately linear with the thickness, and the fitting equation is obtained. In this study, a set of detection system is built to study the influence of neutron scattering and packaging material, which is of great significance for the development of the fast neutron multiplicity measurement technology.
The original contributions presented in the study are included in the article/Supplementary Material, further inquiries can be directed to the corresponding author.
All authors listed have made a substantial, direct, and intellectual contribution to the work and approved it for publication.
The authors declare that the research was conducted in the absence of any commercial or financial relationships that could be construed as a potential conflict of interest.
All claims expressed in this article are solely those of the authors and do not necessarily represent those of their affiliated organizations, or those of the publisher, the editors, and the reviewers. Any product that may be evaluated in this article, or claim that may be made by its manufacturer, is not guaranteed or endorsed by the publisher.
The authors extend their sincere thanks to the staff of CIAE and the National Nature Science Fund of China Grants (Agreement Number 51309228) for the financial support for this work. The authors also thank the Shanxi Technology Committee Natural Science Basic Research Project for financially supporting this work (No. 2016JM6026).
Di, F. A., Shin, T. H., and Basley, A. (2018). Fast-neutron Multiplicity Counter for Active Measurements of Uranium Oxide Certified Material[J]. Nucl. Instr. Methods Phys. Res. Section A: Acc. Spectrometers, Detectors Associated Equipment 907, 248–257. doi:10.1016/j.nima.2018.05.049
Dolan, J. L., Marcath, M. J., and Flaska, M. (2014). Active-interrogation Measurements of Fast Neutrons from Induced Fission in Low-Enriched Uranium[J]. Nucl. Instr. Methods Phys. Res. 738 (feb), 99–105. doi:10.1016/j.nima.2013.11.052
Ensslin, N., Krick, M. S., and Langner, D. G. (1991). Active Neutron Multiplicity Counting of Bulk Uranium[C]. Institute of Nuclear Materials Management 32nd Annnul Meeting.
Favalli, A., Croft, S., and Peter, S. (2015). Point Model Equations for Neutron Correlation Counting: Extension of Böhnel׳ S Equations to Any Order. Nucl. Instr. Meth ods Phys. Res. Section A: Acc. Spectrometers, Detectors Associated Equipment 795, 370–375. doi:10.1016/j.nima.2015.06.009
Hua, M. Y., Plummer, T. A., and Hutchinson, J. D. (2020). Measured Nondestructive Assay of $^{237$Np Using Organic Scintillators and Active Neutron Multiplicity Counting. INMM 61th Annual Meeting
Kerr, P., Rowland, M., and Dan, D. (2007). Active Detection of Small Quantities of Shielded Highly-Enriched Uranium Using Low-Dose 60-kev Neutron Interrogation[J]. Nucl. Inst. Methods Phys. Res. B 261 (1-2), 347–350. doi:10.1016/j.nimb.2007.04.190
Krick, M. S., Ensslin, N., and Ceo, R. N. (1996). Analysis of Active Neutron Multiplicity Data for Y-12 Skull Oxide Samples[J].
Li, X., Yao, J., and Ma, J. (2018). Analysis of Measurement Model of Uranium Multiplicity Based on the Liquid Scintillators[J]. J. Phys. Conf. Ser. 1053 (1), 012067. doi:10.1088/1742-6596/1053/1/012067
Sarwar, R. (2016). Fast-neutron Multiplicity Analysis Based on Liquid Scintillation - ScienceDirect[J]. Appl. Radiat. Isot. 110, 53–58. doi:10.1016/j.apradiso.2015.12.064
Shin, T. H., Hua, M. Y., and Fulvio, A. D. (2017). Validation of the Fast-Neutron Multiplicity Expressions for Fissile Mass Estimation[C]. Indian Wells, CA: Institute of Nuclear Materials Management 58th Annual Meeting.
Stewart, J. E., Menlove, H. O., and Mayo, D. R. (2000). The Ephithermal Neutron Multiplicity Counter Design and Performance Manual: More Rapid Plutonium and Uranium Inventory Verifications by Factors of 5-20. office of scientific & technical information technical reports.
Weinmann-Smith, R., Beddingfield, D. H., and Enqvist, A. (2017). Variations in AmLi Source Spectra and Their Estimation Utilizing the 5 Ring Multiplicity Counter[J]. Nucl. Instr. Methods Phys. Res. Section A Acc. Spectrometers Detectors Associated Equipment 856, 17–25. doi:10.1016/j.nima.2017.02.083
Westcott, M. (1972). The Probability Generating Functional[J]. J. Aust. Math. Soc. 14 (04), 448. doi:10.1017/s1446788700011095
Keywords: fast neutron multiplicity, neutron scattering, packaging material, neutron counting rate, detection efficiency
Citation: Li S, Li K, Zhang Q and Cai X (2022) Study on the Fast Neutron Multiplicity Measurement of Uranium Material. Front. Energy Res. 10:835495. doi: 10.3389/fenrg.2022.835495
Received: 14 December 2021; Accepted: 28 February 2022;
Published: 23 March 2022.
Edited by:
Guang Hu, Xi’an Jiaotong University, ChinaReviewed by:
Jianfu Zhang, Northwest Institute of Nuclear Technology, ChinaCopyright © 2022 Li, Li, Zhang and Cai. This is an open-access article distributed under the terms of the Creative Commons Attribution License (CC BY). The use, distribution or reproduction in other forums is permitted, provided the original author(s) and the copyright owner(s) are credited and that the original publication in this journal is cited, in accordance with accepted academic practice. No use, distribution or reproduction is permitted which does not comply with these terms.
*Correspondence: Sufen Li, bGVlc2YyMDA2QHNpbmEuY24=
Disclaimer: All claims expressed in this article are solely those of the authors and do not necessarily represent those of their affiliated organizations, or those of the publisher, the editors and the reviewers. Any product that may be evaluated in this article or claim that may be made by its manufacturer is not guaranteed or endorsed by the publisher.
Research integrity at Frontiers
Learn more about the work of our research integrity team to safeguard the quality of each article we publish.