- 1State Key Laboratory of Petroleum Resources and Prospecting, School of Petroleum Engineering, China University of Petroleum, Beijing, China
- 2Institute of Exploration and Development, Changqing Oilfield Company, Xi’an, China
CO2 flooding can effectively enhance the recovery of low-permeability reservoirs and realize CO2 geological storage. During the displacement process, the minimum miscible pressure (MMP) of CO2 and oil is an important parameter that affects the displacement effect and storage efficiency. However, the microscopic pore-throat structure of low-permeability reservoirs has significant influences on the fluids and phase behaviors. This paper presented a method to determine the miscible state of CO2 flooding based on the microscopic pore-throat structure. Firstly, a physic model was established to quantitatively characterize the microscopic pore-throat structure. Secondly, taking into consideration the P-R equation of state, the gas-liquid equilibrium in the narrow pore-throat was calculated. On this basis, a MMP prediction model was established correspongdingly by considering the multi-stage contact and mass transfer of CO2-oil. Finally, the results obtained by the proposed model were compared with the experimental results of CO2 flooding, and then the model was applied to the actual reservoir to predict plane distribution of MMP. The curves of MMP distribution and pressure drawdown between wells were combined to determine the position of miscible front and non-miscible area at different production stages. The results have shown that the MMP of core sample calculated by the model was 20.3 MPa, which was comparable to that of CO2 flooding experiment, e.g., 20 MPa, and thus indicatesd a high accuracy of the model. The MMP in the well control area of the Y29-101 well group was 19.8 MPa. During the unsteady flow stage, the miscible-phase front was 430 m from the injection well, while it was 310 m from the injection well during the stable flow stage. This method can accurately determine the specific phase distribution of CO2-oil in the formation, which is of great significance to promote the development of CO2 flooding and storage technology, improve the recovery of low permeability reservoirs, ensure energy supply and reduce carbon emission.
Introduction
To achieve zero emissions, the 2015 Paris Agreement initiated a global commitment and effort to reduce CO2 emissions to reduce the risks and impacts of climate change, and more than 20 countries have set net-zero targets (Hassanpouryouzband et al., 2021). Carbon capture, utilization and storage (CCUS) is currently regarded as one of the most promising technologies for greenhouse gas emission reduction. It is highly valued by countries around the world and has increased research and development efforts. Some CCUS projects have been initiated in many countries and regions around the world, and various technologies have been developed for CCUS. A large number of scholars have systematically summarized CCUS technologies and projects. Tapia et al. (2018) has provided in-depth discussions and insights on global CCUS technologies and trends. Geological storage of CO2 is an important part of CCUS (Datta and Krishnamoorti, 2019). Currently the feasible storage methods are underground, marine, forest and terrestrial ecological storage. Geological storage of CO2 is a mature technology with high potential for storage (Wang et al., 2021). The main sites for underground storage are depleted oil and gas reservoirs (CO2-EOR/EGR), deep saline aqufier, unrecoverable coal seams (CO2-ECBM), and gas hydrate reservoirs (Hassanpouryouzband et al., 2018; Bai et al., 2020). CO2-EOR, also known as CO2 flooding, is a technology that uses CO2 flooding for enhanced recovery while trapping CO2 in the reservoi for a long term, referred to as CO2 sequestration process (Rezk et al., 2019; Wang et al., 2019). Therefore, CO2 flooding is an effective means to realize both geological storage of CO2. and greenhouse gas emissions reduction economically, which is of great practical significance for the realization of Net-Zero (Yuan et al., 2020; Hassanpouryouzband et al., 2021).
In the process of CO2 flooding, CO2 will continuously displace and occupy the volume of crude oil, and dissolve into the formation water and residual oil. Part of the CO2 dissolved in the formation water will then react with the reservoir rock, which results in the storage of the CO2 in the form of minerals in the reservoir, while other part of CO2 will be trapped in the reservoir by the capillary force during the injection process (Wei et al., 2015; Cui et al., 2017; Wang et al., 2019). In other words, the CO2 flooding efficiency will significantly affect the CO2 storage efficiency, for example, improving the CO2 flooding efficiency will further improve the CO2 storage efficiency. The CO2 flooding is usually divided into two categories, including miscible flooding and immiscible flooding (Luo et al., 2017). CO2 immiscible flooding is prone to gas channeling, which not only reduces the oil displacement efficiency and CO2 utilization rate, but also can cause problems such as corrosion of production pipelines and damage to the environment (Fan et al., 2021; Wang et al., 2022). Generally, the CO2-oil system becomes miscible when the formation pressure is higher than the minimum miscible pressure (MMP) (Li and Gu, 2014; Wang et al., 2021). At this time, the oil and gas are dissolved in each other with any interfacial tension forces, which can not only obtain higher recovery rate, but also directly affect the CO2 storage efficiency. This means that MMP is an important parameter that affects the displacement effect and storage efficiency during the displacement process. It is of great importance to calculate the MMP accurately.
Proven reserves of low-permeability reservoirs in China account for 60% of the total remaining petroleum resources and thus demonstrate a large development potential (Wang et al., 2020a). Low-permeability reservoirs generally have geological and fluid characteristics such as poor reservoir physical properties, low porosity, low permeability, severe non-homogeneity and low oil saturation, resulting in poor waterflooding development efficiency. CO2 flooding has been shown to significantly improve the recovery of crude oil from low permeability reservoirs (Yang et al., 2021). Unfortunately, both the critical properties of fluids and the phase change law in the microscopic pore-throat structure of low-permeability reservoirs, which also seriously affects CO2 miscible flooding efficiency and CO2 storage efficiency (Yin et al., 2021), are different from those of conventional reservoirs. Liu and Chen (2010) analyzed the main factors affecting the miscible-phase state of CO2-oil displacement and revealed that pore structure significantly affects the MMP of the CO2-oil system in porous media. Mohammad et al. (2018) investigated the influcences of capillary force and diffusion of CO2 in the pore of tight reservoirs on the recovery of crude oil by establishing an effective CO2 ciuculative-injection model. Wang et al., 2020a compared the recovery variation of cores with heterogeneous pore-throat structure and homogeneous cores during CO2 miscible flooding and concluded that the effectiveness and distribution of fluid flow in sandstone reservoirs are controlled by microscopic pore-throat structure. Huang et al. (2020) studied the effects of reservoir properties and pore structure greatly to CO2 miscible-phase displacement efficiency through experiments such as core flooding, scanning electron microscopy, and nuclear magnetic resonance testing. It can be easily found that the influence of microscopic pore throat structure must be considered with the prupose of determining the MMP, which meets the actual reservoir and reasonably guides the oilfield production. The common methods for determining MMP consist of experimental method and theoretical calculation method (Pi et al., 2021). The slim tube experiment is the most commonly-used method nowadays, but for low-permeability reservoirs, the pore-throat structure differs significantly from the slim tube model, and the slim tube model is expensive and has a long experimental period (Wei et al., 2015; Liu et al., 2017; Xu, 2017). Although the theoretical calculation method is more economical and straightforward, most take crude oil component, injection gas component, or reservoir temperature as the main factors affecting MMP (Nobakht et al., 2008; Kamari et al., 2015; Luo et al., 2017). They do not consider the influences of some critical parameters such as pore throat structure and heterogeneity of the reservoir. Unfortunately, few people have taken microscopic pore throat structure as the main influencing factor on MMP calcualtion, and study its influences on the CO2-crude oil miscible-phase behavior. Therefore, it is of practical and fundamental importance to establish a method to determine the miscible state of CO2 flooding by considering the microscopic pore-throat structure.
In this study, the pore-throat structure is firstly quantitatively characterized and a physical model is established for MMP calculation. On this basis, the P-R equation is modified by the critical parameter transformation equation of the non-wetting phase in the narrow pore throat to obtain the P-R equation of state applicable to low-permeability reservoirs. Meanwhile, the multi-stage contact model was established considering the multi-stage contact and diffusive mass transfer of CO2 and crude oil, and finally the MMP prediction model considering the microscopic pore-throat structure was obtained. The proposed model was verified on an actual reservoir. The results have shown that this method can not only calculate the MMP planar distribution of heterogeneous reservoirs, but also determine the miscible state at different production stages of the CO2 flooding process. The proposed method can significantly promote the development of CO2 flooding and CO2 storage technology, improve the reserve production and recovery of low permeability reservoirs, ensure energy supply and reduce carbon emission.
Experimental
Materials
The block H3, located in the Ordos Basin, Changqing Oilfield, is a typical low-permeability heterogeneous oil reservoir with the reservoir temperature of 60°C and pressure of 13.2 MPa. The viscosity and density of the oil sample obtained from block H3 are 4 mPa·s and 0.88 g/cm3 at formation temperature, respectively. The main oil layers of block H3, including C81, and C81 layers, are mainly deltaic depositions at the front edge of the oilfield. The thickness of the sand body at the front edge reaches 30–50 m (He et al., 2016). The porosity distribution ranges from 6.0 to 12.0% and the permeability distribution ranges from 0.07 to 2.0 mD, indicating that the block H3 could be considered as a low porosity and low permeability reservoir. A core sample from C81 layer with a length of 60 cm and a diameter of 2.5 cm is used for the experiment. Table 1 shows the component of crude oil analyzed from Gas Chromatography-Mass Spectrometry (IATROSCAN MK-6S, Japan). The simulated formation water was prepared with reference to the actual formation water. The brine compositions consist of 22.9 g/L sodium chlorid, 14.3 g/L potassium chloride, 0.569 g/L sodium bicarbonate, 2.762 g/L calcium chloride, distilled water and purity of 99.99% deuterium dioxide. The CO2 purity used in the experiment is 99.9%, which is produced by Beijing Hepu Gas Plant in China.
Equipment
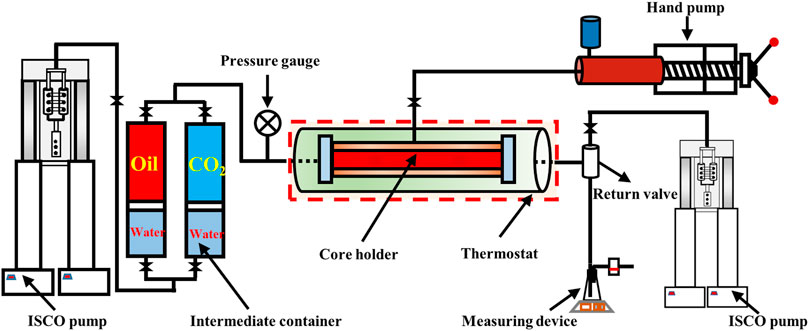
In this paper, high-pressure mercury injection and CO2 flooding experiments were carried out. The equipment used for high-pressure mercury injection analysis is the ASPE-730 mercury analyzer from Coretest, United States. The schematic diagram of CO2 flooding experiment is shown in Figure 1 1) ICSO Pump (Broken Arrow,OK, USA) provides displacement pressure and back pressure for CO2 flooding; (2)Intermediate containers (Hai’an, Nantong, China) with oil and CO2 are respectively installed; 3) Pressure gauge (Dwyer, USA); 4) Core holder (Hai’an, Nantong, China); 5) Thermostat (Hai´an, Nantong, China) ensures that the experimental temperature is stable at 60°C, with an error of ±0.5°C; 6) Hand pump for holding pressure (P5, 35 MPa, 80°C,Oxford, UK); 7) Return valve (HY-2, Nantong, China); 8) Measuring device (50 scm, Alicat Scientific Inc., Tucson, Arizona, USA).
Procedures
CO2 Flooding
Step #1: The permeability of the core sample should be measured before the displacement experiment. In order to measure permeability, the core sample were dried in an oven at 105°C for 10 h. Then, its gas-measuring permeability was determined. After that the core sample was vacuumed with saturated brine.
Step #2: The core sample was again saturated with oil, and the pressures at the inlet and outlet end were 13 and 11 MPa, respectively. If no water was displaced from the outlet for 1 hour, oil injection is stopped and the remaining water in the core sample is the connate water. Then, the core sample were aged in a core holder for 240 h under experimental temperature and pressure conditions.
Step #3: The core samples were displaced with CO2 at a displacement pressure of 16 MPa, a displacement differential pressure of 2 MPa, and an confining pressure of 18 MPa. The oil and gas production data were recorded respectively. When the CO2 injection amount reached 3.5 pore volume (PV), the displacement experiment was stopped.
Step #4: The residual oil in the core sample was thoroughly cleaned with a solution prepared with alcohol and benzene in the volume ratio of 1:3, and then dried at 105°C for 10 h. Repeating step #2.
Step #5: The displacement pressure is set to 18, 20 and 22 MPa, respectively. Repeating step #3. The oil and gas production data were recorded throughout the whole process.
High-Pressure Mercury Injection
After the CO2 flooding experiment was completed, the core sample was cleaned, dried and cut to meet the experimental requirements. After vacuuming the core sample for 2 h, mercury was injected into the core sample until the pressure reached 206.8 MPa. Then, the pressure was reduced and the mercury was gradually discharged to obtain the pore-throat structure parameters at each scale.
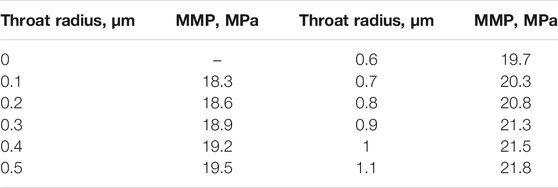
The results showed that the pore radius distribution of the core sample ranges from 40 to 320 μm, with a peak value of about 130 μm. The throat radius ranges from 0.13 to 1.15 μm, and the mainstream throat radius was about 0.5 μm. The throat radius and distribution frequency are shown in Table 2.
Methodology
Quantitative Characterization of Microscopic Pore and Throat Structure
Microscopic heterogeneity mainly focuses on the distribution and size of pore space and pore throat. Pore space mainly characterizes the magnitude of reservoir storage capacity, while pore throat characterizes the magnitude of seepage capacity. To some extent, the influence of pore throat on seepage capacity is much larger than that of pore space (Li and Gu, 2014; Han et al., 2018). This paper focuses on the effect of the throat’s size and distribution on CO2-oil miscible flooding. The mainstream throat contributes 95% to the permeability of core samples, and its radius can be calculated by the following equation (Meng and Liu, 2019; Wang et al., 2020b; Zhong et al., 2021).
Where K is the permeability, rp is the mainstream throat’s radius.
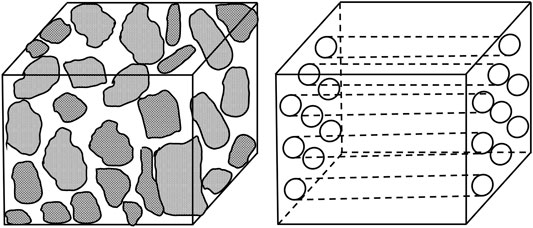
On the other hand, the parameters such as porosity, tortuosity, and specific area of the pore can be characterized by permeability in combination with the capillary bundle model in this paper (Alemu et al., 2013; Gharbi et al., 2013; Zhou et al., 2020; Gao et al., 2021), as shown in Figure 2.
Porosity:
Tortuosity:
Specific surface area:
Poiseuille’s law:
According to Darcy’s law:
Combining Equations 2, 4, 5, we will have:
The capillary bundle model can be corrected by the Kozeny-Calman equation:
Where: L is the length of the rock sample, A is the rock section area; n is the number of capillary roots per area; Ve is the pore volume; Vb is the volume of the rock sample; La is the actual distance passed by the fluid in the core;
Through the above equation, permeability can reflect parameters such as pore tortuosity, porosity and specific surface area. Thus, permeability can be used to comprehensively characterize the heterogeneity of pores and throats and then reflect the microscopic heterogeneity of the reservoir. Therefore, once the relationship between permeability and MMP is clarified, the relationship between any other parameter and MMP can be determined.
However, the pore throat structure in the actual reservoir is extremely difficult to describe. Therefore, based on the quantitative characterization of the microscopic pore throat structure of the reservoir, a physical model for calculating the MMP is established based on a simplification of actual reservoir, as shown in Figure 3. The model is mainly divided into two parts; in the vertical direction, three small layers, each corresponding to a permeability, are established; in the plane, each small layer is subdivided into N units, which have the same reservoir physical properties.
Phase Equilibrium Calculation
The phase equilibrium calculation considers the variation between gas and liquid phases by using the P-R equation of state and the flash vaporization equation. Then, the thermodynamic equilibrium equation is used to determine the fugacity of the gas and liquid phases in the compound. Finally, the MMP can be obtained iteratively.
The P-R equation of state, e.g., vdW one of the most widely used equations in petroleum and chemical industries, can accurately simulate the gas-liquid equilibrium behavior of miscible systems of CO2 and alkanes (Petitfrere and Nichita, 2015; Zhang and Jia, 2019; Yang and Li, 2020).
The basic form of the P-R equation of state is as follows:
where, P is the system pressure, MPa; T is the thermodynamic temperature, K; R is the universal gas constant, which is 8.3145 J/(mol·K); V is the molar volume of the gas phase, L/mol; a, b, and m are the characteristic parameters of the mixture, dimensionless; Tc is the critical temperature, K; Pc is the critical pressure, MPa; Tr is the comparison temperature; and
Nevertheless, there are many narrow throats in low-permeability reservoirs, when the vdW equation is no longer applicable for non-wetting fluids (Duan and Sun, 2003; Li et al., 2020). Zarragoicoechea and Kuz, (2004) proposed the critical parameter of the fluid in narrow pore spaces can be transformed into the following equation.
Where Tcp is the critical temperature of the fluid in the narrow pore, K; Pcp is the critical pressure of the fluid in the narrow pore, MPa; Tc is the critical temperature, K; Pc is the critical pressure, MPa; rp is the radius of the mainstream throat, nm;
From Equations 12, 13, it can be seen that the size of the mainstream throat radius rp directly affects the size of Tcp and Pcp. Tcp and Pcp are corrected by substituting them into the P-R equation of state to combine theory and practice, thus reflecting microscopic heterogeneity.
Since the system is usually miscible, the P-R equation of state needs to be modified by using the mixing rule. The vdW mixing rule was used to express the parameter a and b.
Where kij is the binary interaction coefficient of component i and component j, dimensionless; kij = kji and kii = kjj = 0;
According to the thermodynamic principle, the fugacity coefficient of the mixture can also be derived from the P-R equation of state (Zhang et al., 2017):
Where
When the oil-gas system reaches its critical point, all the intrinsic properties (meaning properties independent of quantity) of the liquid and gas phases are the same, which means that the interfacial tension between the phases is eliminated when the system becomes miscible. Therefore, the pressure corresponding to a certain composition of the oil and gas system at the critical point is generally considered as MMP, and the equilibrium constant of all components tends to be constant (Adesina et al., 2010; Assareh, 2017; Zhang et al., 2017). Ahmed (1997) proposed an accurate miscible function for the oil and gas system near the critical point, which is defined as:
Where zi is the mole fraction of component i, dimensionless; Ei is the equilibrium constant of component i, dimensionless. The miscible function shows that when all the components are changed by CO2 injection and reach the critical components, the function decreases monotonically and tends to 0 or a negative value.
Multi-Stage Contact Model
The MMP of a unit in the microscopic heterogeneous model can be obtained from the above phase equilibrium calculation. However, when injecting CO2 into the reservoir, the crude oil and CO2 will undergo multi-stage contact and mass transfer to reach the miscible phase. Multi-stage contact is divided into forward contact and backward contact (Zhang and Jia, 2019). The forward and backward contact models cannot determine the ratio m between the CO2 and the crude oil during gas injection. Therefore, the diffusion effects between each unit are considered to determine the mass concentration of CO2 in each unit. Taking the first layer in the microscopic heterogeneous model as an example (Figure 3), the equation for the variation of CO2 mass concentration along the seepage direction is established from the idea of differentiaion. Furthermore, the following assumptions are made: 1) adsorption is not considered; 2) the whole flooding process is steady flow; 3) the diffusion coefficient is a constant.
Take a unit in Figure 4 and assume that its length, width and height are dx, dy and dz. According to the law of conservation of matter, in the microscopic hexahedron dxdydz, the mass concentration of the inflowing matter minus the mass concentration of the outflowing matter is equal to the change in the mass concentration of the matter in this hexahedron. The equation for variation of CO2 mass concentration along the direction of seepage in Cartesian coordinates is as follows:
Where: c is the mass concentration of gas in the liquid phase, mol/m3; D is the diffusion coefficient of gas in the liquid phase, m2/s; v is the convection velocity, m3/s.
The initial conditions is:
The boundary conditions is:
Under initial and boundary conditions, the theoretical solution of Eq. 17 is:
Where erfc is the residual error function, and its mathematical meaning is as follows:
The mass concentration distribution function of CO2 in the liquid phase can be available by Equations 17–21. Consequently, the ratio m of CO2 and crude oil is determined and the MMP of each cell of the model is calculated. Consequently, the prediction model of MMP based on microscopic pore-throat structure was established by phase equilibrium and multi-stage contact model.
Model Calculation
Step #1: Firstly, an initial pressure is defined, and the corrected critical temperature Tcp and critical pressure Pcp can be calculated from Equations 12, 13.
Step #2: The initial value of equilibrium constant Ei can be calculated by the Wilson’s equation (Wilson, 1964) as follows:
Where ωi is the acentric factor of component i; Pcpi is the critical pressure of component i; Tcpi is the critical temperature of component i.
Step #3: Through bringing the initial Ei into the two-phase flash evaporation equation (Zhang et al., 2017), the gas-phase molar fraction nV through Newton iteration can be obtained.
Step #4: Both xi and yi can be calculated according to nV, and subsequently are brought into the mixing rule equation (Equations 10, 11) to obtain a, b.
Step #5: Bringing a, b into the P-R equation of state to obtain ZL, ZV, which then can be brought into Eq. 15 to calculate the fugacity coefficients
Step #6: Calculate
Step #7: Bringing Ei and zi into Eq. 16, respectively. When all components reach the critical component, the miscible function will monotonically decrease and tend to 0 and even a negative value. If not, increasing the pressure by 0.1 MPa and repeating the above process to obtain the MMP finally.
Step #8: The MMP of each unit of the microscopic heterogeneous model is calculated according to the multi-stage contact model.
The calculation of the model is implemented by the python programming language, and the calculation process is shown as Figure 5.
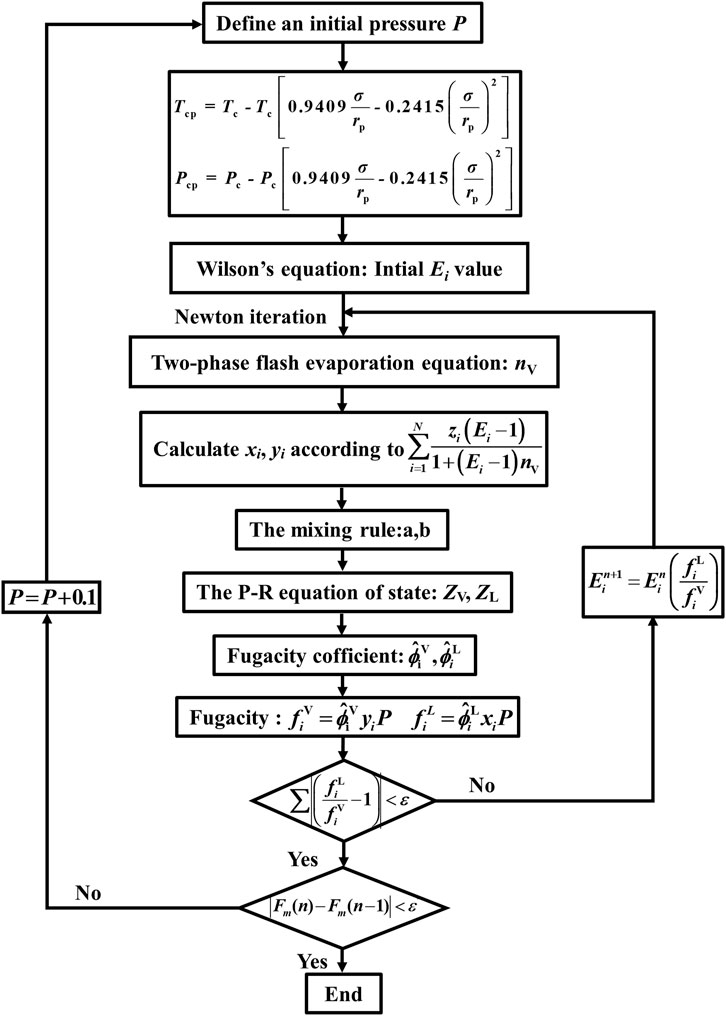
FIGURE 5. Process chart of the calculation of the MMP prediction model based on microscopic pore-throat structure.
Results and Discussion
MMP Distribution of Heterogenrous Core
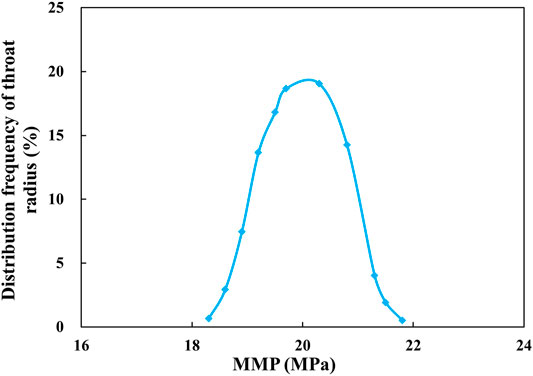
Based on the throat radius of the core sample obtained from high-pressure mercury injection experiment, MMP corresponding to each throat radius can be calculated based on the model in part 3.4. The calculation results have been shown in Table 3. Combined with the distribution frequency of throat radius of the core sample, the distribution map and the cumulative distribution diagram of MMP were plotted, as shown in Figures 6, 7.
Figure 6 shows that MMP distribution in the core sample ranges from 18.3 to 21.8 MPa, and the diagram shows a trend of high in the middle and low on both sides, with the peak at 20.3 MPa, which corresponds to a throat distribution frequency of 19.05%. As shown in Figure 3, when MMP reaches 20.3MPa, the corresponding throat distribution frequency is 90%. Drawing on the thin tube experiment to define the pressure at which the final recovery reaches 90% as MMP. Consequently, the pressure at which more than 90% of the throats can reach miscible phase is selected as the final MMP of the core sample in this paper. In other words, the minimum miscible pressure of the core sample is 20.3 MPa.
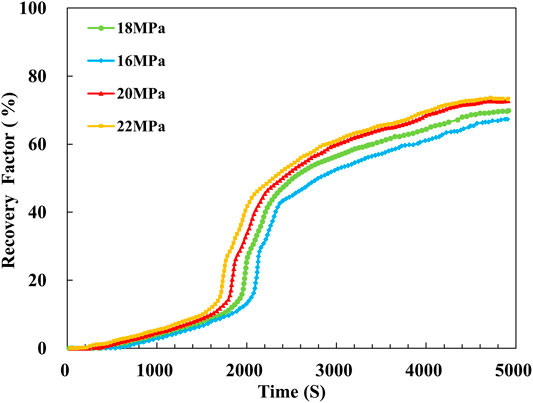
Through the CO2 flooding experiment, the diagram of time-varying corresponding recovery efficiency can be obtainedcorresponding to different displacement pressure, e.g., 16, 18, 20 and 22 MPa, as shown in Figure 8. The recovery factor increases slowly at the beginning, mainly since the swept area of CO2 during this period is relatively small and the displacement energy is insufficient. When the displacement time reaches 1000–1500 s, the recovery factor increases rapidly, and finally gradually becomes stable. As the displacement pressure increases, the ultimate recovery factor increases. The ultimate recovery factor increased significantly by 3 and 3.5%, respectively when the displacement pressure separately increases from 16 to 18 MPa and from 18 to 20 MPa. Due to the increasing of the displacement pressure, some pore-throats in the core sample can change from immiscible state to miscible state. However, when the displacement pressure increases again from 20 to 22 MPa, the difference of displacement pressure is 2 MPa, but the ultimate recovery factor only increases by 0.9% correspondingly. It further shows that when the displacement pressure reaches 20 MPa, the recovery factor increases slightly. This is mainly because most of the pore-throats in the core sample have reached the miscible state. Thus, it can be determined that the MMP of the core sample is 20 MPa, which is consistent with the calculated results of the MMP prediction model established in this paper, and also verifies the accuracy of the he MMP prediction model.
MMP Distribution of Heterogeneous Reservoir
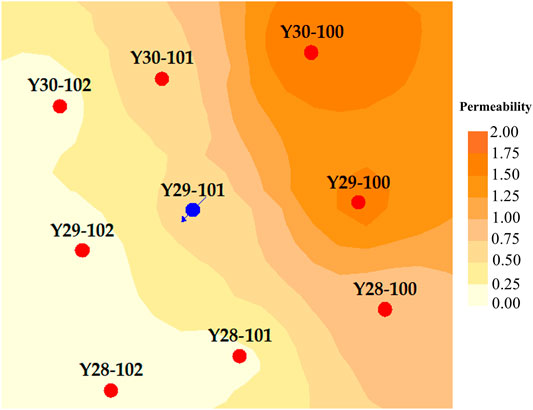
The Y29-101 well group, a typical well group in the H3 field, was selected to analyze the distribution pattern of MMP in the low permeability reservoir and the location of CO2, crude oil miscible front and non-miscible area during different production stages. The permeability in the well control area of the Y29-101 well group ranges from 0.1 to 2.2 mD with a significant permeability heterogeneity. The permeability distribution of this well group is shown in Figure 9. The physical parameters of each well in the Y29-101 well group are shown in Table 4.
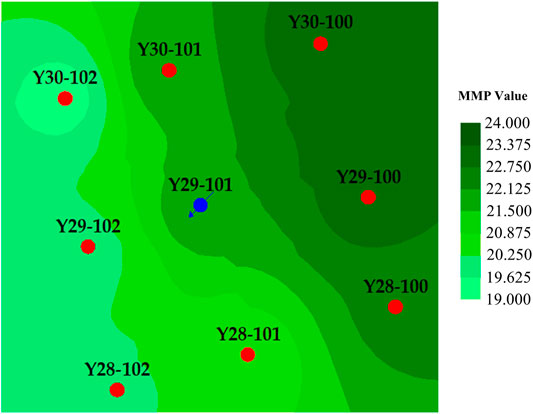
The radius of the mainstream throat in each well in the Y29-101 well group was calculated based on the permeability, and then the MMP of each well was calculated based on the MMP prediction model (see part 3.3 for more details). The MMP distribution graph is shown in Figure 10. The MMP of this well group located in the northwest area is larger the 20.5 MPa, while the MMP in the northeast area of the well group is smaller than 18.9 MPa.
However, during the actual production process, MMP can not reach 20.5 MPa, because most areas can achieve miscible state, but it will consume a lot of manpower and material resources. Similarly, the MMP of 18.3 MPa cannot be achieved because very few areas of the reservoir are miscible and most of the oil is difficult to drive. So we need to determine an intermediate value to achieve the maximum oil recovery efficiency. During the slim tube experiment, when the final recovery rate reaches 90%, the corresponging pressure is defined as the minimum miscible pressure. Similarly, it is defined that the formation pressure of more than 90% of the well control area of this well group exceed MMP is the best MMP corresponding to the whole well group, it can be found that the MMP is 19.8 MPa of Y29-101.
Miscible-Phase State Determination
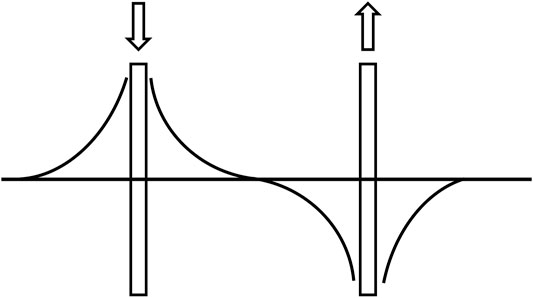
In the actual production process of the reservoir, the pressure between the injection and production wells is in the form of two pressure drop funnels, a pressure drop funnel around the injection wells with a gradually decreasing pressure centered on the injection wells, and a pressure drop funnel around the extraction wells with a gradually increasing pressure centered on the extraction wells. The shape of this pressure drop funnel is controlled by the injection rate, injection pressure, and extraction rate. The entire CO2 displacement process can be divided into two stages. At the first stage, the miscible-phase front has not yet reached the production well with the pressure drop funnel, i.e., the unstable flow stage, while at the second stage, the miscible-phase front has reached the extraction well, i.e., the stable flow stage, as shown in Figure 11. Taking well Y29-101 (injection well) and well Y29-102 (production well) as an example, the CO2 and crude oil miscible-phase state during different flow stages are determined.
Unsteady Flow Stage
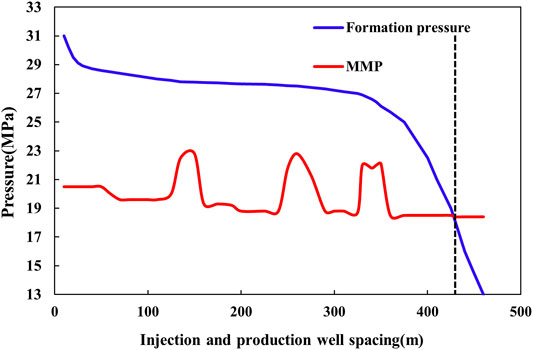
The distance between well Y29-101 and Y29-102 is 470 m. The formation pressure curve of well Y29-101 along the direction of well Y29-102 can be obtained from the field monitoring data starting from the well production. The MMP prediction model can calculate the MMP at different locations along the direction of well Y29-102. Using Y29-101 as the origin and the well distance as the x-axis, the formation pressure curve and the MMP curve are plotted in the same coordinate system, e.g., Figure 12.
As shown in Figure 12, along the direction of the injector to the producer, there is a slight pressure drop in the zone near the injection wells. The formation pressure varies steadily in most zones between the injection and production wells. There is still a significant pressure drop near the production well. Comparing the formation pressure curve with the MMP curve, the intersection point appears at the location 430 m from the injection well, indicating that the front of the miscible phase is at the position roughly 430 m from the injection well at this time, and the MMP in the area located beyond 430 m is significantly higher than the formation pressure and thus cannot reach the miscible phase.
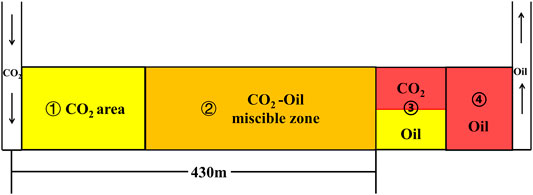
The distribution between injection and production wells at this time is shown in Figure 13. Within 430 m from the injection well, there may be a CO2-enriched zone and a miscible-phase zone. Beyond 430 m from the injection well, a immiscible-phase zone and a crude oil zone may exist. At this time, the front of the miscible is expanding, which means two parts denoated by ② and ③ are expanding, while part ④ is decreasing.
Steady Flow Stage
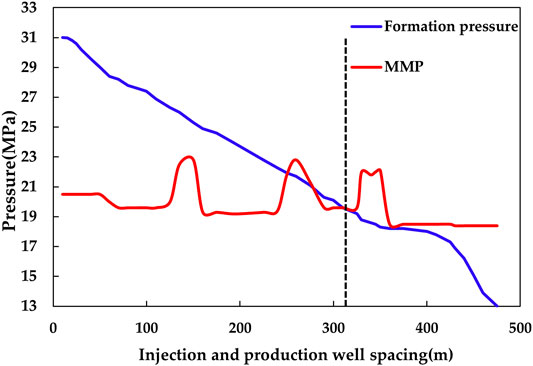
A specific moment of the stable flow stage is selected to obtain the formation pressure distribution graph, and the MMP prediction model is used to calculate the MMP distribution, as shown in Figure 14.
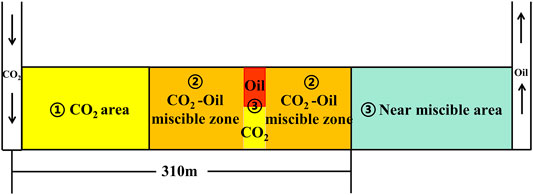
As we can see from Figure 15, the phase state during steady flow can be divided into three zones, i.e., CO2-enriched zone, CO2 and crude oil miscible-phase zone, and near-miscible-phase zone. When the front of the miscible phase is at 310 m from the injection well, most of the area in the formation becomes miscible, and the corresponding pressure is 19.6 MPa. However, when the front is between 200–300 m from the injector, the MMP curve becomes convex, and the formation pressure has not yet reached the MMP. This is mainly because that the permeability around this area is relatively larger and thus leads to a higher MMP, indicating the local immiscible phase phenomenon or the residual oil-rich zone, as shown in Figure 15. The oil recovery can be improved in actual production by adjustment of production measures and well drilling operations. As shown in Figure 14, the MMP at the front of the miscible phase is larger. The formation pressure in the area which is 310 m away from the injection well is close to the MMP so that it may reach a near-miscible phase state, but it is difficult to extend the miscible phase zone by increasing the injection pressure.
Conclusion
This study establishes a new method to determine the CO2 miscible pressure by considering microscopic pore-throat structure, which is more economical than the experimental method. This new method considers the reservoir pore-throat structure that is ignored in the conventional theoretical calculation method. It is simple, fast, and practical as well. This method provides a new technical support for the accurate calculation of MMP and determination of miscible-phase state in low-permeability reservoirs. Moreover, it can guide the oilfield to adjust the injection and production plan for further excavation of residual oil. This method can also effectively improve the CO2 utilization effect, which is of great significance to the sustainable supply of global oil resources and slow down the greenhouse effect. Four key findings can be summarized as follows:
1) The MMP prediction model based on the microscopic pore throat structure has benn established. Specifically, the P-R equation is modified by the critical parameter transformation equation of the non-wetting phase in the narrow pore throat to obtain the P-R equation of state, which is applicable to low-permeability reservoirs. Meanwhile, a multi-stage contact model is established considering the multi-stage contact process and diffusive mass transfer between CO2 and crude oil.
2) Throat radius of the core sample was obtained based on high-pressure mercury injection experiment. MMP corresponding to different throat radius can be calculated according to MMP prediction model. By analyzing distribution of MMP, the minimum miscible pressure of the core sample is determined to be 20.3 MPa. The CO2 flooding experiment shows that the final recovery factor improves as the displacement pressure increases. Nevertheless, when the displacement pressure reaches 20 MPa, the increasing rate of recovery factor decreases significantly. This is mainly because most of the pore-throats in the core sample have reached the miscible state. Thus, it can be determined that the MMP of the core sample is 20 MPa. Comparing the results of MMP prediction model with the results of CO2 flooding experiment, it can be seen that the MMP obtained by these two methods is basically consistent, which also verifies the accuracy of MMP prediction model.
3) The prediction model established in this study is applied to obtain the MMP planar distribution for H3 oilfield. The formation pressure of more than 90% of the well control area of this well group exceed MMP is the best MMP corresponding to the whole well group, the MMP is 19.8 MPa of Y29-101. Comparing the formation pressure curves between injection and production wells in different stages with the MMP curves calculated by the model, the front of miscible phase in the unstable flow stage is at 430 m from the injection well, and CO2-enriched zone, CO2-oil miscible-phase zone, local immiscible-phase zone and crude oil-enriched zone exist in the formation. In the stable flow stage, the miscible front is at 310 m from the injection well, and there are CO2-enriched zone, CO2-oil miscible-phase zone, and near-miscible-phase zone in the formation.
4) The size of the miscible zone will primarily affect the final recovery rate. During the actual CO2 displacement process, the MMP can be calculated by the MMP prediction model first, and then the propagation range of the pressure wave and the miscible-phase zone during the steady flow stage is used to determine the best displacement pressure, which should be greater than MMP. This will also obtain the best CO2 flooding efficiency, which results in achieving a better CO2 storage effect and greatly contributing to the development prospect of low carbon process for effective utilization of CO2.
Data Availability Statement
The raw data supporting the conclusions of this article will be made available by the authors, without undue reservation.
Author Contributions
L-LJ proposed the research. LT, Y-TZ, ML, and HL-W prepared figures and tables, and interpreted the structural data. L-LJ, LT, and ML developed the main ideas. HL-W and CH participated in the lab work. L-LJ, LT, ML, and J-XW contributed to writing the original manuscript. X-LC, CH, and Y-TZ contributed to revising the manuscript. All co-authors actively contributed to the manuscript with comments, ideas, and suggestions.
Funding
This work funded by the National Natural Science Foundation of China, the project called Study on the mechanism of promote CO2 dynamic miscible flooding in low permeability reservoir by ultrasonic, project No. 51974329.
Conflict of Interest
ML was employed by the Company Changqing Oilfield Company.
The remaining authors declare that the research was conducted in the absence of any commercial or financial relationships that could be construed as a potential conflict of interest.
Publisher’s Note
All claims expressed in this article are solely those of the authors and do not necessarily represent those of their affiliated organizations, or those of the publisher, the editors and the reviewers. Any product that may be evaluated in this article, orclaim that may be made by its manufacturer, is not guaranteed or endorsed by the publisher.
References
Adesina, F., Anthony, A., Churchill, A., and Olawale, D. (2010). Modeling of Wax Deposition during Oil Production Using a Two-phase Flash Calculation. Pet. Coal 52 (3).
Ahmed, T. (1997). A Generalized Methodology for Minimum Miscibility Pressure. Latin American and Caribbean Petroleum Engineering Conference: OnePetro.
Alemu, B. L., Aker, E., Soldal, M., Johnsen, Ø., and Aagaard, P. (2013). Effect of Sub-core Scale Heterogeneities on Acoustic and Electrical Properties of a Reservoir Rock: a CO2flooding experiment of Brine Saturated sandstone in a Computed Tomography Scanner. Geophys. Prospecting 61 (1), 235–250. doi:10.1111/j.1365-2478.2012.01061.x
Assareh, M. (2017). Reduction of Reservoir Fluid Equilibrium Calculation for Peng-Robinson EOS with Zero Interaction Coefficients. J. Pet. Sci. Tech. 7 (2).
Bai, M., Liu, L., Li, C., and Song, K. (2020). Relative Permeability Characteristics during Carbon Capture and Sequestration Process in Low-Permeable Reservoirs. Materials 13 (4), 990. doi:10.3390/ma13040990
Cui, G., Zhang, L., Ren, S., and Zhang, Y. (2017). Geochemical Reactions and CO_2 Storage Efficiency during CO_2 EOR Process and Subsequent Storage. J. China Univ. Pet. Edition Natrual Sci. 41 (6), 123–131.
Datta, A., and Krishnamoorti, R. (2019). Opportunities for a Low Carbon Transition-Deploying Carbon Capture, Utilization, and Storage in Northeast India. Front. Energ. Res. 7. doi:10.3389/fenrg.2019.00012
Duan, Z. H., and Sun, R. (2003). An Improved Model Calculating CO2 Solubility in Pure Water and Aqueous NaCl Solutions from 273 to 533 K and from 0 to 2000 Bar. Chem. Geology. 193 (3-4), 257–271. doi:10.1016/s0009-2541(02)00263-2
Fan, G., Zhao, Y., Zhang, X., Li, Y., and Chen, H. (2021). Research on Minimum Miscible Pressure between Crude Oil and Supercritical Carbon Dioxide System in Ultra-low Permeability Reservoir by the Long-Slim-Tube Experiment Method. Front. Earth Sci. 9. doi:10.3389/feart.2021.694729
Gao, J., Sun, Z., Liu, J., Zhao, C., Ren, D., Zhang, R., et al. (2021). Microscale Mineral and Pore Structure Characterization of the Low-Permeability Sandstone in the Ordos Basin, China. Adv. Civil Eng. 2021, 1–9. doi:10.1155/2021/6448271
Gharbi, O., Bijeljic, B., Boek, E., and Blunt, M. J. (2013). Changes in Pore Structure and Connectivity Induced by CO2 Injection in Carbonates: A Combined Pore-Scale Approach. Energ. Proced. 37, 5367–5378. doi:10.1016/j.egypro.2013.06.455
Han, J., Han, S., Sung, W., and Lee, Y. (2018). Effects of CO2 Miscible Flooding on Oil Recovery and the Alteration of Rock Properties in a Carbonate Reservoir. J. Co2 Utilization 28, 26–40. doi:10.1016/j.jcou.2018.09.006
Hassanpouryouzband, A., Joonaki, E., Edlmann, K., and Haszeldine, R. S. (2021). Correction to "Offshore Geological Storage of Hydrogen: Is This Our Best Option to Achieve Net-Zero?". ACS Energ. Lett. 6 (9), 3342. doi:10.1021/acsenergylett.1c01699
Hassanpouryouzband, A., Yang, J., Tohidi, B., Chuvilin, E., Istomin, V., Bukhanov, B., et al. (2018). CO2 Capture by Injection of Flue Gas or CO2-N2 Mixtures into Hydrate Reservoirs: Dependence of CO2 Capture Efficiency on Gas Hydrate Reservoir Conditions. Environ. Sci. Technol. 52 (7), 4324–4330. doi:10.1021/acs.est.7b05784
He, L. P., Shen, P. P., Liao, X. W., Li, F. F., Gao, Q. C., and Wang, Z. L. (2016). Potential Evaluation of CO2 EOR and Sequestration in Yanchang Oilfield. J. Energy Inst. 89 (2), 215–221. doi:10.1016/j.joei.2015.02.002
Huang, X., Ni, J., Li, X., Xue, J., Bai, M., and Zhou, T. (2020). Characteristics and Influencing Factors of CO2 Flooding in Different Microscopic Pore Structures in Tight Reservoirs. Acta Petrol. 41 (7), 853–864.
Kamari, A., Arabloo, M., Shokrollahi, A., Gharagheizi, F., and Mohammadi, A. H. (2015). Rapid Method to Estimate the Minimum Miscibility Pressure (MMP) in Live Reservoir Oil Systems during CO 2 Flooding. Fuel 153, 310–319. doi:10.1016/j.fuel.2015.02.087
Li, J., Fan, X., Wang, Y., Yu, B., Sun, S., and Sun, D. (2020). A POD-DEIM Reduced Model for Compressible Gas Reservoir Flow Based on the Peng-Robinson Equation of State. J. Nat. Gas Sci. Eng. 79, 103367. doi:10.1016/j.jngse.2020.103367
Li, Z., and Gu, Y. (2014). Soaking Effect on Miscible CO2 Flooding in a Tight sandstone Formation. Fuel 134, 659–668. doi:10.1016/j.fuel.2014.06.024
Liu, Y., and Chen, X. (2010). Miscible Conditions of CO2 Flooding Technology Used in Lowrmeability Reserviors. Pet. Explor. Dev. 37 (4), 466–470.
Liu, Y., Teng, Y., Jiang, L., Zhao, J., Zhang, Y., Wang, D., et al. (2017). Displacement Front Behavior of Near Miscible CO 2 Flooding in Decane Saturated Synthetic sandstone Cores Revealed by Magnetic Resonance Imaging. Magn. Reson. Imaging 37, 171–178. doi:10.1016/j.mri.2016.12.003
Luo, P., Luo, W., and Li, S. (2017). Effectiveness of Miscible and Immiscible Gas Flooding in Recovering Tight Oil from Bakken Reservoirs in Saskatchewan, Canada. Fuel 208, 626–636. doi:10.1016/j.fuel.2017.07.044
Meng, H., and Liu, T. (2019). Interpretation of the Rock-Electric and Seepage Characteristics Using the Pore Network Model. J. Pet. Sci. Eng. 180, 1–10. doi:10.1016/j.petrol.2019.05.005
Mohammad, R. S., Zhang, S. C., Ehsan ul, H., and AlQadasi, A. M. (2018). Investigation of Cyclic CO2 Injection Process with Nanopore Confinement and Complex Fracturing Geometry in Tight Oil Reservoirs. Arab. J. Sci. Eng. 43 (11), 6567–6577. doi:10.1007/s13369-018-3306-z
Nobakht, M., Moghadam, S., and Gu, Y. (2008). Determination of CO2 Minimum Miscibility Pressure from Measured and Predicted Equilibrium Interfacial Tensions. Ind. Eng. Chem. Res. 47 (22), 8918–8925. doi:10.1021/ie800358g
Petitfrere, M., and Nichita, D. V. (2015). Multiphase Equilibrium Calculations Using a Reduction Method. Fluid Phase Equilibria 401, 110–126. doi:10.1016/j.fluid.2015.05.006
Pi, Y., Liu, J., Liu, L., Guo, X., Li, C., and Li, Z. (2021). The Effect of Formation Water Salinity on the Minimum Miscibility Pressure of CO2-Crude Oil for Y Oilfield. Front. Earth Sci. 9. doi:10.3389/feart.2021.711695
Rezk, M. G., Foroozesh, J., Zivar, D., and Mumtaz, M. (2019). CO2 Storage Potential during CO2 Enhanced Oil Recovery in sandstone Reservoirs. J. Nat. Gas Sci. Eng. 66, 233–243. doi:10.1016/j.jngse.2019.04.002
Tapia, J. F. D., Lee, J.-Y., Ooi, R. E. H., Foo, D. C. Y., and Tan, R. R. (2018). A Review of Optimization and Decision-Making Models for the Planning ofCO2capture, Utilization and Storage (CCUS) Systems. Sustainable Prod. Consumption 13, 1–15. doi:10.1016/j.spc.2017.10.001
Wang, H., Li, G., Shen, Z., He, Z., Liu, Q., Zhu, B., et al. (2019). Expulsive Force in the Development of CO2 Sequestration: Application of SC-CO2 Jet in Oil and Gas Extraction. Front. Energ. 13 (1), 1–8. doi:10.1007/s11708-017-0458-6
Wang, H., Tian, L., Chai, X., Wang, J., and Zhang, K. (2022). Effect of Pore Structure on Recovery of CO2 Miscible Flooding Efficiency in Low Permeability Reservoirs. J. Pet. Sci. Eng. 208, 109305. doi:10.1016/j.petrol.2021.109305
Wang, H., Tian, L., Gu, D., Li, M., Chai, X., and Yang, Y. (2020a). Method for Calculating Non-darcy Flow Permeability in Tight Oil Reservoir. Transp Porous Med. 133 (3), 357–372. doi:10.1007/s11242-020-01427-8
Wang, H., Tian, L., Zhang, K., Liu, Z., Huang, C., Jiang, L., et al. (2021). How Is Ultrasonic-Assisted CO2 EOR to Unlock Oils from Unconventional Reservoirs. Sustainability 13 (18), 10010. doi:10.3390/su131810010
Wang, Q., Wang, L., Glover, P. W. J., and Lorinczi, P. (2020b). Effect of a Pore Throat Microstructure on Miscible CO2 Soaking Alternating Gas Flooding of Tight Sandstone Reservoirs. Energy Fuels 34 (8), 9450–9462. doi:10.1021/acs.energyfuels.0c01431
Wei, N., Li, X., Dahowski, R. T., Davidson, C. L., Liu, S., and Zha, Y. (2015). Economic Evaluation on CO2-EOR of Onshore Oil fields in China. Int. J. Greenhouse Gas Control. 37, 170–181. doi:10.1016/j.ijggc.2015.01.014
Wilson, G. M. (1964). Vapor-liquid Equilibrium. XI. A New Expression for the Excess Free Energy of Mixing. J. Am. Chem. Soc. 86 (2), 127–130. doi:10.1021/ja01056a002
Xu, B. (2017). CO2 Miscible Flooding in Low Permeability sandstone Reservoirs and its Influence on Crude Oil Properties. Pet. Sci. Tech. 35 (21), 2024–2029. doi:10.1080/10916466.2017.1377235
Yang, G., and Li, X. (2020). Modified Peng-Robinson Equation of State for CO2/hydrocarbon Systems within Nanopores. J. Nat. Gas Sci. Eng. 84, 103700. doi:10.1016/j.jngse.2020.103700
Yang, Y., Zhou, X.-F., Sun, L.-Y., Wang, A.-L., Wei, J.-g., Li, C.-X., et al. (2021). Immiscible CO2 Flooding Efficiency in Low-Permeability Reservoirs: An Experimental Investigation of Residual Oil Distribution. Front. Earth Sci. 9. doi:10.3389/feart.2021.693960
Yin, D., Wang, D., Zhou, Y., and Zhang, C. (2021). Pore Structure Characteristics of Ultra-low Permeability Reservoirs. Nat. Resour. Res. 30 (1), 451–462. doi:10.1007/s11053-020-09709-0
Yuan, Z., Liao, X., Zhang, K., Zhao, X., Chu, H., and Zou, J. (2020). Mathematical Characterization of Inorganic Salt Precipitation from the Reaction of CO2 with Formation Brine and its Application. Front. Energ. Res. 8. doi:10.3389/fenrg.2020.00141
Zarragoicoechea, G. J., and Kuz, V. A. (2004). Critical Shift of a Confined Fluid in a Nanopore. Fluid Ph. Equilibria 220 (1), 7–9. doi:10.1016/j.fluid.2004.02.014
Zhang, K., and Jia, N. (2019). Confined Fluid Interfacial Tension Calculations and Evaluations in Nanopores. Fuel 237, 1161–1176. doi:10.1016/j.fuel.2018.10.036
Zhang, K., Jia, N., Zeng, F., and Luo, P. (2017). A New Diminishing Interface Method for Determining the Minimum Miscibility Pressures of Light Oil-CO2 Systems in Bulk Phase and Nanopores. Energy Fuels 31 (11), 12021–12034. doi:10.1021/acs.energyfuels.7b02439
Zhong, X., Zhu, Y., Jiao, T., Qi, Z., Luo, J., Xie, Y., et al. (2021). Microscopic Pore Throat Structures and Water Flooding in Heterogeneous Low-Permeability sandstone Reservoirs: A Case Study of the Jurassic Yan'an Formation in the Huanjiang Area, Ordos Basin, Northern China. J. Asian Earth Sci. 219, 104903. doi:10.1016/j.jseaes.2021.104903
Keywords: CO2 flooding, MMP, microscopic pore-throat structure, CO2 geological storage, low-permeability reservoir
Citation: Jiang L-L, Tian L, Zhou Y-T, Li M, Huang C, Wang J-X, Wang H-L and Chai X-L (2022) Prediction of Minimum Miscibility Pressure for CO2 Flooding Based on Microscopic Pore-Throat Structure. Front. Energy Res. 10:834951. doi: 10.3389/fenrg.2022.834951
Received: 14 December 2021; Accepted: 24 January 2022;
Published: 23 February 2022.
Edited by:
Zhehui Jin, University of Alberta, CanadaReviewed by:
Aliakbar Hassanpouryouzband, University of Edinburgh, United KingdomJiaqi Wang, Harbin Engineering University, China
Copyright © 2022 Jiang, Tian, Zhou, Li, Huang, Wang, Wang and Chai. This is an open-access article distributed under the terms of the Creative Commons Attribution License (CC BY). The use, distribution or reproduction in other forums is permitted, provided the original author(s) and the copyright owner(s) are credited and that the original publication in this journal is cited, in accordance with accepted academic practice. No use, distribution or reproduction is permitted which does not comply with these terms.
*Correspondence: Leng Tian, dGlhbmxlbmcyMDA5QDEyNi5jb20=
 Li-Li Jiang
 Leng Tian
 Yu-Tao Zhou
 Mei Li
 Can Huang
 Jia-Xin Wang
 Heng-Li Wang
 Xiao-Long Chai
