- 1Biological Processing, Idaho National Laboratory, Idaho Falls, ID, United States
- 2Biomass Characterization, Idaho National Laboratory, Idaho Falls, ID, United States
- 3Operations Research and Analysis, Idaho National Laboratory, Idaho Falls, ID, United States
- 4Chemical Separations, Idaho National Laboratory, Idaho Falls, ID, United States
With the implementation of China’s Green Fence Policy and the following National Sword Policy, there is a need to divert previously accepted waste materials away from the landfill. Mixed plastic and paper wastes that are too contaminated to be economically recycled can be used for conversion into fuels and products. The effect of common contaminants present in waste streams must be determined to make municipal solid waste (MSW) a viable alternative to agricultural feedstocks for conversion. In this study, MSW was sourced from a dual stream materials recovery facility (MRF) in Emmet County, Michigan and characterized via mass balance. The most common contaminants in mixed paper and plastic were quantified and targeted for decontamination when mixed paper was explored for low temperature conversion pathways and plastics for high temperature conversion pathways. Ink, stickies, and plastic contamination were sorted out of the mixed paper stream and did not have an impact on sugar yields during enzymatic hydrolysis (EH). Although no improvement in yield was found, it was noted that copy paper within the mixed paper stream had an elevated pH and higher concentration of fermentation inhibitors, suggesting that intrinsic properties of some paper types may not be ideal for EH and fermentation conversion. Dilute alkaline pretreatment and mechanical refining of mixed paper increased the EH yield of mixed paper, suggesting this previously established process could be used as a decontamination method. “Dirt” and particulates were washed from mixed plastic using either an aqueous detergent or a non-aqueous chemical washing method. Liquid oil yields were increased during microwave assisted fast pyrolysis. All decontamination techniques met the cost target of less than $30/dry ton with plastic decontamination ranging from $18.16 to $24.81/dry ton. Because dilute alkaline pre-treatment and mechanical refining is considered part of the conversion process, the decontamination cost during feedstock preprocessing was considered $0/dry ton.
Introduction
The waste and recycling industry in the United States has drastically changed since China implemented the Green Fence and National Sword policies. Due to these policy changes, recycling programs in many areas were scaled back or completely discontinued (Beitsch, 2019). The waste materials that were previously imported into China are now accumulating at materials recovery facilities (MRFs) in the US and are often too contaminated or expensive to recycle. Because these materials represent a zero or negative value, they are eventually landfilled. The US Environmental Protection Agency (EPA) estimated that about 27 million tons of plastic and 17 million tons of paper were landfilled in the US in 2018 (EPA, 2018). These MSW fractions could potentially be diverted from the landfill and used as feedstocks for conversion into value-added fuels and products via low temperature and high temperature pathways.
Because MSW paper closely resembles lignocellulosic biomass, low temperature conversion processes can be used to screen the performance of these materials. Enzymatic hydrolysis is a low temperature conversion method traditionally used for agricultural biomass, such as corn stover, that makes their sugars available for fermentation into fuels and products. Due to the recalcitrance of many agricultural feedstock types, a pretreatment step is often needed to remove lignin and make cellulose more accessible to the enzymes used in enzymatic hydrolysis (Avila-Lara et al., 2015).
MSW paper has been found to be an economically viable feedstock for biochemical conversion (Wang et al., 2013). Previous studies have shown that blending mixed paper waste with corn stover can lower costs while maintaining sugar yield in ionic liquid pretreatment and enzymatic hydrolysis (Sun et al., 2015). However, more recent studies have shown that MSW paper had lower enzymatic hydrolysis yields compared to corn stover and corn stover/paper blends (Li et al., 2017; Thompson et al., 2019). This could be indicative of some type of inhibition, likely due to the presence of contaminants.
Alternately, MSW plastics are polymers of chemical building blocks such as ethylene and propylene and are rich in carbon-to-carbon bonds. These bonds are difficult to break biologically, and the monomer units are not suitable for fermentation. Pyrolysis is a high temperature process for converting biomass to fuels and would be more suitable for plastics. Fast pyrolysis is a high temperature degradation process that occurs between 450–700°C in the absence of oxygen. During this process, biomass is converted to liquid bio-oil, solid char, and gas. Bio-oil produced from this process can be further refined into fuels or chemicals (Zhang et al., 2019). The chemical composition of the bio-oil varies widely depending on reaction conditions and feedstock type. In addition, gaseous products rich in hydrocarbons can be used for energy recovery (Sipra et al., 2018).
There are many factors that can render MSW plastic unsuitable for traditional mechanical recycling. MSW plastic is a heterogenous mixture of resin types that are often contaminated with exogenous materials such as food residue, chemicals, metal, and glass (Qureshi et al., 2020). Heavily contaminated plastic waste cannot be recycled and is usually landfilled or incinerated. Degradation caused by factors like UV radiation and temperature conditions can also make plastic unsuitable for recycling (Shah et al., 2008). Pyrolysis can tolerate high levels of contamination and can convert degraded plastic products to fuels and chemicals. Although pyrolysis can tolerate a wider array of feedstock types and contaminants, it is possible that these contaminants can negatively affect conversion yields. For example, MSW may contain large amounts of alkali metals, which can cause cracking reactions that result in a higher yield of gaseous products and a lower yield of liquid oil products (Wang et al., 2015; Alcazar-Ruiz et al., 2021).
This is the first study to investigate the effect of decontamination methods to increase conversion yields of MSW. Low and high temperature conversion methods were used to assess the impact of common contaminants on the conversion of mixed MSW paper and plastic, respectively. Decontamination strategies for the paper and plastic streams were developed and analyzed using enzymatic hydrolysis and microwave assisted fast pyrolysis. The added cost of decontamination to preprocessing of MSW is analyzed and compared to corn stover.
Materials and Methods
Sampling and Characterization
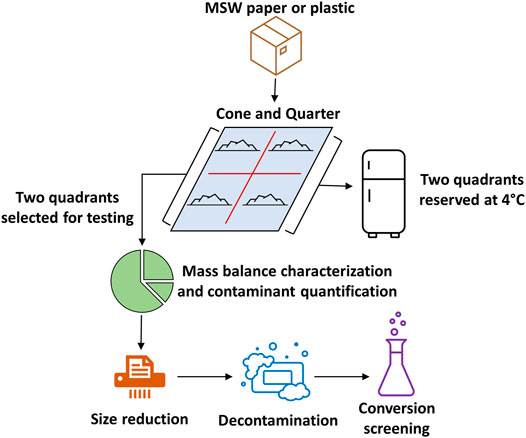
Municipal solid waste (MSW) samples were sourced from a materials recovery facility (MRF) in Emmet County, Michigan through Resource Recycling Systems (RRS). The samples were non-recyclable residuals that were sorted from dual stream recycling collection. Mixed paper and mixed plastic waste streams were received at Idaho National Laboratory in Idaho Falls, Idaho and refrigerated at 4°C for future experimentation. Approximately 21.7 kg of mixed paper and 23.5 kg of mixed plastic was received. The paper and plastic MSW streams were mixed, coned, and quartered separately on a large plastic tarp. Two quadrants were sampled for characterization and experimentation (8.5 kg mixed paper and 12.2 kg mixed plastic). The remaining two quadrants were reserved for future experimental needs (Figure 1). The samples were air dried at room temperature for 24 h in a fume hood prior to sorting. Mass balance characterization of the samples was performed by first sorting into distinct product types (Figure 2). Paper samples were sorted into one of six categories: newspaper/office paper, food containers, cardboard, glossy/coated, other paper, and non-paper contaminants (e.g., glass, textiles, aluminum cans). Plastic samples were also sorted into one of six categories: food containers, bottles, durable goods, films, other plastic, and non-plastic contaminants (e.g., glass, aluminum cans, paper products). Plastic waste was further sorted by plastic type using the plastic identification number printed on the product. If no plastic identification number was visible or available, the plastic was sorted into a category based on similar product types. The mass of each plastic type was measured on a standard laboratory balance and used to calculate the mass balance.
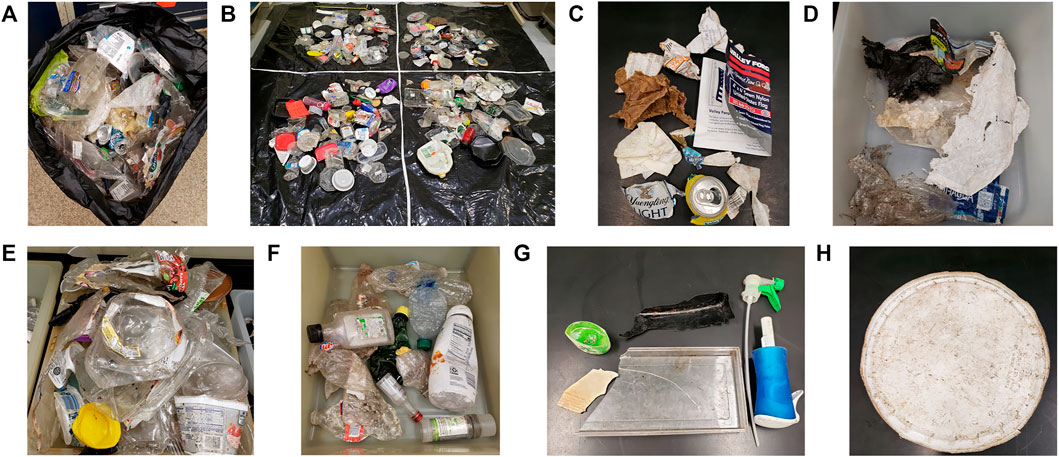
FIGURE 2. Representative images of MSW during sampling and sorting. Plastic as received (A) and coned and quartered (B). Plastic was sorted into non-plastic contaminants (C), films and baggies (D), food containers (E), bottles (F), other (G), and durable goods (H).
During sorting, common contaminants were visually identified in each waste stream for further quantification. Common contaminants in paper and plastic waste fractions were quantified by counting the pieces of waste that contained contamination. Paper contaminants were sorted into the following categories: glossy coatings, food residue, ink, stickies (adhesives or glues), and staples. Plastic contaminants were sorted into the following categories: food residue, “dirt” and labels/thin films. “Dirt” contamination was defined as a coating of particulate that is likely a complex mix of residual container contents (e.g., food, liquids, chemicals) that leaked and had contact transfer from more heavily contaminated materials. Pieces of waste that contained multiple contaminants simultaneously were quantified separately from waste that contained only a single contamination type.
Size Reduction
Mixed paper and plastic samples were initially shredded to 0.25 inches using a TaskMaster TM8500 industrial shredder (Franklin-Miller, Livingston, NJ, United States). Shredded paper samples were split using a custom rotary splitter and size reduced using a Model 4 Wiley knife mill (Thomas Scientific, Swedesboro, NJ, United States) to pass through a 6 mm screen. The 6 mm paper samples were used for dilute alkaline pretreatment and mechanical refining followed by enzymatic hydrolysis. A portion of the 6 mm samples were re-fed through the Wiley mill to pass through a 2 mm screen. The 2 mm paper samples were fed directly to enzymatic hydrolysis without further pretreatment. The shredded plastic samples were size reduced to pass through a 2 mm screen using an M24M-30e industrial crumbler rotary shear (Forest Concepts, Auburn, WA, United States). Oversized particles were collected and continuously re-fed through the crumbler until they were able to pass through a 2 mm screen.
Plastic, Ink, and Stickies Decontamination
The impact of plastic contamination within the mixed paper stream was investigated by sorting. All non-paper materials were removed from the mixed paper waste prior to size reduction. Plastic contaminants were size reduced separately from paper samples. Based on the mass balance characterization results (Section 3.1), 1.42 wt% plastic contaminants were added back to a portion of the size reduced paper.
The impact of ink contamination was investigated using two common paper types found within the mixed paper samples: newspaper and copy paper. Samples without ink contamination were produced by manually cutting out un-printed regions of MSW copy paper and newspaper. Samples with ink were produced using the same paper sources that were visibly contaminated with ink. As a control, pristine paper samples were produced from brand new copy paper and newspaper that had never been printed on.
The impact of stickies contamination was investigated with cardboard food containers and packaging materials (cereal boxes, six-pack carriers, etc.). Samples with stickies were created by manually cutting out portions of cardboard packaging that contained visible adhesives or glue. Samples without stickies were produced using the same cardboard that did not have visible adhesives or glue. Pristine cardboard samples were produced using brand new cardboard boxes that did not contain visible stickies contamination.
Dilute Alkaline Pre-treatment
30 g of MSW paper samples were dilute alkaline pre-treated in triplicate with 7% (w/w) NaOH at 8% solids loading. The NaOH was diluted with water in a 1-L polypropylene (PP) flask before being inoculated with paper samples. The flasks were incubated at 85°C in a shaking water bath rotating at 100 rpm for 2 h and were manually mixed every 15 min. The flasks were removed from the water bath and allowed to cool at room temperature for 1 h. After cooling, the samples were filtered through a PP fabric filter to remove particles down to 100 microns (McMaster-Carr, Elmhurst, IL, United States) with 4-L vacuum flasks. The paper samples were removed from the PP filter and rinsed twice with 1 L of water for 15 min. The rinsed paper was filtered a second time using the same procedure mentioned above. The pre-treated paper was recovered, and the pH of the material was estimated using pH strips. Replicates were combined into a single composite sample for subsequent analysis. The pre-treated material was dried at 40°C overnight to determine the moisture content. The dilute alkaline pre-treatment liquor was reserved, and sugar concentrations removed during pre-treatment were determined with ion chromatography (IC). Sugars lost during pre-treatment were below the IC limit of detection and were therefore not accounted for in yield calculations. Dilute alkaline pre-treated paper samples were mechanically refined using a Laboratory Beater PFI Mill (Techlab Systems, Itasca, IL, United States) at 4,000 revolutions prior to enzyme hydrolysis.
Low Temperature Conversion
The chemical composition of untreated MSW was measured according to National Renewable Energy Laboratory’s (NREL) Laboratory Analytical Procedure for standard biomass analysis (Sluiter et al., 2012). The conversion performance of mixed paper samples was screened using the measurement of sugar yield in enzymatic hydrolysis either with or without dilute alkaline pre-treatment and PFI milling. The percent solids loading of each reaction was decreased to 6% to enable thorough mixing and equal distribution of sodium azide. Enzymatic hydrolysis was performed in triplicate according to the NREL procedure (Selig et al., 2008) using Cellic CTec2 (Novozymes, Franklinton, NC, United States) loaded at 40 mg/g dry weight of biomass and Cellic HTec2 (Novozymes, Franklinton, NC, United States) loaded at 4 mg/g dry weight of biomass. The reactions were incubated at 50°C for 5 days. The hydrolysates were filtered through a 0.22 µm filter plate (MilliporeSigma, Burlington, MA, United States) and sugar concentrations were measured via high pressure liquid chromatography (HPLC). Percent yield achieved during enzymatic hydrolysis was calculated with the following equation:
The presence of fermentation inhibitors was investigated with newspaper, copy paper, and cardboard hydrolysates. HPLC was performed to determine the concentration of acetic acid, levulinic acid, furfural, and 5-hydroxymethylfurfural (HMF).
Detergent and Chemical Washing
10 g of size reduced plastic particles (2 mm) were loaded into a 250 ml Erlenmeyer flask containing 100 ml water. A few drops of dawn dish soap were added, and the flask was placed into a 40°C shaking incubator rotating at 150 rpm for 1 h. The liquid was removed by gravity filtration through filter paper (Whatman, Florham Park, NJ, United States). The washed plastic was rinsed twice by submerging the particles in fresh water and incubating in a 40°C shaking incubator for 1 h. The liquid again was removed by gravity filtration through filter paper. Rinsed plastic was dried overnight in a 40°C oven.
A laboratory-scale condensable solvent system has been developed based on a MiniMeP hydrocarbon extraction platform (ExtractionTek Solutions, Wheat Ridge, CO, United States) for use with dimethyl ether (DME) as the working solvent. To prevent seal and gasket failures, the system was modified in accordance with ASTM specification D7901. The DME within this system operates in a closed loop, with liquified DME solvent returned to the operating tank after extraction and decontamination. The solvent transfers through the chilled injection coil to the extraction vessel, where the solvent diffuses into the MSW material. Liquified DME, water, and extracted contaminants is then transferred to the collection vessel and expansion vessel, where heat is supplied to drive the vaporization of solvent, permitting separation and recovery of DME from contaminants. Vaporized solvent is returned to the solvent tank through a recovery pump and discharge coil. This decontamination process operates under 85 psi, and temperature range between min. −4°C (at injection coil) and max. 35°C (at expansion vessel). Approximately 70 g of mixed plastic was washed with DME inside a nylon bag by recirculation for 2 h.
High Temperature Conversion
The conversion performance of mixed plastic samples was screened using microwave assisted fast pyrolysis. One-gram pellets of washed and unwashed plastic were made using a benchtop manual hydraulic press (Carver, Wabash, IN, United States). The plastic was weighed using a laboratory scale and loaded into a pellet die (approximately 16 mm square with 4 mm rounded corners). The die and plastic samples were heated together in an oven at 150°C for 15 min and compressed at 4,000 psi (20,000 lb-f). Two pellets (∼2 g) were loaded into a pre-weighed quartz tube (26 mm diameter, 1 m length) assembly and loaded into a microwave assisted pyrolysis instrument that was previously described (Klinger et al., 2015; Klinger et al., 2018). The oxygen was purged from the quartz tube using nitrogen gas. A portion of the quartz tube was packed with dry ice snow to condense vapor to liquid oil. The samples were heated to approximately 500°C and allowed to devolatilize completely. The pyrolysis gas yield was measured by a digital gas flow meter (Omega Engineering, Norwalk, CT, United States) and gas analyzer (Nova Analytical Systems, Hamilton, ON, Canada) equipped with sensors to detect O2, CO, CO2, CH4, and total hydrocarbons. The tube assembly was removed from the instrument, allowed to cool, and weighed. The remaining char present in the quartz tube was removed and weighed using a laboratory balance. The percent yield of gas, char, and liquid oil were calculated gravimetrically.
Unwashed, detergent washed, and DME washed samples were milled using a Retsch ZM200 (Haan, Germany) to pass a 0.2 mm screen and then sent to Huffman Hazen Laboratories (Golden, CO, United States) for analysis. Samples were dried at 60°C in a forced air oven overnight. Total ash was determined by holding the sample at 750°C in air for 8 h. Inorganic element analysis was completed following ASTMs D3682 and D6349.
Techno-Economic Assessment
Because corn stover can potentially be available at a feedstock cost as low as $30/ton, we targeted this price as an acceptable cost for decontamination to make the material cost competitive with corn stover (Langholtz et al., 2016). A techno-economic assessment (TEA) was conducted to determine the costs of decontamination methods. The TEA examined the complete pre-processing for size reduction and decontamination of non-recyclable plastic and paper residuals from an MRF. A total of four scenarios were evaluated, including: 1) size reduction of paper without old corrugated cardboard (OCC); 2) size reduction of paper including OCC; 3) decontamination of plastic using detergent washing and drying; and 4) decontamination of plastic using the DME process. For each scenario, the total estimated cost included both fixed and operational costs. Fixed costs, that include capital recovery, insurance, and taxes, were estimated following the guidelines published in Turhollow et al. (2009). Operational estimated costs include energy and labor costs to operate equipment.
Figure 3A presents the process flow designed for the size reduction process to reduce particle size of recycled paper to 6 mm. RRS provided the mixed paper tonnage for an appropriately sized MRF (34,125 dry tons/year). It was assumed that processed materials would only include mixed paper recovered from an MRF and would be size reduced and decontaminated on-site prior to shipping to a conversion facility. For both the shredding and knife milling process, it was assumed that there was a dry matter loss of 1%. For scenario four, the process flow and assumptions are identical to scenario three. However, in this scenario the OCC fraction was included in the infeed.

FIGURE 3. Process flows for feedstock pre-processing unit operations. Paper size reduction (A), plastic size reduction and detergent washing-drying (B), and plastic DME-based washing (C).
The design of the system for plastic size reduction and decontamination is presented in Figure 3B. This system was designed to process about 3,500 dry tons of plastic annually, assuming 200 operation days a year and 10 h operating time per day. The project collaborators from RRS provided tonnage of plastics produced by a typical MRF that operates with good economics of scale and it was assumed that each MRF would pre-process and decontaminate its own materials prior to sending them to a conversion facility. It was assumed that plastic will be ground by a M24M-30e industrial crumbler rotary shear (Forest Concepts, Auburn, WA, United States) to 2 mm before going to the decontamination step.
Figure 3C presents the design for a pre-processing system that includes DME-based plastic decontamination with 3,500 dry tons annual capacity. It was assumed that plastic will be ground by a M24M-30e industrial crumbler rotary shear (Forest Concepts, Auburn, WA, United States) to 2 mm before sending to the DME decontamination tank. It also was assumed that about 10% of the DME solution will be used to remove the contaminants and water from the recycled plastic.
Results and Discussion
Mass Balance Characterization
The obtained sample of mixed paper MSW was sorted into product types to characterize mass balance (Figure 4A). Office paper and newspaper make up most of the paper fraction (46.5%), followed by cardboard (19.5%), glossy coated (16.7%), food containers (10.4%), and other paper (5.01%).
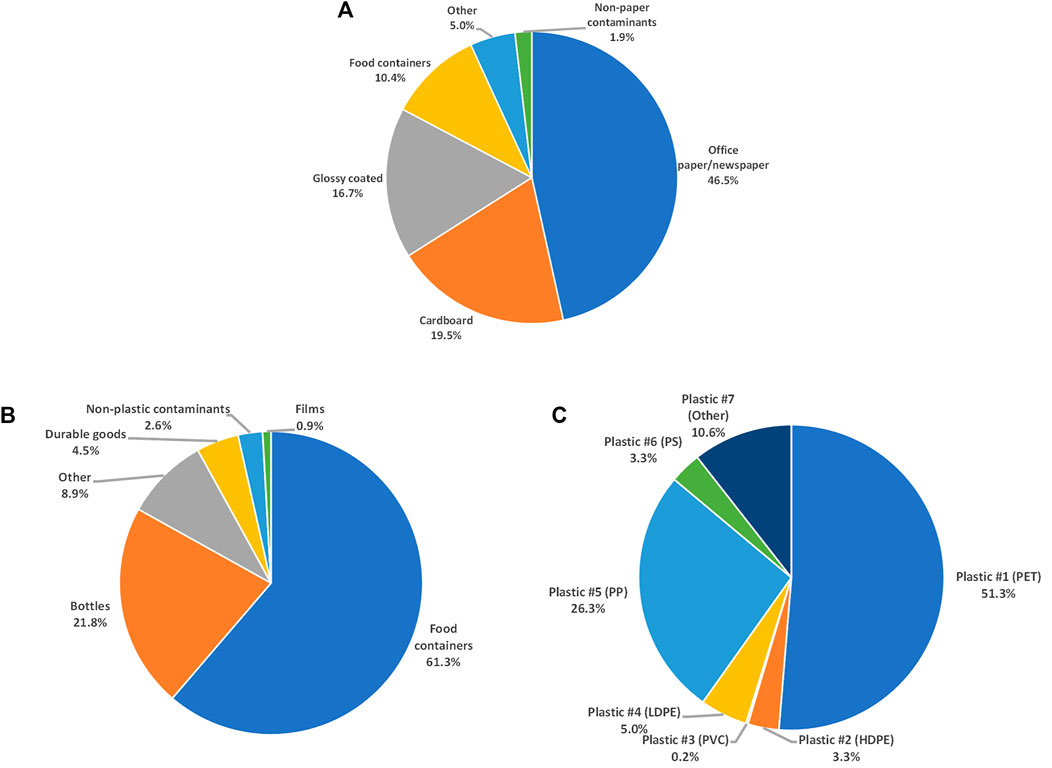
FIGURE 4. Mass balance of mixed paper product type (A), mixed plastic product type (B), and plastic type (C).
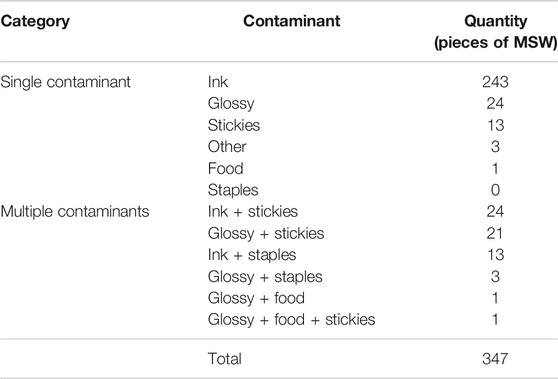
Non-paper contaminants (plastic, metal, glass, and other) make up 1.9% of the total mass balance of mixed paper MSW. Plastic makes up most (76.4%) of these non-paper contaminants, followed by metal (9.6%), glass (8.9%), and other (5.1%). The presence of glass and metal could be a potential cause of premature wear in process equipment or even damage equipment causing shutdowns for repairs, so they must be removed. The most common intrinsic contaminant present in paper was ink (68.1%), followed by stickies (14.4%), glossy coatings (12.2%), staples (3.9%), and food (0.7%). Mixed paper contaminant data is summarized in Table 1.
The mixed plastic MSW sample was sorted into product types to characterize the composition (Figure 4B). Food containers made up most of the plastic fraction (61.3%), followed by bottles (21.8%), other plastic (8.9%), durable goods (4.5%), and films (0.9%). Plastic MSW was further sorted into plastic type using the identification number printed on the product (Figure 4C). The most common plastic types identified were polyethylene terephthalate (PET, 51.3%), followed by polypropylene (PP, 26.3%), other (10.6%), low-density polyethylene (LDPE, 5.0%), polystyrene (PS, 3.3%), high-density polyethylene (HDPE, 3.3%), and polyvinyl chloride (PVC, 0.2%).
Non plastic contaminants (paper, metal, glass, and other) made up 2.6% of the total mass balance of mixed plastic MSW. Paper makes up most (51.5%) of these non-plastic contaminants, followed by metal (29.3%), glass (16.1%), and other (3.1%). As described above, glass and metal could have downstream impacts such as equipment wear and trace amounts of metal catalyzing undesirable reactions during pyrolysis.
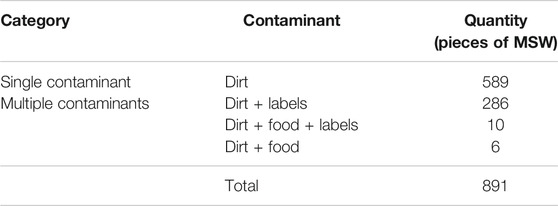
A contaminant coating labelled as “dirt” was present on 100% of the plastic received. The next most common contaminant was thin film labels, which were present on 33.2% of the plastic products. The least common contaminant was food residue, which was present on only 1.8% of the plastic products. Mixed plastic contaminant data is summarized in Table 2.
Low Temperature Conversion
The glucan, xylan, minor sugars (arabinan, mannan, and galactan), and ash contents of MSW paper are shown in Figure 5. Enzymatic hydrolysis was carried out to determine the impact of plastic contamination on sugar yields in untreated and dilute alkaline pre-treated mixed paper samples. It was notable that sugar yields for untreated paper were low, which could be indicative of hornification or surface treatments of the paper materials (Fernandes Diniz et al., 2004). Glucose and xylose yields from EH were not increased when plastic contaminants were removed from mixed paper samples, but yields were increased when samples were dilute alkaline pre-treated and PFI milled.
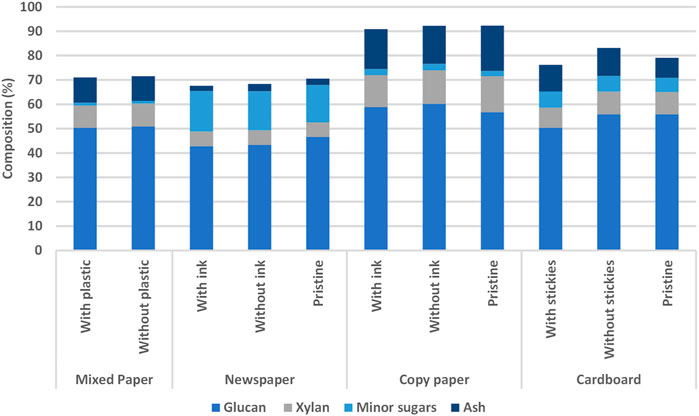
FIGURE 5. Compositional analysis of MSW paper types. The balance of composition (not shown) consists of glucan, xylan, lignin, extractives, and minor sugars (arabinan, mannan, and galactan).
Dilute alkaline pre-treatment is performed at a relatively low temperature and plastics could be problematic if higher temperatures pre-treatments were used. MSW paper without plastic contamination showed a 31% glucose yield and a 58% xylose yield. When that sample was dilute alkaline pre-treated and PFI milled, the glucose and xylose yields increased to 78% and 90%, respectively. Similarly, MSW paper with plastic contamination showed a 26% glucose yield and a 53% xylose yield. When that sample was dilute alkaline pre-treated and PFI milled, the glucose yield increased to 73% and the xylose yield increased to 86% (Figure 6). During the dilute alkaline pre-treatment process, it was noted that ink seemed to be present in the pre-treatment liquor and stickies coated the bottom of the reaction flask, suggesting that the pre-treatment process could remove these contaminants present in paper.
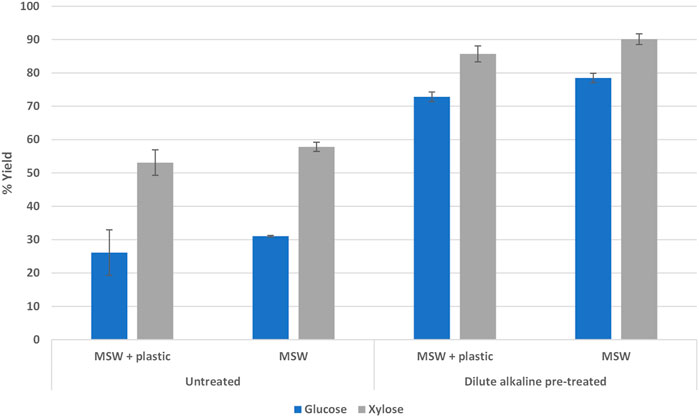
FIGURE 6. Dilute alkaline pre-treatment and PFI milling increased sugar yields in enzymatic hydrolysis.
Enzymatic hydrolysis was used to investigate the effect of ink contamination in newspaper and copy paper. The effect of stickies contamination was investigated with cardboard. Glucose and xylose yield during EH was not increased when ink contaminated paper was removed from the newspaper and copy paper fractions, nor when stickies contamination was removed from the cardboard fractions. The sugar yields of MSW newspaper, copy paper, and cardboard fractions were compared to brand new, pristine samples that did not contain ink and stickies. The results showed that the yield of pristine samples was not different than paper fractions found in MSW. Although no increase in yield was seen when ink or stickies were removed the MSW paper, the sugar yields were increased across all paper fractions when they were dilute alkaline pre-treated and PFI milled (Figure 7). Interestingly, higher yields were observed in pre-treated and PFI milled copy paper and cardboard samples that were contaminated with ink and stickies, respectively. Alkaline de-inking causes swelling and peeling of cellulose fibers (Pala et al., 2004). We hypothesize that the removal of ink and stickies observed during dilute alkaline pre-treatment resulted in more extensive fiber damage, resulting in an increased surface area that is vulnerable to enzyme attack. Future research will explore this phenomenon.
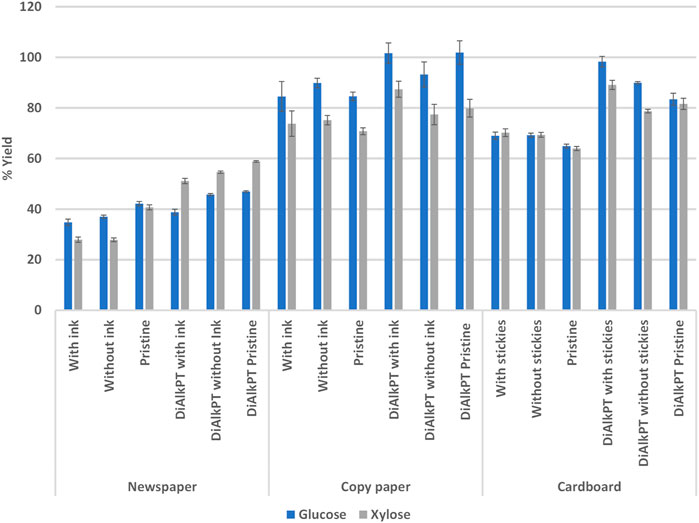
FIGURE 7. Enzymatic hydrolysis yields were not impacted by the presence of ink and stickies. DiAlkPT, dilute alkaline pre-treated.
It was observed that dilute alkaline pre-treated and mechanically refined newspaper samples had a higher yield of xylose compared to glucose, while the opposite was true for copy paper and cardboard. Production processes used for different paper types result in differing composition and cellulose crystallinity. For example, copy paper has a high cellulose content and low hemicellulose content, while newspaper has a higher hemicellulose content and lower cellulose content (Guerfali et al., 2015). The ratio of newspaper or copy paper within a waste paper stream will impact the corresponding yield of glucose and xylose during EH.
During initial enzymatic hydrolysis experiments with pristine and MSW copy paper fractions, it was noted that very low sugar yields were achieved. Further investigation revealed that these enzymatic hydrolysis reactions had an elevated pH that was outside the working range of the CTec2 and HTec2 enzymes (pH 5–5.55). Untreated copy paper samples had an average pH of 8.03 and dilute alkaline pre-treated copy paper had an average pH of 7.87. The concentration of citrate buffer was increased from 0.05 to 0.25 M to account for the elevated pH in subsequent EH experiments using copy paper. All newspaper and cardboard samples fell within the working pH range of the enzymes. The variation in these streams and the need to optimize reaction conditions has potential processing implications.
The presence of fermentation inhibitors in newspaper, copy paper, and cardboard hydrolysate samples was used to determine the potential impacts on downstream fermentation. HMF and furfural concentrations were undetectable in all paper fractions. The concentration of acetic acid was notably higher in copy paper samples compared to newspaper and cardboard, while levulinic acid was present in a very low concentration across all samples (Figure 8).
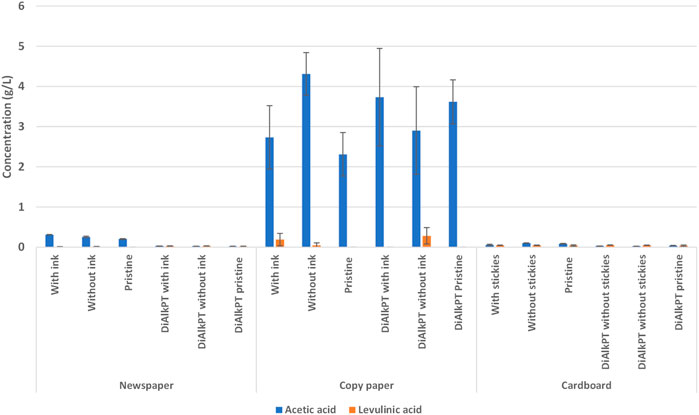
FIGURE 8. Copy paper had an elevated concentration of the fermentation inhibitor acetic acid during enzymatic hydrolysis. DiAlkPT, dilute alkaline pre-treated.
The combined pH and fermentation inhibitor data suggests that copy paper has intrinsic qualities that are not ideal for enzymatic hydrolysis and downstream fermentation. A variety of additives and chemicals are used in paper making to increase the brightness and whiteness of copy paper, as well as improving the mechanical and physical properties of the paper. We hypothesize that fillers, bleaching agents, and/or chemical pulping agents present in the copy paper are elevating the pH and concentration of fermentation inhibitors in these samples despite the presence of a 50 mM citrate buffer and 40 mM acetate (Figure 8) for buffering. For the copy paper EH, it was necessary to increase the citrate buffer concentration to 250 mM to eliminate the pH shift. Further investigation is needed to determine the potential sources of this phenomenon and to test the impacts of these inhibitor concentrations on fermentation efficiency.
High Temperature Conversion
Liquid oil products obtained from pyrolysis can be upgraded and used as a substitute for conventional fossil fuels (Zaman et al., 2017). Untreated mixed plastic waste produced about 5% char, 42% liquid oil, and 53% gas in microwave fast pyrolysis experiments while mixed plastic washed with detergent reduced char yields to 2%, increased liquid oil yields to 69%, and reduced gas yields to 29%. Mixed plastic washed with DME produced about 7% char, 61% oil, and 32% gas (Figure 9). These experiments were intended to quickly screen conversion performance of decontaminated materials. Therefore, the composition of the bio-oil was not determined. In the future, we hope to complete an in-depth investigation of the bio-oil and determine the mechanisms involved in increased oil production. A component of the “dirt” coating in unwashed plastic may have catalyzed cracking reactions that decreased liquid yields. During pyrolysis, it was noted that some types of plastic melted in the transfer tube prior to entry into the pyrolysis chamber and caused feeding problems in the system. Our DME decontamination approach is an effective, novel, and economically feasible method that does not create a wastewater stream.
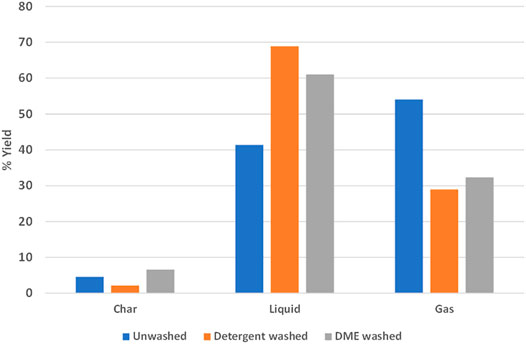
FIGURE 9. Detergent and DME washed plastic produced an increased yield of liquid oil during pyrolysis.
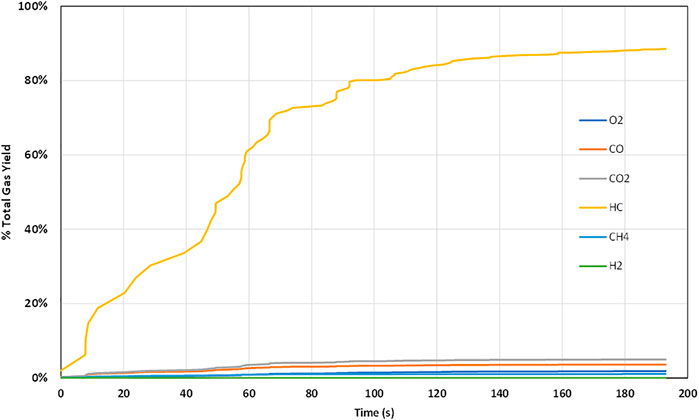
The composition of gaseous products from pyrolysis of unwashed mixed plastic primarily contained hydrocarbons (Figure 10). This suggests that the “dirt” in unwashed plastic is catalyzing cracking reactions that break plastic into lighter hydrocarbons that decrease the liquid oil yields.
Alkali and alkaline earth metals (K, Na, Mg and Ca) are known to catalyze cracking reactions during pyrolysis (Wang et al., 2015). Initial ash analysis indicates that potassium or sodium may be the culprits although further testing is needed to verify this (Table 3).
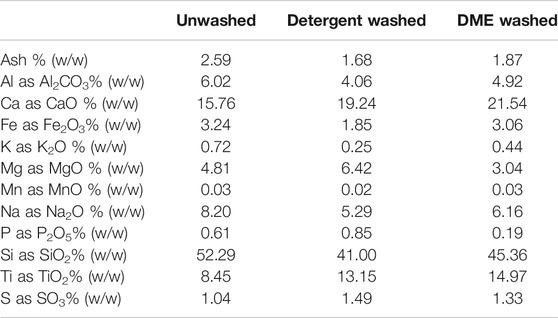
TABLE 3. Ash analysis of unwashed, detergent washed, and DME washed MSW plastic. Ash components are % of total ash content.
Techno-Economic Assessment
The mixed paper materials that were tested benefitted from a dilute alkaline pre-treatment; however, since this TEA focused on the steps prior to low temperature pre-treatment process, it was not necessary to further decontaminate these materials. The primary contributors to pre-processing costs in paper size reduction without OCC (scenario one) were the knife mill and shredding operations. The overall cost of this pre-processing system (Table 4) is estimated at $5.25/dry ton. The inclusion of the OCC fraction (scenario two) into the system increases the annual infeed by 10%. Higher throughput translates in greater economies of scale to reduce the pre-processing costs (Table 4) by $0.84/dry ton. The mixed paper materials that were tested benefitted from a dilute alkaline pre-treatment; however, since this is part of the NREL low temperature pre-treatment process, it was not necessary to further decontaminate these materials. Therefore, the decontamination cost was $0/dry ton.
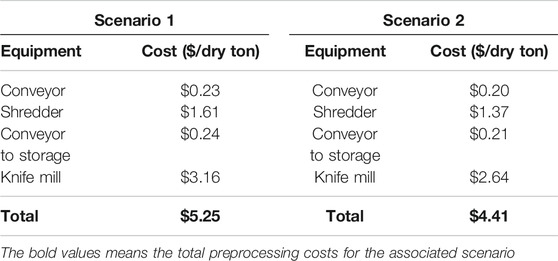
TABLE 4. Breakdown of costs for size reduction without OCC (scenario 1) and with OCC (scenario 2) pre-processing unit operations.
The total cost for the detergent washing system (scenario one) was about $50.01/dry ton (2021$), assuming 1% of dry matter loss in the size reduction step. The washing line combined the washing and drying stages of the pre-processing operation. This unit operation contributed about $24.81/dry ton, nearly 50% of the overall costs (Table 5). The crumbler accounted for $21.00/dry ton while the conveyors accounted for $2.09/dry ton. The costs for the system were also influenced by low material throughput of approximately 1.75 tons per hour. The total cost for the DME-based washing system (scenario two) was about $43.36/dry ton, assuming 1% of dry matter loss in the size reduction step (Table 5). Compared to the detergent washing-drying process, the DME-based pre-processing costs $6.65 less, mainly due to the lower energy cost in the DME tank as compared to the washing line used in the conventional system. In this system, the crumbler accounts for $21.00/dry ton while the DME system contributes $18.16/dry ton to overall pre-processing costs.
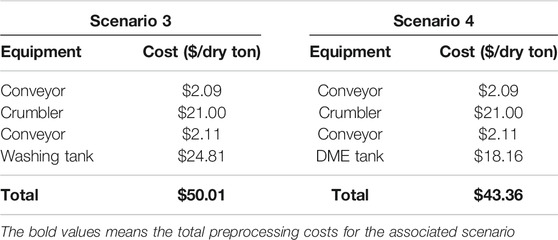
TABLE 5. Breakdown of costs for detergent washing (scenario 3) and DME-based (scenario 4) pre-processing unit operations.
Conclusion
In the United States, MSW that is too contaminated or expensive to recycle was exported to China prior to the Green Fence and National Sword policies. The United States lost a destination for much of its contaminated wastes due to these policies. Many cities were forced to discontinue or scale back their recycling programs, resulting in many waste materials being landfilled. Paper and plastic fractions of MSW could potentially be diverted from the landfill and used as feedstocks for conversion to fuels and chemicals. MSW could represent a viable alternative to agricultural residues for biofuel production if low-cost methods for decontamination can be developed.
Although plastic, ink, and stickies contamination within the mixed paper stream did not have a negative impact on enzymatic hydrolysis yield, dilute alkaline pre-treatment and mechanical refining was able to increase yields. When certain paper types within the mixed paper samples were tested, it was observed that copy paper had an elevated pH and increased concentration of fermentation inhibitors. The increased pH had an adverse impact on enzymatic hydrolysis, but it could be compensated for by increasing the reaction buffer concentration. The effect of elevated concentration of fermentation inhibitors was not observed in our experiments but is hypothesized to have an impact in downstream fermentation processes. We hypothesize that additives such as fillers, bleaching agents, and/or pulping agents are causing this phenomenon.
Removal of “dirt” and particulate contamination in mixed plastic MSW with detergent and chemical washing resulted in an increase in liquid oil products during pyrolysis. This is the first study to employ an affordable, non-aqueous decontamination system for MSW that does not create a wastewater problem. DME washing is a promising decontamination technique that can be used for a wide range of waste materials. Further research is needed to determine the impacts of DME decontamination on the conversion of other waste streams (e.g., paper, yard waste).
The major gaseous products produced during pyrolysis were light hydrocarbons, suggesting that “dirt” in unwashed MSW is catalyzing cracking reactions and resulting in lower liquid yields. Initial ash analysis studies suggest that potassium is catalyzing cracking reactions during pyrolysis and decreasing oil yield. The impacts of potassium on pyrolysis are well-known. Future experimentation should focus on determining the composition of bio-oil from washed waste and investigating the mechanism behind increased oil yield.
The washing techniques developed for plastic decontamination ranged from $18.16 to $24.81/dry ton. This fell below the cost target of $30/dry ton, making the material cost competitive with corn stover. Dilute alkaline pre-treated paper did not require further decontamination processes, making the cost $0/dry ton for any decontamination prior to pretreatment. The cost of paper preprocessing ranged from $4.41 to $5.25/dry ton.
Further study is required to determine the culprit behind elevated pH and fermentation inhibitor concentration in copy paper, as well as decreased oil yield in unwashed plastic. In summary, dilute alkaline pre-treatment and washing methods have been shown to be effective decontamination strategies to increase conversion yields of mixed paper and plastic MSW, respectively.
Data Availability Statement
The raw data supporting the conclusion of this article will be made available by the authors, without undue reservation.
Author Contributions
RB performed experiments and drafted manuscript. AH, JK, and BW provided experimental guidance and helped edit manuscript drafts. DH performed the TEA and provided the data for manuscript preparation. HL performed DME washing of mixed plastic samples and provided text for the manuscript. VT is the principal investigator and provided experimental guidance, manuscript edits, and managed the team.
Funding
The research was supported by the US Department of Energy (DOE), Office of Energy Efficiency and Renewable Energy (EERE), Bioenergy Technologies Office (BETO), under Award No. DE-AC07-05ID14517. The views expressed in the article do not necessarily represent the views of the US Department of Energy or the US government.
Conflict of Interest
The authors declare that the research was conducted in the absence of any commercial or financial relationships that could be construed as a potential conflict of interest.
Publisher’s Note
All claims expressed in this article are solely those of the authors and do not necessarily represent those of their affiliated organizations, or those of the publisher, the editors and the reviewers. Any product that may be evaluated in this article, or claim that may be made by its manufacturer, is not guaranteed or endorsed by the publisher.
Acknowledgments
The authors would like to thank Kastli Schaller and Brad Thomas for their experimental support and Fred Stewart for his critical review of this manuscript.
References
Alcazar‐Ruiz, A., Ortiz, M. L., Sanchez‐Silva, L., and Dorado, F. (2021). Catalytic Effect of Alkali and Alkaline Earth Metals on Fast Pyrolysis Pre‐treatment of Agricultural Waste. Biofuel Bioprod. Biorefin. 15 (5), 1473–1484. doi:10.1002/bbb.2253
Ávila-Lara, A. I., Camberos-Flores, J. N., Mendoza-Pérez, J. A., Messina-Fernández, S. R., Saldaña-Duran, C. E., Jimenez-Ruiz, E. I., et al. (2015). Optimization of Alkaline and Dilute Acid Pretreatment of Agave Bagasse by Response Surface Methodology. Front. Bioeng. Biotechnol. 3, 146. doi:10.3389/fbioe.2015.00146
Beitsch, R. (2019). A Move by China Puts U.S. Small-Town Recycling Programs in the Dumps. Washington Post. Available at: https://www.washingtonpost.com/national/health-science/a-move-by-china-puts-us-small-town-recycling-programs-in-the-dumps/2019/01/18/6a043642-1825-11e9-8813-cb9dec761e73_story.html.
EPA (2018). National Overview: Facts and Figures on Materials, Wastes, and Recycling. Available at: https://www.epa.gov/facts-and-figures-about-materials-waste-and-recycling/national-overview-facts-and-figures-materials#NationalPicture
Fernandes Diniz, J. M. B., Gil, M. H., and Castro, J. A. A. M. (2004). Hornification?its Origin and Interpretation in wood Pulps. Wood Sci. Technol. 37 (6), 489–494. doi:10.1007/s00226-003-0216-2
Guerfali, M., Saidi, A., Gargouri, A., and Belghith, H. (2015). Enhanced Enzymatic Hydrolysis of Waste Paper for Ethanol Production Using Separate Saccharification and Fermentation. Appl. Biochem. Biotechnol. 175 (1), 25–42. doi:10.1007/s12010-014-1243-1
Klinger, J., Bar-Ziv, E., Shonnard, D., Westover, T., and Emerson, R. (2015). Predicting Properties of Gas and Solid Streams by Intrinsic Kinetics of Fast Pyrolysis of wood. Energy Fuels 30, 318–325. doi:10.1021/acs.energyfuels.5b01877
Klinger, J. L., Westover, T. L., Emerson, R. M., Williams, C. L., Hernandez, S., Monson, G. D., et al. (2018). Effect of Biomass Type, Heating Rate, and Sample Size on Microwave-Enhanced Fast Pyrolysis Product Yields and Qualities. Appl. Energ. 228, 535–545. doi:10.1016/j.apenergy.2018.06.107
Langholtz, M. H., Stokes, B. J., and Eaton, L. M. (2016). 2016 Billion-Ton Report: Advancing Domestic Resources for a Thriving Bioeconomy, Volume 1: Economic Availability of Feedstocks. Oak Ridge, Tennessee: U.S. Department of Energy. doi:10.2172/1271651
Li, C., Liang, L., Sun, N., Thompson, V. S., Xu, F., Narani, A., et al. (2017). Scale-up and Process Integration of Sugar Production by Acidolysis of Municipal Solid Waste/corn stover Blends in Ionic Liquids. Biotechnol. Biofuels 10, 13. doi:10.1186/s13068-016-0694-8
Pala, H., Mota, M., and Gama, F. M. (2004). Enzymatic versus Chemical Deinking of Non-impact Ink Printed Paper. J. Biotechnol. 108 (1), 79–89. doi:10.1016/j.jbiotec.2003.10.016
Qureshi, M. S., Oasmaa, A., Pihkola, H., Deviatkin, I., Tenhunen, A., Mannila, J., et al. (2020). Pyrolysis of Plastic Waste: Opportunities and Challenges. J. Anal. Appl. Pyrolysis 152, 104804. doi:10.1016/j.jaap.2020.104804
Selig, M., Weiss, N., and Ji, Y. (2008). Enzymatic Saccharification of Lignocellulosic Biomass: Laboratory Analytic Procedure. NREL/TP-510-42629.
Shah, A. A., Hasan, F., Hameed, A., and Ahmed, S. (2008). Biological Degradation of Plastics: a Comprehensive Review. Biotechnol. Adv. 26 (3), 246–265. doi:10.1016/j.biotechadv.2007.12.005
Sipra, A. T., Gao, N., and Sarwar, H. (2018). Municipal Solid Waste (MSW) Pyrolysis for Bio-Fuel Production: A Review of Effects of MSW Components and Catalysts. Fuel Process. Technol. 175, 131–147. doi:10.1016/j.fuproc.2018.02.012
Sluiter, A., Hames, B., Ruiz, R., Scarlata, C., Sluiter, J., Templeton, D., et al. (2012). Determination of Structural Carbohydrates and Lignin in Biomass. Laboratory Analytical Procedure. NREL/TP-510-42618.
Sun, N., Xu, F., Sathitsuksanoh, N., Thompson, V. S., Cafferty, K., Li, C., et al. (2015). Blending Municipal Solid Waste with Corn stover for Sugar Production Using Ionic Liquid Process. Bioresour. Technol. 186, 200–206. doi:10.1016/j.biortech.2015.02.087
Thompson, V. S., Ray, A. E., Hoover, A., Emerson, R., Hartley, D., Lacey, J. A., et al. (2019). Assessment of Municipal Solid Waste for Valorization into Biofuels. Environ. Prog. Sustain. Energ. 39 (4), e13290. doi:10.1002/ep.13290
Turhollow, A. F., Webb, E., and Sokhansanj, S. (2009). Cost Methodology for Biomass Feedstocks: Herbaceous Crops and Agricultural Residues. ORNL/TM-2008-105. Oak Ridge National Laboratory.
Wang, L., Sharifzadeh, M., Templer, R., and Murphy, R. J. (2013). Bioethanol Production from Various Waste Papers: Economic Feasibility and Sensitivity Analysis. Appl. Energ. 111, 1172–1182. doi:10.1016/j.apenergy.2012.08.048
Wang, K., Zhang, J., Shanks, B. H., and Brown, R. C. (2015). The Deleterious Effect of Inorganic Salts on Hydrocarbon Yields from Catalytic Pyrolysis of Lignocellulosic Biomass and its Mitigation. Appl. Energ. 148, 115–120. doi:10.1016/j.apenergy.2015.03.034
Zaman, C. Z., Pal, K., Yehye, W. A., Sagadevan, S., Shah, S. T., Adebisi, G. A., et al. (2017). “Pyrolysis: A Sustainable Way to Generate Energy from Waste,” in Pyrolysis. Editor M. Samer (London, United Kingdom).
Keywords: enzymatic hydrolysis, pyrolysis, bio-oil, dimethyl ether (DME), dilute alkaline pretreatment
Citation: Brown RM, Hoover AN, Klinger JL, Wahlen BD, Hartley D, Lee H and Thompson VS (2022) Decontamination of Mixed Paper and Plastic Municipal Solid Waste Increases Low and High Temperature Conversion Yields. Front. Energy Res. 10:834832. doi: 10.3389/fenrg.2022.834832
Received: 13 December 2021; Accepted: 04 February 2022;
Published: 21 February 2022.
Edited by:
Timothy G. Rials, The University of Tennessee, United StatesReviewed by:
Somnath D. Shinde, Conagen Inc., United StatesMi Li, The University of Tennessee, United States
Copyright © 2022 Brown, Hoover, Klinger, Wahlen, Hartley, Lee and Thompson. This is an open-access article distributed under the terms of the Creative Commons Attribution License (CC BY). The use, distribution or reproduction in other forums is permitted, provided the original author(s) and the copyright owner(s) are credited and that the original publication in this journal is cited, in accordance with accepted academic practice. No use, distribution or reproduction is permitted which does not comply with these terms.
*Correspondence: Rebecca M. Brown, cmViZWNjYS5icm93bkBpbmwuZ292
 Rebecca M. Brown
 Amber N. Hoover
 Jordan L. Klinger
 Bradley D. Wahlen
 Damon Hartley
 Hyeonseok Lee
 Vicki S. Thompson