
94% of researchers rate our articles as excellent or good
Learn more about the work of our research integrity team to safeguard the quality of each article we publish.
Find out more
ORIGINAL RESEARCH article
Front. Energy Res., 23 September 2022
Sec. Carbon Capture, Utilization and Storage
Volume 10 - 2022 | https://doi.org/10.3389/fenrg.2022.832969
This article is part of the Research TopicDevelopments in Reservoir Characterization for Carbon Dioxide SequestrationView all 8 articles
The Lower Ordovician Rose Run Sandstone is a potential CO2 storage reservoir in the Central Appalachian Basin in northeast Kentucky where the Kentucky Geological Survey’s 1 Hanson Aggregates research well penetrated it at drill depths of 1,000–1,009.5 m. Average Rose Run porosity and permeability from core plugs are 9.1% and 44.6 mD, respectively. In situ reservoir properties were determined by step-rate testing an 18.6-m interval bracketing the Rose Run. Pressure derivative analysis of wellbore falloff pressure suggests that the Rose Run shares properties of both dual-porosity and dual-permeability reservoirs, consistent with its mixed lithologies. The Rose Run pore pressure was 9.3 MPa/km, 1.1 MPa/km underpressured compared to the expected hydrostatic gradient of 10.4 MPa/km. Average porosity of the Rose Run, at the industry-standard 7% porosity cutoff for assessing CO2 storage capacity, calculated from 27 wells in the surrounding region, was 11.6% and the average net reservoir thickness was 6.2 m. Geomechanical properties of the overlying Beekmantown Dolomite show that it would act as a reservoir confining interval during CO2 injection. The estimated P50 supercritical CO2 storage volume is 77.2 kt/km2, yielding P50 storage capacity of 165.7 Mt in the region. By itself, an average surface area of 12.9 km2 would be required to store 1 Mt of supercritical CO2 in the Rose Run, thus lacking the volume to act as a stand-alone CO2 storage reservoir in this area. It could contribute to a stacked-reservoir storage project developed in the larger Knox section, however. CO2–brine relative permeability tests suggest that nearly half of any supercritical CO2 injected into the Rose Run would be residually trapped, and another portion would be trapped by mineral precipitation. The Rose Run in the KGS 1 Hanson Aggregates well is very close to the subsurface CO2 critical depth in the northeast Kentucky region and lacks an updip reservoir trap. How far and fast the mobile CO2 migration might occur at this site remains for future research and reservoir modeling.
The Kentucky Geological Survey (KGS) operated and drilled the 1 Hanson Aggregates stratigraphic research well to assess the subsurface CO2 storage capacity in deep saline reservoirs of the Middle Cambrian–Lower Ordovician Knox Group and underlying strata in the Central Appalachian Basin in eastern Kentucky (Bowersox et al., 2013; Bowersox et al., 2013; Bowersox et al., 2017; Greb et al., 2017; Bowersox et al., 2018). All depths in the well were measured from the drilling rig kelly bushing (KB) which was 227.5 m above the sea level (2 m above the ground-level elevation of 225.5 m). It was drilled in northern Carter County, Kentucky, United States (Figure 1), at a location where all potential reservoir and confining strata and Precambrian basement could be penetrated at a total well depth (TD) less than 1,525 m below the surface (Bowersox et al., 2013; Bowersox et al., 2017; Bowersox et al., 2018). The 1 Hanson Aggregates well reached a TD of 1,474 m in Precambrian Grenville gneiss and successfully tested reservoir and in situ rock properties in both the Knox and underlying Middle Cambrian strata (Bowersox et al., 2017, Bowersox et al., 2018, Bowersox et al., 2019a; Bowersox et al., 2019b; Greb et al., 2017; Figure 2).
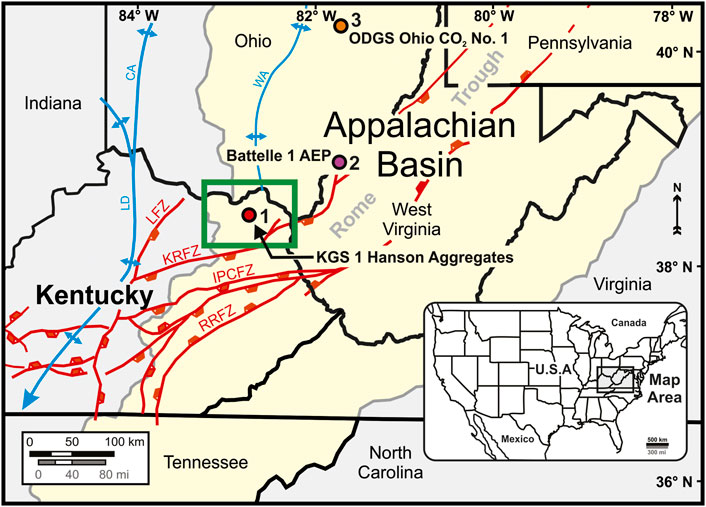
FIGURE 1. Location of the KGS 1 Hanson Aggregates well, northern Carter County, Kentucky. The study area is outlined by the gray box. Wells of interest identified by numbered red circles: 1, KGS 1 Hanson Aggregates well, Carter County, Kentucky; 2, Battelle 1 AEP well, Mason County, West Virginia; and 3, Ohio 1 CO2 well, Tuscarawas County, Ohio. The KGS 1 Hanson Aggregates well location was chosen northwest of the Kentucky River Fault Zone (KRFZ) and Rome Trough where the entire Ordovician to Precambrian basement section could be penetrated at a drill depth less than 1,525 m. LFZ, Lexington Fault Zone; IPCFZ, Irvine-Paint Creek Fault Zone; RRFZ, Rockcastle River Fault Zone; LD, Lexington Dome; CA, Cincinnati Arch; WA, Waverly Arch. Modified from Bowersox et al. (2018).
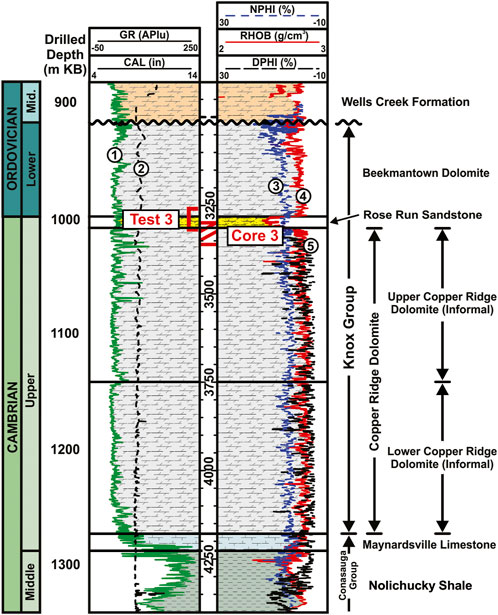
FIGURE 2. Correlated nuclear logs and lithostratigraphy of the Knox Group and deeper strata in the KGS 1 Hanson Aggregates well. Cored intervals are shown in the depth track and test intervals are posted. Log curves shown are the gamma-ray (curve 1, left track), wellbore caliper (curve 2, left track), neutron porosity (curve 3, right track), formation density (curve 4, right track), and density porosity (curve 5 right track). Modified from Bowersox et al. (2019a).
The focus of this report is the Rose Run Sandstone formation of the Knox Group, an important reservoir for oil and gas production and liquid waste disposal in the U.S. Midcontinent (Rike, 1992; Riley, 1992; Riley, 1994; Battelle Memorial Institute, 2015) and candidate deep saline reservoir for CO2 storage. Previous tests of the Rose Run’s capacity for storing CO2 were conducted in the Battelle Memorial Institute (Battelle) 1 American Electric Power (AEP) well at the Mountaineer Power Plant on the Ohio River at New Haven, West Virginia (Gupta et al., 2006; Lucier et al., 2006; Gupta, 2008a; Gupta, 2008b; Lucier and Zoback, 2008), 118 km northeast of the 1 Hanson Aggregates (Figure 1, location 2), and in the Ohio Division of Geological Survey CO2 No. 1 well near Port Washington, Tuscarawas County, Ohio (Wickstrom et al., 2011), about 250 km northwest of the KGS 1 Hanson Aggregates well (Figure 1, location 3; Figure 3).
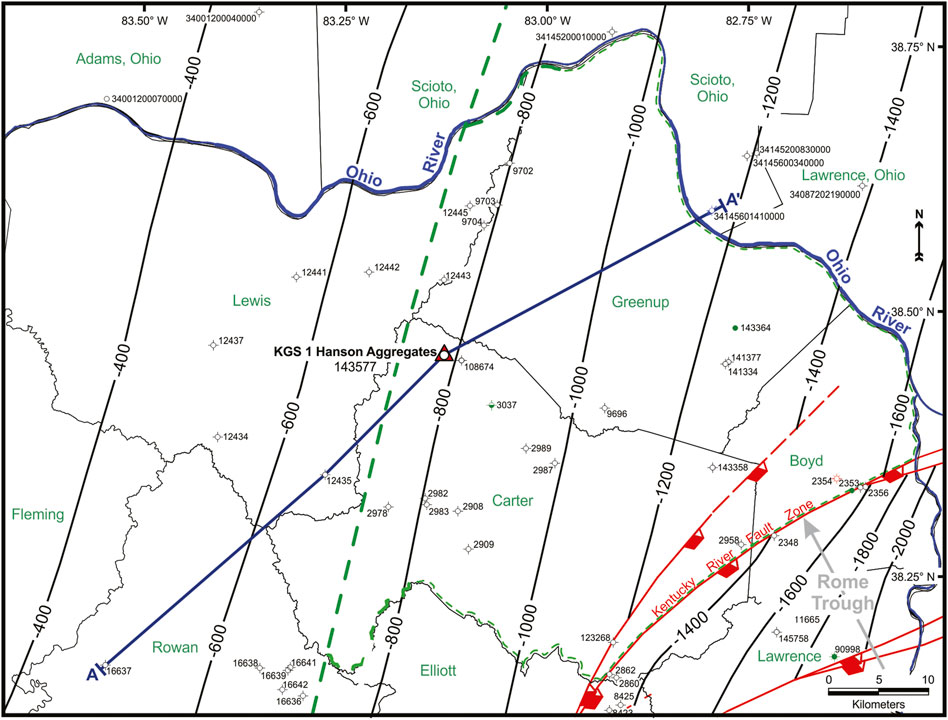
FIGURE 3. Subsurface structural contours on top of the Rose Run Sandstone show gentle dip to the east (−0.8°) in the region northwest of the Kentucky River Fault Zone. Wells shown on this and subsequent maps are those reaching the Precambrian basement. The evaluation region is outlined by the dashed green line, and the updip limit of potential supercritical CO2 storage is shown by the dashed green contour at -714 m subsea elevation. Contour interval is 200 m.
This study reports the results of tests and analyses of the Rose Run reservoir properties conducted in the KGS 1 Hanson Aggregates well. We provide an estimate of the CO2 storage capacity of the Rose Run in the KGS 1 Hanson Aggregates well and the surrounding region that contributes to the evaluation of subsurface CO2 storage along the Ohio River industrial corridor (Gupta et al., 2006; Lucier et al., 2006; Gupta, 2008a; Gupta, 2008b), although there are no plans for its development in foreseeable future.
KGS collected a robust dataset of geophysical log data and conventional whole core and rotary sidewall core analyses from the KGS 1 Hanson Aggregates well (discussed in detail in Bowersox et al., 2018) to conduct this evaluation of the Rose Run. The Rose Run was a primary zone of interest in the KGS 1 Hanson Aggregates well for testing reservoir properties and estimating CO2 storage capacity. This study reviews the reservoir properties of the Rose Run interpreted from geophysical electric and nuclear logs (electric logs or logs), formation imaging logs, analyses of conventional whole-diameter cores (Figure 2, Test 3) and rotary sidewall cores, and in situ reservoir properties determined from step-rate testing to estimate its CO2 storage capacity in northeast Kentucky. All geophysical logs used in this evaluation, as well as core photographs, are available free to the public through KGS’s Oil and Gas Records Database at https://kgs.uky.edu/kygeode/services/oilgas/, KGS Record Number 143577. Core analyses are available on request from the KGS at Contact Kentucky Geological Survey, University of Kentucky (uky.edu).
An 8.9-cm core was cut and recovered from the Rose Run in the 1 Hanson Aggregates from 1,006 m through its base at 1,010 m, then to 1,024 m in the underlying Copper Ridge Dolomite (Figure 2, Core 3). Above the core, sampling of the Rose Run was supplemented with 12 rotary sidewall cores. Unless otherwise noted, core analyses were performed by Core Laboratories, Houston, Texas. These analyses of core plugs and sidewall cores included routine porosity and permeability for nine core plugs and one sidewall core; thin section petrography and X-ray diffraction mineralogy (XRD), and CO2-brine relative permeability of one core plug each. Geomechanical properties were measured in two rotary sidewall cores from the Beekmantown and one from the Rose Run. Mercury-injection capillary pressure (MICP) test data of one core plug from 1,009.3 m were provided by the Indiana Geological Survey and Water Survey, and geomechanical analysis of a core plug from the same depth was provided by Battelle.
All software packages used during this study are commercial releases, although not necessarily the most recent versions. Figures not otherwise attributed to specific software packages, including annotations and colored fills (Figures 1–3), were constructed using CorelDRAW X7, Version 17.6.0.1021. All figures including logs (Figure 2), contour maps (Figure 3), and cross sections (Figure 4) were initially constructed using PETRA, Version 3.8.3, with corrections, annotations, and labels, and graphic fills added in CorelDRAW X7. Formation porosity calculated from the density log, geomechanical properties, wellbore pressure profiles, and Rose Run CO2 storage capacity were modeled using Quattro Pro X5, Version 15.0.0.528. Graphs presented in this study were constructed using Delta Graph 7, Version 7.5.0, with annotations and fills added using CorelDRAW.
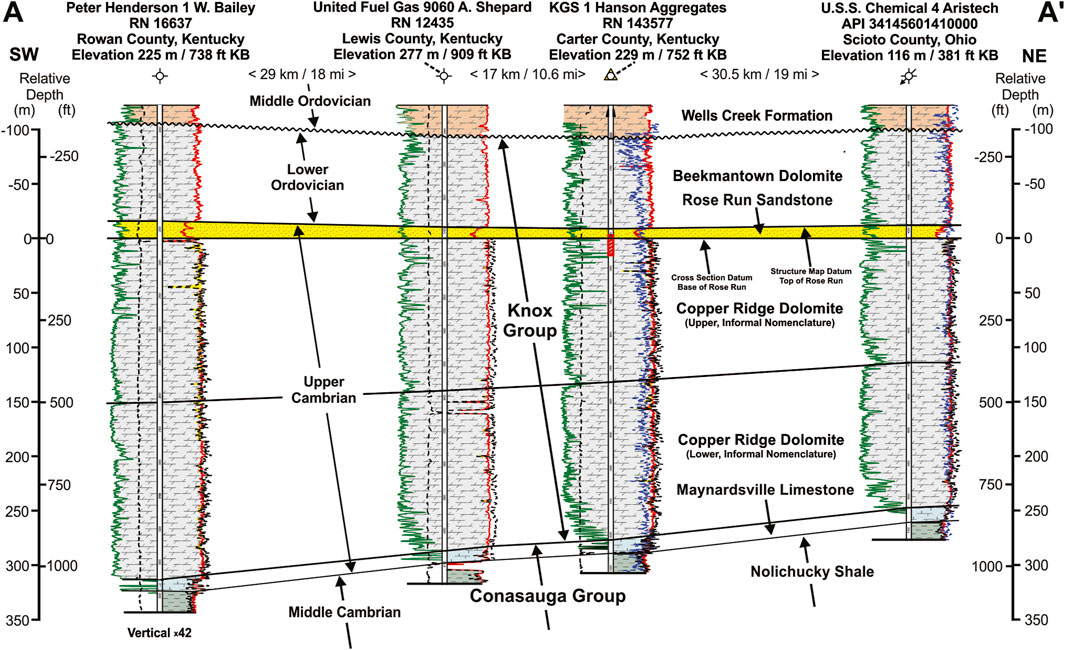
FIGURE 4. Stratigraphic cross section A–A′ of the Knox Group oriented approximately southeast–northeast. Datum is the base of the Rose Run. The Rose Run thins into central and southwest Carter County, and then thickens into Rowan County (Figure 5). RN is the KGS record number and API is the well API number.
The geology of the Rose Run Sandstone in the northeast Kentucky study area and adjacent Ohio and West Virginia is summarized from Bowersox et al. (2021). The Rose Run lies near the Cambrian–Ordovician boundary throughout much of the Central Appalachian Basin in the study area. The KGS 1 Hanson Aggregates well lies on the eastern flank of the Waverly Arch (Woodward, 1961; Ettensohn, 1980; Figure 1), a low-relief forebulge of the Appalachian foreland basin associated with the Taconic Orogeny (Root and Onasch, 1999). In the mapped study area (Figure 3), the Rose Run is near-horizontal, occurring as a single sand body overlying the Copper Ridge (Figures 2, 4), that thins south of the KGS 1 Hanson Aggregates (Figures 4, 5). Well cuttings, rotary sidewall cores, and whole cores from the Rose Run in the KGS 1 Hanson Aggregates well showed it to be a white to green–gray, fine-to medium-grained sandstone with subrounded to rounded grains and dolomitic cement (Bowersox et al., 2021). North of the study area, in the Battelle 1 AEP well and in the Ohio Division of Geological Survey CO2 No. 1 well (Figure 1); the Rose Run occurs as thin sands interbedded with dolomite (Figure 6), whereas in central Ohio along the Waverly Arch (Figure 1); the Rose Run may consist of as many as four distinct sandstones with significant porosity and permeability (Riley, 1992; Riley et al., 1993; Riley et al., 2002) separated by dolomites (Riley et al., 2002; Wickstrom et al., 2005; Gupta, 2006).
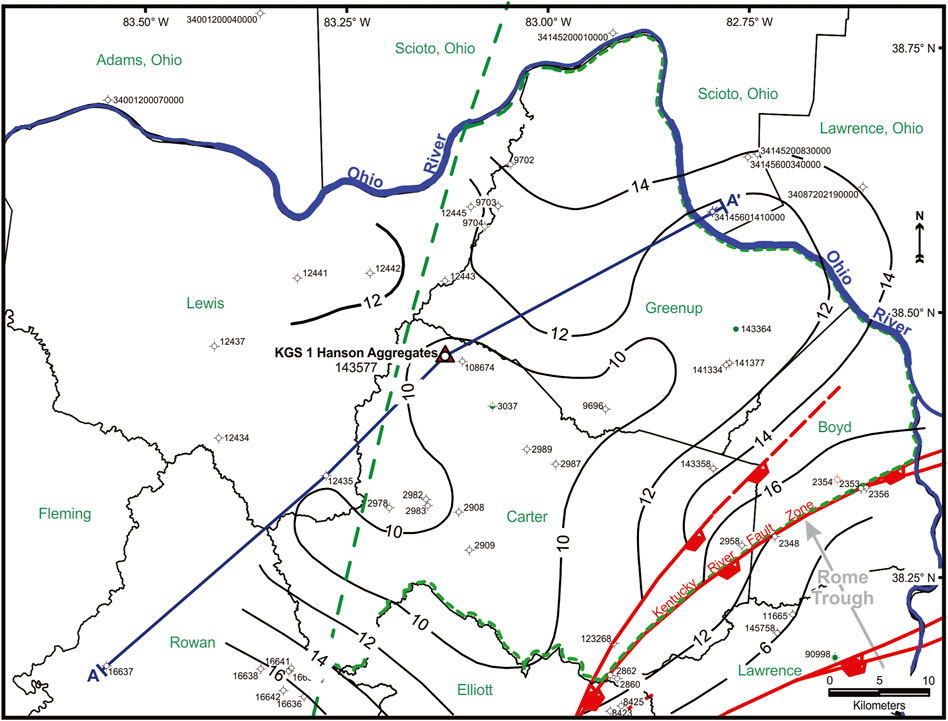
FIGURE 5. Isopach thickness of the Rose Run. In general, the Rose Run thickens and becomes more dolomitic to the southwest. Contour interval is 2 m.
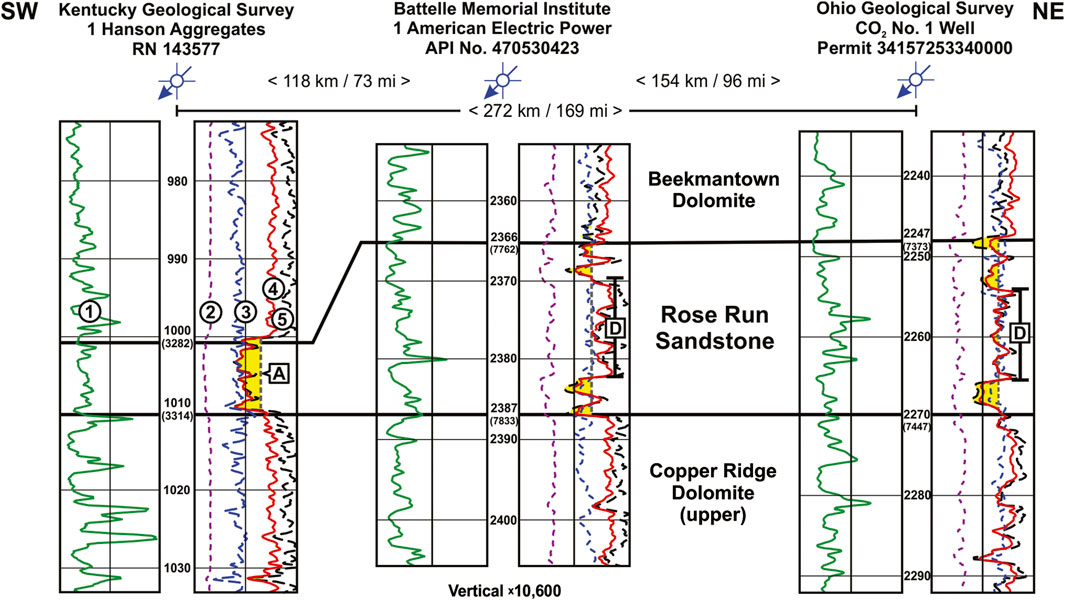
FIGURE 6. Comparison of the Rose Run sections in the KGS 1 Hanson Aggregates well, Battelle 1 AEP well, and Ohio CO2 No. 1 well (Figure 1). Depths are meters below the rig kelly bushing. The Rose Run section thickens to the northeast where thick, porous sand beds (yellow fill) are separated by a middle section of thin, low-porosity sand and dolomite beds. Log curves shown are the gamma-ray (curve 1, left track), PE curve (curve 2, right track), neutron porosity (curve 3right track), formation density (curve 4, right track), and density porosity (curve 5, right track). Dashed line A is a 7% porosity (yellow fill) cutoff, and D is the dolomitic section in the downdip Rose Run wells.
The 9.8 m-thick section of Rose Run was penetrated in the KGS 1 Hanson Aggregates well at drilled depths of 1,000 m–1,009.8 m kB and was cored at depths from 1,005.8 m to its base at 1,009.8 m (Figure 2). The cored section was consisted of thin-bedded dolomitic quartz arenite with thin clay beds near the base. XRD analysis of a core plug near the base of the Rose Run at 1,008.1 m found 71.1% quartz, 20.9% dolomite, and a total of 7.5% potassium feldspar, illite/smectite clays, and mica. Dolomite volume in the Rose Run section was determined from a crossplot of formation bulk density and photoelectric factor from the density log (Schlumberger, 1987) normalized to the mineralogy from the XRD analysis (Bowersox et al., 2021). The average dolomite volume in the Rose Run above 1,006 m (3,300.5 ft) drilled depth was 6.8%, whereas the average dolomite volume below 1,006 m averaged 15.3% (Bowersox et al., 2021). Porosity of the Rose Run was calculated from the formation density log (Alger et al., 1963; Schlumberger, 1972). The matrix density of the Rose Run was most affected by the dolomite content, and averaged 2.67 g/cm3 (Bowersox et al., 2021). The formation fluid density of 1.06 g/cm3 was determined from a water sample collected from the Rose Run before the step-rate test (Bowersox et al., 2021). Porosity calculated in the Rose Run averaged 11.2% in the KGS 1 Hanson Aggregates well (Bowersox et al., 2021). At the industry-standard 7% porosity cutoff used for evaluating CO2 storage reservoirs (Medina et al., 2011), the average Rose Run porosity in the 1 Hanson Aggregates was 12.3% and the net reservoir thickness was 8.5 m. In the mapped 2,146 km2 evaluation region (Figures 3, 5), the average porosity was 11.4% in 23 wells and average net reservoir thickness was 6.2 m.
Porosity and permeability measured in 108 core plugs from the Rose Run in wells in Kentucky, Ohio, and West Virginia (Figure 7) were compiled for assessing reservoir porosity and permeability in the evaluation region around the KGS 1 Hanson Aggregates well. Median porosity measured in the Rose Run core plugs was 13.4% and median permeability is 57.6 mD (Bowersox et al., 2021) and ranged from >20% in the KGS 1 Hanson Aggregates well to <1% in the Hope Natural Gas 9,634 Power Oil well in Wood County, West Virginia (Figure 7). Generally, porosity and permeability in the Rose Run decrease with depth (Battelle Memorial Institute, 2015; Bowersox et al., 2021, Figure 6) suggesting compaction as the cause. Porosity measurements and core descriptions from 17 wells drilled in Kentucky, Ohio, and West Virginia suggest that porosity reduction in cores from the Rose Run recovered from drilled depths shallower than 1750 m (5,740 ft) appears to have been co-dominated by compaction and diagenesis, whereas deeper than 1750 m (5,740 ft) drilled depth porosity-occluding diagenesis appears to have dominated porosity reduction in the Rose Run (Heald and Baker, 1977; Bowersox et al., 2021, Figure 6).
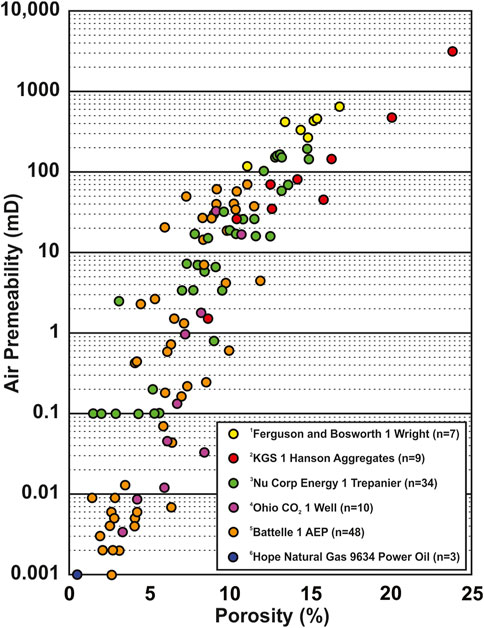
FIGURE 7. Comparison of porosity and permeability of core plugs from the Rose Run in selected wells in Kentucky, West Virginia, and Ohio. Porosity and permeability generally fall in the range for potential CO2 storage where porosity is greater than 7%, the industry-standard cutoff for CO2 storage (Medina et al., 2011), and 1 mD permeability. Sources: Ferguson and Bosworth 1 Wright well, KGS Oil and Gas Database, Record Number 2210; KGS 1 Hanson Aggregates well, KGS Oil and Gas Database, Record Number 143577; Nu Corp Energy 1 Trepanier well, McNealey (1991); Ohio 1 CO2 well, Wickstrom et al. (2011); Battelle 1 AEP well, Joel Sminchak, Battelle Memorial Institute, personal communication, 24 July 2019; Hope Natural Gas 9,634 Power Oil well, Woodward (1961). Core plug locations for the Rose Run in the KGS 1 Hanson Aggregates well are shown in Bowersox et al. (2021, Figure 5).
The Battelle 1 AEP well (Figures 6, 7) found 5.0 m of net sandstone with porosity >6%, averaging 9.0% porosity, but with permeabilities less than 70 mD, encountered in the 25.0 m-thick Rose Run section (this study) in the well (Gupta, 2008a; Battelle Memorial Institute, 2015). Likewise, 7.3 m of the net Rose Run sandstone with porosity >6%, averaging 8% porosity, and permeabilities less than 32 mD, were found in the 27.7 m-thick Rose Run section (this study) in the Ohio No. 1 CO2 well (Wickstrom et al., 2011; Figures 6, 7). The Rose Run in both wells occurs in multiple thin beds less than 3.5 m-thick, (Figure 6), and neither well found reservoir properties in the Rose Run sufficient to support stand-alone CO2 storage (see the discussion in Bowersox et al., 2019a).
Mercury-injection capillary pressure (MICP) analysis is widely used to model permeability in tight formations (Comisky et al., 2007) because laminar flow theory predicts a strong correlation between permeability and pore-throat distribution (Brown, 2015). As with any empirical relationship, there are multiple models for estimating permeability from MICP data, whose results can differ substantially (Brown, 2015). MICP data, however, are equally applicable for calibrating porosity logs (Olson and Grigg, 2008) and characterizing reservoir quality as well as identifying reservoir flow units (Sneider and Bolger, 2008). Because permeability in the Rose Run has been measured in core plugs throughout the Central and Northern Appalachian Basin (Battelle Memorial Institute, 2015), MICP was conducted in one core plug from 1,009.3 m, near the base of the Rose Run to characterize pore diameter distribution for comparative flow modeling. Thin section petrography performed on the core plug (Figure 8A) showed that intergranular, intraconstituent (from dissolution of feldspar grains), and oversize pores are the primary porosity types (Heald and Baker, 1977; Riley et al., 2002; Wickstrom et al., 2005) which were not occluded by silica overgrowths, pore-filling dolomite cement, and authigenic K-spar. MICP analysis (Figures 8B,C) showed 75% of pore throats to be macro-to megapores suggesting that CO2 injection may be possible at relatively lower pressures than strata whose porosity falls in the meso-to nanopore range (Figure 8B). A plot of the pore-throat diameter versus the pore volume (Figure 8C) suggests that the Rose Run in the KGS 1 Hanson Aggregates well would be capable of oil and gas production (Sneider and Bolger, 2008). In fact, a >2900-unit gas kick, about 30-times the background gas in the wellbore, was encountered when the Rose Run was penetrated at −1,000 m drilled depth while drilling with air. The gas entry was stopped by filling the wellbore and circulating fresh water, demonstrating a limited-volume low-pressure (<9.85 MPa, fresh water hydrostatic pressure at 1,000 m drill depth) gas inclusion. Reservoir pressures measured during step-rate testing found pore pressure of 9.3 MPa/km, 1.1 MPa/km underpressured compared to the expected hydrostatic gradient of 10.4 MPa/km.
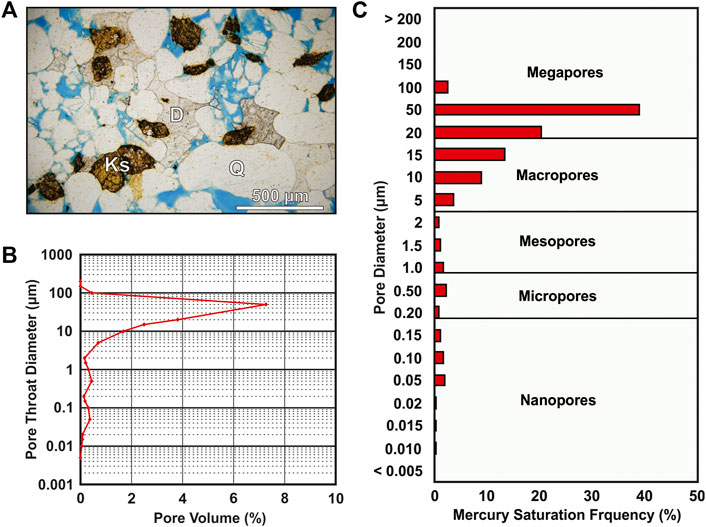
FIGURE 8. Thin section photomicrograph of a core plug from the Rose Run from 1,008.1 m under plane polar light, and (B), (C), Mercury‐Injection Capillary Pressure (MICP) analysis of a core plug from 1,009.3 m. Core plug locations for the Rose Run in the KGS 1 Hanson Aggregates well are shown in Bowersox et al. (2021, Figure 5). (A). Mineral grains in the thin section are identified with capital letters (Q, quartz; Ks, potassium feldspar; D, dolomite). Subrounded to rounded quartz grains show silica and potassium feldspar overgrowths and pressure dissolution at grain boundaries. (B). MICP was conducted for one core plug near the base of the Rose Run to characterize pore diameter distribution. The bulk of the pore diameters fall into the macro-to megapore range suggesting that supercritical CO2 may be injected at relatively lower pressures than strata whose pores fall into the meso-to nanopore range. The median pore-throat radius was 9.04 μm, well within the macropore range, and core plug permeability was 289 mD. (C). Most pore volume in the KGS 1 Hanson Aggregates well falls in range of 10–100 µm. Pore-throat diameter versus pore volume suggests that the Rose Run in the KGS 1 Hanson Aggregates well, pores with throat diameters >2 µm, would be capable of oil and gas production in a conventional hydrocarbon reservoir.
Following step-rate test completion, the pressure was monitored for about 12 h, exhibiting a smooth falloff during the monitoring period (Bowersox et al., 2021, Figure 11). Pressure falloff was analyzed using the methodologies of Matthews and Russell (1967) and Bourdet et al. (1989) (Figures 9A,B). The wellbore entered radial flow early during pressure falloff monitoring, about 0.5 h after shut-in. The average permeability of the test interval was calculated as described in Horner (1951) and Matthews and Russell (1967).
where q is the average injection rate of 5,728 barrels per day (911 m3/d) during the test, β is the formation volume factor of the reservoir water (1.0 reservoir barrels per stock-tank barrel), μ is the viscosity of the formation water (0.94 centipoise for 90,000 mg/l water under reservoir conditions (Matthews and Russell, 1967), m is the slope of the semi-log plot of the pressure falloff curve during radial flow, 1.31 MPa (190 psi) per cycle (Figure 9A), and h is the test interval height (18.6 m, 61 ft). The average Rose Run test interval permeability calculated from pressure falloff data is 75.5 mD (Bowersox et al., 2019b), nearly identical to the median air permeability of 70.0 mD measured in nine core plugs and rotary sidewall cores from the Rose Run.
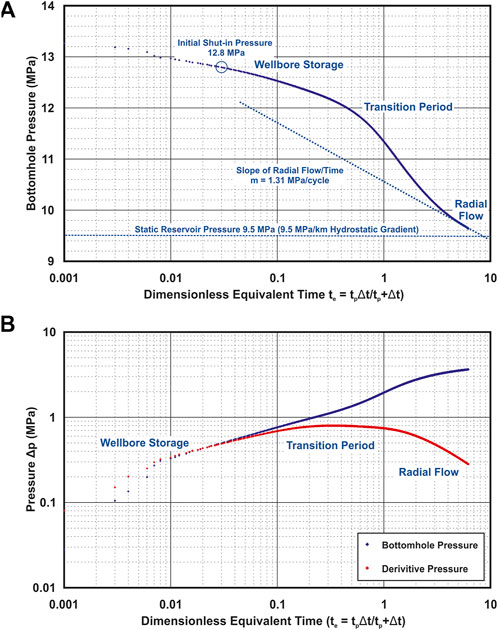
FIGURE 9. Pressure transient analysis of the step-rate test data. (A). Log-log plot of bottomhole falloff pressure delta-p (dp) plotted against Agarwal dimensionless equivalent time (Agarwal, 1979, 1980). The wellbore entered radial flow shortly after falloff pressure monitoring began, as shown in Bowersox et al. (2021, Figure 11). Test interval permeability calculated from the pressure falloff data was 75.5 mD with a −3.59 skin factor indicative of wellbore flow enhancement by hydraulic fracturing, consistent with the step-rate test response. (B) Derivative pressure (dp/dt) plotted against Agarwal dimensionless equivalent time. Pressure-gauge data have been resampled at five-reading intervals to reduce noise in the data. The wellbore entered radial flow about 0.5 h after shut-in. The pressure derivative curve suggests the Rose Run in the KGS 1 Hanson Aggregates well shares flow properties of both dual-porosity and dual-permeability reservoirs, consistent with the mixed sand–dolomite lithologies in the test interval.
The skin factor, a dimensionless variable, relates the pressure drop in a well predicted by Darcy’s law to the dimensionless rate of flow (van Everdingen, 1953; Matthews and Russell, 1967):
where s is the skin factor, Δpskin is the pressure change from the skin factor, and the rest of the terms are from Eq. 1. The skin factor in a wellbore will range from −6 to 6 (Harstock and Warren, 1961; Matthews and Russell, 1967), where skin factor < −2 is indicative of wellbore flow enhancement by hydraulic fracturing (Matthews and Russell, 1967). The skin factor calculated from pressure falloff in the KGS 1 Hanson Aggregates well is −3.59 (Bowersox et al., 2019b), confirming wellbore fracturing observed during the step-rate test.
A pressure derivative curve (Bourdet et al., 1989) was plotted against dimensionless equivalent time (Agarwal, 1979, 1980) to help determine the wellbore storage period, transition to radial flow, and reservoir type (Figure 9B). A comparison of the pressure derivative curve in Figure 9B to type curves (Ehlig-Economides, 1988; Bourdet et al., 1989; Deruyck et al., 1992) suggests the Rose Run in the KGS 1 Hanson Aggregates well shares properties of both dual-porosity and dual-permeability reservoirs, consistent with the mixed lithologies in the test interval.
The reservoir volume required to store a volume of supercritical CO2 (hereinafter CO2 or supercritical CO2, depending on context) in a deep saline reservoir requires five data points: reservoir height, porosity, temperature, pressure, and formation-water salinity. The CO2 temperature/pressure phase-change boundaries (adapted from Freund et al. (2005)) at expected depths were estimated from bottomhole temperatures and pressures measured wells in the region surrounding the KGS 1 Hanson Aggregates well and the three step-rate tests in the well (Bowersox et al., 2021). However, the depth to the CO2 critical point for subsurface storage can usually be estimated from reservoir hydrostatic pressure and regional geothermal gradients, ubiquitous underpressured reservoirs in Kentucky (Takacs et al., 2010) and with the low geothermal gradient (see the discussion in Bowersox et al. (2013)) push the depth to the CO2 critical point much deeper in the subsurface. The top of the Rose Run was penetrated in the KGS 1 Hanson Aggregates well at a depth of 1,000 m (−772 m subsea elevation). The CO2 critical pressure and temperature (7.39 MPa, 1,072 psi; Freund et al., 2005) reached at a drill depth of 795 m (−567 m subsea elevation) in the KGS 1 Hanson Aggregates well. The critical temperature, however (31.1; C; Freund et al., 2005), is not reached until a drill depth of 942 m (−714 m subsea elevation), or 58 m above the top of the Rose Run in the KGS 1 Hanson Aggregates well (Figure 10). Thus, the depth required to reach the CO2 critical point temperature limits the reservoir area available for CO2 storage in the northeast Kentucky evaluation region.
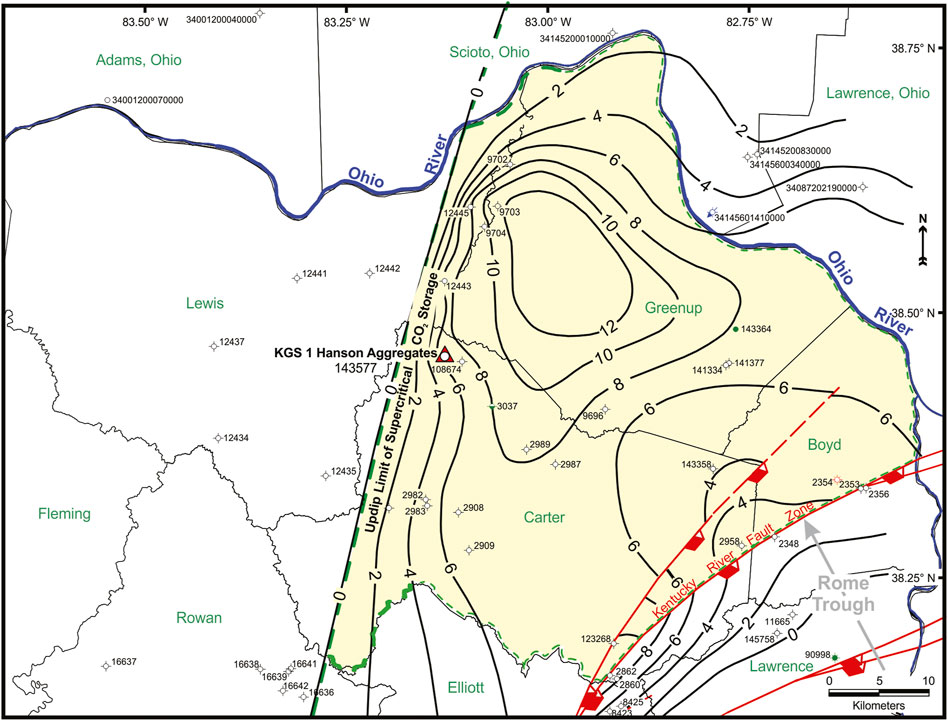
FIGURE 10. Isopach thickness contours of the net Rose Run storage reservoir in the evaluation area at 7% porosity cutoff. Average net reservoir thickness in the 2145-km2 area is 6.2 m, and average porosity in the Rose Run reservoir ≥7% is 11.6%.
Average porosity and net reservoir thickness (hnet) in the Rose Run in the 1 Hanson Aggregates well and 2,145 km2 (828 mi2) evaluation region (Figure 10) were calculated using the industry-standard 7% porosity cutoff (Medina et al., 2011) to compute the CO2 storage capacity. At the 7% porosity cutoff, average porosity in the evaluation region is 11.6% and hnet is 6.2 m (20 ft). The density of supercritical CO2 under Rose Run reservoir conditions of temperature and pressure is 768 kg/m3 (Peace Software, 2017). Supercritical CO2 storage capacity in a deep saline reservoir was calculated using the methodology of Goodman et al. (2011).
where GCO2 is the estimated supercritical CO2 storage volume (kt/km2), At is the surface area of the storage reservoir (km2), φT is the average regional reservoir porosity (fractional) at the 7% porosity cutoff, hg (m) is the average net reservoir thickness (Figure 10), ρCO2 is the density of supercritical CO2 under reservoir conditions of pressure and temperature (kg/m3), and Esaline is the reservoir lithology-weighted CO2 storage efficiency factor. The reservoir pore volume (φThg) at the 7% porosity cutoff was calculated for 27 wells in the evaluation region, and then the total reservoir volume calculated in Petra.
Although the CO2 storage efficiency factor accounts for unsuitable reservoir rock by lithology (Goodman et al., 2011), applying a 7% porosity cutoff ensures a conservative evaluation of storage capacity. The storage efficiency factor, in practice, is applied as a range of probable storage efficiencies which vary for different reservoir lithologies (U.S. Department of Energy, Office of Fossil Energy, National Energy Technology Laboratory, 2015). P10 and P90 values provide a nominal range of efficiency values defining the lower and upper bounds of plausible supercritical CO2 storage volumes about a most-likely P50 value. The estimated P50 supercritical CO2 storage volume for the Rose Run in the northeast Kentucky evaluation region (Figure 10) is 77.2 kt/km2 (220,000 short tons/mi2), 165.7 Mt (1.8 × 10⁸ short tons) in the 2,145 km2 (828 mi2) evaluation region, with a P10–P90 range of 40.8 kt/km2 (116,500 short tons/mi2) to 132.4 kt/km2 (378,000 short tons/mi2), or 87.6–284.1 Mt (9.7 × 10⁷—3.1 × 10⁸ short tons) in the evaluation region. The surface area required to store the estimated P50 supercritical CO2 volume in the Rose Run is 12.9 km2/Mt (−4.5 mi2/million short tons), or 388.4 km2 (150 mi2) of surface area to store 30 Mt (33 million short tons) of CO2 generated during the life span of a coal-fired electrical generating plant.
The Rose Run is overlain by 60 m of dense dolomites of the Beekmantown, 1.2 m of sandy carbonates correlated to the Middle Ordovician St. Peter Sandstone, 24.4 m of dolomites of the Wells Creek Formation, 166 m of dolomites of the Upper Ordovician High Bridge Group, 82 m of limestones of the Lexington Limestone, and 249 m of mixed Upper Ordovician shales and limestones (Bowersox et al., 2018). The Beekmantown Dolomite, lying immediately above the Rose Run (Figure 2) commonly has overall low porosity and permeability with thin porous and permeable intervals except near the top where paleokarst locally causes significant porosity and permeability (Gupta et al., 2006; Greb et al., 2009; Wickstrom et al., 2011; Greb et al., 2012). Although the Beekmantown was not sampled for porosity and permeability, analysis by Bowersox et al. (2021, Figure 10) demonstrated that its geomechanical strength, about double that of the Rose Run, is sufficient for confinement of stored CO2 if the Rose Run fractures during injection (Bowersox et al., 2021).
Shales of the Upper Ordovician section are correlated to the Clays Ferry and Kope Formations which are commonly considered regional sealing layers (Greb and Anderson, 2010). Four core plugs from Clays Ferry–Kope Formation sampled between 634.0 and 652.1 m (−405.0 m and −423.1 m subsea elevation, respectively) have permeabilities from 1.93 × 10⁻⁷ mD to 4.94 × 10⁻⁹ mD (mean of 7.411 × 10⁻⁸ mD) and Swanson permeabilities from mercury injection analyses ranging from 3.71 × 10⁻⁵ mD to 6.0 × 10⁻⁵ mD (mean of 4.9 × 10⁻⁵ mD), suggesting this may be an effective sealing interval CO2 migration. The permeability of the Clays Ferry–Kope interval, however, may be sufficiently low to be a CO2 confining interval, but shallower than the critical depth for storing supercritical CO2 (at −714 m subsea elevation, 942 m kB drilled depth in the KGS 1 Hanson Aggregates well) in northeast Kentucky and adjacent regions. In the shallow subsurface, the Lower Mississippian Sunbury Shale (4.6-m thick) occurs at 125 m drill depth, and the Upper Devonian Ohio Shale (106.4-m thick) occurs at 170.4 m drill depth, where these organic-rich shales form part of another widely recognized, regional confining interval (Casey, 1992; Casey, 1996; Wickstrom et al., 2011). Careful monitoring and management of CO2 injection pressures will mitigate the likelihood of vertical CO2 migration from the Rose Run.
CO2–brine fluid mixtures can present complicated multiphase flow conditions in a storage reservoir (Sminchak et al., 2009), however; CO2 solubility in an aqueous phase is very low and can be neglected from mixing rules at temperatures less than 100 C (Spycher et al., 2003; Hassanzadeh et al., 2008). CO2–brine relative permeability was tested in a core plug from 1,009.6 m at the base of the Rose Run. Relative permeability measured during the drainage phase of the core plug testing is shown in Figure 11. Effective permeability to CO2 in this sample is 24.6 mD, or less than half of the median air permeability in the Rose Run. Estimated residually trapped CO2 in the Rose Run section was calculated as described in Burnside and Naylor (2014).
where St is the trapped CO2 saturation, the residual saturation where relative permeability to CO2 is zero, and Smax is the maximum CO2 saturation reached in the test. In this core plug, R is 47.3%, thus nearly half of any CO2 that may be injected into the Rose Run in a well similar to the KGS 1 Hanson Aggregates well, may be residually trapped. This is within the range of R in the Maryville and Basal sands in the KGS 1 Hanson Aggregates well (Bowersox et al., 2017; 2019a) and greater than the residually trapped CO2 in a Mount Simon Sandstone core (R = 38.9%) from the Illinois Basin (Burnside and Naylor, 2014).
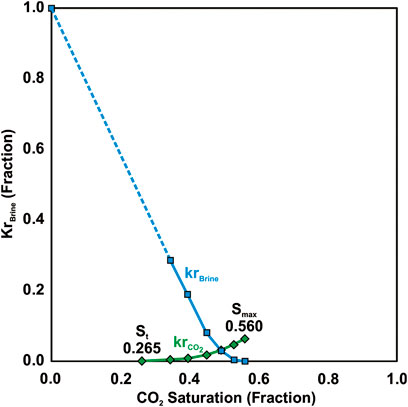
FIGURE 11. CO2–brine relative permeability tests of the Rose Run in the 1 Hanson Aggregates. Relative permeability to brine (krBrine) is shown in blue and to CO2 (krCO2) in green. Maximum CO2 saturation (Smax) and residual CO2 saturation (St) points are posted. Capillary trapping efficiency, the percentage of residually trapped CO2 in the Rose Run (R % = (St/Smax) × 100; Burnside and Naylor, 2014), is 47.3%. That is, almost half of the CO2 injected into the Rose Run would be trapped in the pore space and unable to migrate out of the reservoir in the event of a seal failure.
As a known saline reservoir in parts of Ohio and Kentucky, the Rose Run Sandstone has been a regional target for potential carbon sequestration (Zerai et al., 2006; Greb et al., 2009; Venteris et al., 2009; Greb and Solis, 2010; Greb et al., 2012). Wickstrom et al. (2010) estimated 11 Gt (12.1 B short tons) of volumetric CO2 storage potential in deep saline reservoirs in eastern Kentucky, of which the Rose Run, assuming 10 m of net sand with 8% average porosity, was estimated to have potential CO2 storage capacity of 5.4 Gt (−6 B short tons). Throughout the area evaluated for CO2 sequestration by the Midwest Regional Carbon Sequestration Partnership (MRCSP), fracture porosity was the least common type of porosity observed in Rose Run cores (Wickstrom et al., 2010), consistent with observations of this study.
The Rose Run in the KGS 1 Hanson Aggregates well and surrounding evaluation region has good porosity and permeability (Figure 8) and good injectivity (Bowersox et al., 2021), but does not have sufficient reservoir volume to serve as a large-volume (30-million ton) CO2 storage reservoir (Figure 10). The Beekmantown and overlying strata have sufficient geomechanical strength, about double that of the Rose Run (Bowersox et al., 2021), and low porosity and permeability as measured in core plugs and rotary sidewall cores from the Battelle 1 ARP well (Joel Sminchak, Battelle, unpublished data) averaging 1.25% porosity and <0.001 mD permeability, respectively, to ensure confinement of stored CO2, thus the Rose Run could contribute to a stacked-storage reservoir (discussed in Hovorka, 2013; Raziperchikolaee et al., 2019).
The comparison of Rose Run CO2 storage capacity in the KGS 1 Hanson Aggregates well and the Battelle 1 AEP well and Ohio 1 CO2 well tests.
Gupta (2008a) found the Rose Run to be unsuitable for CO2 storage downdip at the Battelle 1 AEP test well site in West Virginia where there are three primary differences when compared to the KGS 1 Hanson Aggregates well: i. The Rose Run in the Battelle 1 AEP well lies at a much greater drilled depth (2,365–2,387 m), about 1,364 m deeper than in the KGS 1 Hanson Aggregates well (Figure 6), and would thus require much greater injection pressure (Lucier et al., 2006), ii. The logs through the 22 m Rose Run stratigraphic interval show 13.1 m of net sand (as used in this study) interbedded with thin dolomite beds (Figure 6) versus a single sand body as found in the KGS 1 Hanson Aggregates well, and iii. The Rose Run in the Battelle 1 AEP well has much lower porosity (Figure 7) compared to the KGS 1 Hanson Aggregates well. Analysis of 31 plugs (Figure 7) from conventional whole cores from the Battelle 1 AEP well shows average porosity in the Rose Run of 6.3% and average permeability of 12 mD (Gupta, 2008b), and one core plug at 2,369.8 m with 10.4% porosity and 49 mD permeability (Gupta 2006). Average permeability calculated from a “straddle packer” test of the Rose Run in the Battelle 1 AEP well, assuming a 10.7 m composite productive sandstone section, is 8.2 mD (Spane et al., 2006) versus 57.4 mD calculated from the step-rate test in the KGS 1 Hanson Aggregates well (above). Average porosity calculated from the density log in the 25 m Rose Run section in the Battelle 1 AEP well is 4.1%, and average porosity is 8.5% in the 6.1 m of net sand with porosity ≥7% (as used in this study). CO2 storage capacity was calculated for the Rose Run in the Battelle 1 AEP well using the methodology of Goodman et al. (2011), with supercritical CO2 density adjusted for reservoir temperature (this study) and pressure (Lucier et al., 2006) at an average depth of 2,375 m. P50 CO2 storage capacity of the Rose Run in the Battelle 1 AEP well was 59.2 kt/km2 (290,000 short tons/mi2), or about 77% of the supercritical CO2 storage capacity of the KGS 1 Hanson Aggregates well (above).
The Rose Run in the Ohio 1 CO2 well was penetrated in the interval of 2,247–2,288 m (Wickstrom et al., 2011), depths only slightly shallower than in the Battelle 1 AEP well. The Rose Run in the Ohio 1 CO2 well is equally unsuitable as the Battelle 1 AEP well, with the same reservoir issues: depth, thin sands (Wickstrom et al., 2011), and low porosity (Figure 6). The review of the formation density log in Wickstrom et al. (2011, figure three0) shows only 5.5 m of net sand with porosity >7% in the 40.8-m Rose Run section. Analysis of 10 rotary sidewall cores from sandstones in the Rose Run interval of the Ohio 1 CO2 well yielded an average of 7.0% porosity, with a range of 3.3%–10.7%, and average permeability of 5.1 mD in a range of 0.0034–31.6 mD, respectively (Wickstrom et al., 2011). Thus, the Rose Run in the KGS 1 Hanson Aggregates well, Battelle 1 AEP well, and Ohio 1 CO2 well all lack sufficient CO2 storage capacity to support stand-alone large-volume CO2 storage (see the discussion in Bowersox et al., 2019a), but could serve as part of a stacked-storage reservoir.
This research demonstrates that the reservoir properties of the Rose Run are sufficient for it to contribute to supercritical CO2 storage in the Central Appalachian Basin, however, further modeling is needed to determine how much any future injected CO2 might migrate. Although the overlying Beekmantown has sufficient geomechanical properties and low enough porosity and permeability to bar vertical migration of CO2 injected into the Rose Run, the Rose Run in the KGS 1 Hanson Aggregates well is thin (Figures 2, 4, 6) and lies only 58 m (190 ft) below the subsurface CO2 critical depth in northeast Kentucky (Figure 10). No vertical or lateral reservoir traps are recognized updip of the KGS 1 Hanson Aggregates well. Although the CO2–brine relative permeability test suggests that nearly half of any supercritical CO2 injected into the Rose Run in the KGS 1 Hanson Aggregates well would be residually trapped, and another portion of injected CO2 would be trapped by mineral precipitation (Zhu et al., 2013), the balance of the CO2 would be mobile and migrate updip. How far and how fast CO2 migration may occur remains for additional research and reservoir modeling.
The tests of the Rose Run in the KGS 1 Hanson Aggregates well demonstrated that its reservoir properties are suitable for long-term CO2 storage and vertical confinement by the overlying Beekmantown. Reservoir properties, Rose Run and Beekmantown geomechanical properties, and injectivity tests were all favorable for using the Rose Run for CO2 storage, although there are no plans to carry out this in foreseeable future. Because the Rose Run is thin and would require a large reservoir area to have sufficient capacity to store CO2, it would only provide a CO2 storage contribution as part of a stacked-reservoir project. The lack of an updip, lateral reservoir trap, however, appears to preclude supercritical CO2 storage in the Rose Run in the northeast Kentucky evaluation region. Additional research and modeling will be necessary to determine if the Rose Run is entirely excluded from supercritical CO2 storage in the Central Appalachian Basin of northeast Kentucky.
The datasets presented in this study can be found in online repositories. The names of the repository/repositories and accession number(s) can be found at: https://kgs.uky.edu/kygeode/services/oilgas/ Record Number 14357.
JB was the principal investigator of this research and performed CO2 reservoir analyses and wrote most of the manuscript. SG was the co-principal investigator, contributed to stratigraphic and reservoir interpretations to the article. DH contributed to stratigraphic and reservoir interpretations and editorial guidance of the completed manuscript.
This research was funded by the Commonwealth of Kentucky through the Energy Independence and Incentives Act of 2007. Access to the drill site was granted by Hanson Aggregates, Grayson, Kentucky, without which this project would not have been possible. MICP testing was provided by the Indiana Geological Survey, Bloomington, Indiana.
The authors declare that the research was conducted in the absence of any commercial or financial relationships that could be construed as a potential conflict of interest.
All claims expressed in this article are solely those of the authors and do not necessarily represent those of their affiliated organizations, or those of the publisher, the editors, and the reviewers. Any product that may be evaluated in this article, or claim that may be made by its manufacturer, is not guaranteed or endorsed by the publisher.
Agarwal, R. G. (1980). “A new method to account for producing time effects when drawdown type curves are used to analyze pressure buildup and other test data,” in Society of Petroleum Engineers, paper SPE 9289, SPE Annual Technical Conference and Exhibition, Dallas, Texas, September 21–24, 13.
Agarwal, R. G. (1979). “Real gas pseudo-time” – A new function for pressure buildup analysis of MHF gas wells,” in Society of Petroleum Engineers, paper SPE 8279, SPE Annual Technical Conference and Exhibition, Las Vegas, Nevada, September 23-26, 9.
Alger, R. P., Raymer, L. L., Hoyle, W. R., and Tixier, M. P. (1963). Formation density log applications in liquid-filled holes. J. Petroleum Technol. 15, 321–332. doi:10.2118/435-pa
Battelle Memorial Institute (2015). Development of subsurface brine disposal framework in the Northern Appalachian Basin. Columbus, Ohio: Battelle Memorial Institute, Research Partnership to Secure Energy for America, 411. Final Report 11122-73.
Bourdet, D. J., Ayoub, A., and Pirard, Y. M. (1989). Use of pressure derivative in well-test interpretation. Soc. Petroleum Eng. Form. Eval. 4, 293–302. doi:10.2118/12777-PA
Bowersox, J. R., Greb, S. F., Anderson, W. H., and Harris, D. C. (2013). Assessing the CO2 storage capacity in the central Appalachian basin: Results of the Kentucky geological Survey test well, carter county, Kentucky. Geol. Soc. Am. Abstr. Programs 45 (7), 99.
Bowersox, J. R., Greb, S. F., and Harris, D. C. (2018). Geology and operational overview of the Kentucky geological Survey no. 1 Hanson Aggregates stratigraphic research well, carter county, Kentucky. Ky. Geol. Surv. Ser. 13, 30. Information Circular 1. doi:10.13023/kgs.ic1.13
Bowersox, J. R., Greb, S. F., and Harris, D. C. (2017). Porosity and CO2 storage capacity of the Maryville – Basal sandstone section in the Kentucky geological Survey 1 Hanson Aggregates stratigraphic research well, Carter county, Kentucky. Tulsa, Oklahoma: American Association of Petroleum Geologists, 1. Search and Discovery Article 90308. http://www.searchanddiscovery.com/pdfz/abstracts/pdf/2017/90308es/abstracts/ndx_bowersox.pdf.html (Accessed September 25, 2018).
Bowersox, J. R., Greb, S. F., and Harris, D. C. (2019a). Porosity and CO2 storage capacity of the Maryville – basal sandstone section (middle cambrian) southern Appalachian basin. Environ. Geosci. 26, 21–40. doi:10.1306/eg.06181818004
Bowersox, J. R., Greb, S. F., and Zhu, J. (2019b). “Geomechanical properties will constrain CO2 injection into the Lower Ordovician Rose Run Sandstone deep saline reservoir, Appalachian Basin, Kentucky, U.S.A,” in The 1st International Conference on Exploration and Utilization of Underground Space, Wuhan, China, 15–18, November 2019, 64–65. Abstract Proceedings.
Bowersox, J. R., Greb, S. F., Zhu, J., and Harris, D. C. (2021). Geomechanical properties will constrain CO2 injection into the Lower Ordovician Rose Run Sandstone deep saline reservoir, Appalachian Basin, Kentucky, U.S.A. J. Rock Mech. Geotechnical Eng. 13, 947–960. doi:10.1016/j.jrmge.2021.04.010
Brown, A. A. (2015). Interpreting permeability from mercury-injection capillary pressure data: American Association of Petroleum Geologists, 4. Search and Discovery Article #41660. http://www.searchanddiscovery.com/pdfz/documents/2015/41660brown/ndx_brown.pdf.html (Accessed April 15, 2020).
Burnside, N. M., and Naylor, M. (2014). Review and implications of relative permeability of CO2/brine systems and residual trapping of CO2. Int. J. Greenh. Gas Control 23, 1–11. doi:10.1016/j.ijggc.2014.01.013
Casey, G. D. (1996). Hydrogeologic framework of the midwestern basins and arches region in parts of Indiana. Ohio, Michigan, and Illinois: United States Geological Survey Professional Paper 1423-B, 46.
Casey, G. D. (1992). Hydrogeology of the basal confining unit of the carbonate aquifer system in the Midwestern Basins and Arches region of Indiana. Ohio, Michigan, and Illinois: United States Geological Survey, 92–489. Open-File Rept.
Comisky, J. T., Newsham, K. E., Rushing, J. A., and Blasingame, T. A. (2007). A comparative study of capillary-pressure-based empirical models for estimating absolute permeability in tight gas sands. Soc. Petroleum Eng. SPE 15, 110050. doi:10.2118/110050-MS
Deruyck, B., Ehlig-Economides, C., and Joseph, J. (1992). Testing design and analysis. Oilfield Rev. 4 (2), 28–39.
Ehlig-Economides, C. (1988). Use of the Pressure Derivative for Diagnosing Pressure-Transient Behavior. J. Petroleum Technol. 40, 1280–1282. doi:10.2118/18594-pa
Ettensohn, F. R. (1980). An alternative to barrier-shoreline model for deposition of Mississippian and Pennsylvanian rocks in northeastern Kentucky: summary. Geol. Soc. Am. Bull. 91, 130–135. doi:10.1130/GSAB-P2-91-934
Freund, P., Bachu, S., Simbeck, D., Thambimuthu, K., and Gupta, M. (2005). “Properties of CO2 and carbon base fuels,” in IPCC special report on carbon dioxide capture and storage, prepared by working Group III of the intergovernmental panel on climate change, annex I. Editors B. Metz (Cambridge, U.K., and New York, New York: Cambridge University Press), 383–399.
Goodman, A., Hakala, A., Bromhal, G., Deel, D., Rodosta, T., Frailey, S., et al. (2011). U.S. DOE methodology for the development of geologic storage potential for carbon dioxide at the national and regional scale. Int. J. Greenh. Gas Control 5, 952–965. doi:10.1016/j.ijggc.2011.03.010
Greb, S. F., and Anderson, W. (2010). Geologic criteria for eastern Kentucky permanent CO2 storage (saline reservoir test). Available at: https://www.uky.edu/KGS/kyccs/ppt/080110_greb_eky.pdf (Accessed November 30, 2021).
Greb, S. F., Bowersox, J. R., and Harris, D. C. (2017). Analysis of the conasauga Group and basal sandstone (U. Cambrian) in the KGS No. 1 Hanson Aggregates well, Carter county, Kentucky. Tulsa, Oklahoma: American Association of Petroleum Geologists. Search and Discovery Article #90308. http://www.searchanddiscovery.com/abstracts/pdf/2017/90308es/abstracts/ndx_greb02.pdf (Accessed September 25, 2018).
Greb, S. F., Bowersox, J. R., Solis, M. P., Harris, D. C., Riley, R. A., Rupp, J. A., et al. (2012). “Ordovician Knox carbonates and sandstones of the eastern mid-continent: Potential geologic carbon storage reservoirs and seals,” in The great American carbonate bank: The geology and economic resources of the cambrian-ordovician sauk megasequence of laurentia. Editors J. R. Derby, R. D. Fritz, S. A. Longacre, W. A. Morgan, and C. A. Sternbach (Tulsa, OklahomaMemoir: American Association of Petroleum Geologists), 98, 1077–1101.
Greb, S. F., Harris, D. C., Solis, M. P., Anderson, W. H., Drahovzal, J. A., Nuttall, B. C., et al. (2009). “Cambrian-Ordovician Knox carbonate section as integrated reservoirs and seals for carbon sequestration in the eastern mid-continent United States,” in Carbon dioxide sequestration in geological media-State of the science. Editors M. Grobe, J. C. Pashin, and R. L. Dodge (Tulsa, Oklahoma: American Association of Petroleum Geologists, Studies in Geology), 59, 241–259.
Greb, S. F., and Solis, M. P. (2010). “Geologic carbon storage (sequestration) potential in Kentucky,” in Evaluation of geologic CO2 sequestration potential and CO2 enhanced oil recovery in Kentucky: Kentucky geological Survey, series 12, report of investigation. Editors T. M. Parris, S. F. Greb, and B. C. Nuttall, 21, 55–212.
Gupta, N. (2006). Capture and geologic storage of carbon dioxide in deep saline formations: CTCI Foundation, Taipei, Taiwan, Taiwan CO2 Sequestration Seminar, Available at: http://www.ctci.org.tw/public/Attachment/911013562478.pdf (Accessed September 05, 2017).
Gupta, N. (2008b). Final topical report, the Ohio River Valley CO2 storage project, AEP Mountaineer Plant, West Virginia, numerical simulation and risk assessment report. Columbus, Ohio: Battelle Memorial Institute, 105.
Gupta, N., Jagucki, P., Sminchak, J., Sass, B., Bacon, D., and Meggyesy, D. (2006). “Mountaineer project: Lessons learned and implications for regional and local storage potential and path forward in the Appalachian Basin,” in 5th Annual Conference on Carbon Capture and Storage. Available at: http://www.netl.doe.gov/publications/proceedings/06/carbon-seq/Tech%20Session%20175.pdf, Accessed 18 November 2009. .
Gupta, N. (2008a). The Ohio River Valley CO2 storage project, AEP Mountaineer Plant, West Virginia, final technical report. Columbus, Ohio: Battelle Memorial Institute, 39.
Harstock, J. H., and Warren, J. E. (1961). The effect of horizontal hydraulic fracturing on well performance. J. Petroleum Technol. 13, 1050–1056. doi:10.2118/61-pa
Hassanzadeh, H., Pooladi-Darvish, M., Elsharkawy, A. M., Keith, D. W., and Leonenko, Y. (2008). Predicting PVT data for CO2–brine mixtures for black-oil simulation of CO2 geological storage. Int. J. Greenh. Gas Control 2, 65–77. doi:10.1016/s1750-5836(07)00010-2
Heald, M. T., and Baker, G. F. (1977). Diagenesis of the Mt. Simon and Rose Run sandstones in Western West Virginia and southern Ohio. J. Sediment. Res. 47 (1), 66–77. doi:10.1306/212F70F4-2B24-11D7-8648000102C1865D
Horner, D. R. (1951). Pressure build-up in wells: Proceedings of the third world petroleum conference, the hague, session II. Leiden, Netherlands: E.J. Brill, 503–523.
Hovorka, S. D. (2013). CCU&S via stacked storage — case studies from CO2. Energy Procedia 37, 5166–5171. doi:10.1016/j.egypro.2013.06.432
Lucier, A., and Zoback, M. (2008). Assessing the economic feasibility of regional deep saline aquifer CO2 injection and storage: a geomechanics-based workflow applied to the Rose Run sandstone in eastern Ohio, USA. Int. J. Greenh. Gas Control 2, 230–247. doi:10.1016/j.ijggc.2007.12.002
Lucier, A., Zoback, M., Gupta, N., and Ramakrishnan, T. S. (2006). Geomechanical aspects of CO2 sequestration in a deep saline reservoir in the Ohio River Valley region. Environ. Geosci. 13 (2), 85–103. doi:10.1306/eg.11230505010
Matthews, C. S., and Russell, D. G. (1967). Pressure buildup and flow tests in wells. Dallas, Texas: Society of Petroleum Engineers of the American Institute of Mining, Metallurgical, and Petroleum Engineers, 163. Monograph Series.
Medina, C. R., Rupp, J. A., and Barnes, D. A. (2011). Effects of reduction in porosity and permeability with depth on storage capacity and injectivity in deep saline aquifers: a case study from the Mount Simon Sandstone aquifer. Int. J. Greenh. Gas Control 5, 146–156. doi:10.1016/j.ijggc.2010.03.001
Olson, R. K., and Grigg, M. W. (2008). Mercury-injection capillary pressure (MICP): A useful tool for improved understanding of porosity and matrix permeability distributions in shale reservoirs. Tulsa, Oklahoma: American Association of Petroleum Geologists. Search and Discovery Article 40322. https://www.searchanddiscovery.com/pdfz/documents/2008/08132olson/ndx_olson.pdf.html (Accessed May 12, 2020).
Peace Software (2017). Calculation of thermodynamic state variables of carbon dioxide. Peace Software. Available at: http://www.peacesoftware.de/einigewerte/co2_e.html (Accessed March 21, 2017).
Raziperchikolaee, S., Kelley, M., and Gupta, N. (2019). A screening framework study to evaluate CO2 storage performance in single and stacked caprock-reservoir systems of the Northern Appalachian Basin. Greenh. Gas. Sci. Technol. 9, 582–605. doi:10.1002/ghg.1873
Rike, W. M. (1992). “Common hydrocarbon traps in the Rose Run Sandstone: Columbus, Ohio, Ohio Oil & Gas Association,” in 1992 Ohio Oil & Gas Association Winter Meeting, Columbus, Ohio, March 11, 1992, 13.
Riley, R. A. (1992). “Geological and geophysical analysis of the reservoir heterogeneity for a Rose Run/Beekmantown (Cambrian-Ordovician) well in Coshocton County, Ohio: Columbus, Ohio, Ohio Oil & Gas Association,” in 1992 Ohio Oil & Gas Association Winter Meeting, Columbus, Ohio, March 11, 1992, 8.
Riley, R. A., Harper, J. A., Baranoski, M. T., Laughrey, C. D., and Carlton, R. W. (1993). Measuring and predicting reservoir heterogeneity in complex deposystems: The Late Cambrian Rose Run sandstone of eastern Ohio and Western Pennsylvania. Washington, DC: U.S. Department of Energy, 257. contract DE-AC22-90BC14657.
Riley, R. A. (1994). Oil and gas exploration in the Rose Run sandstone: Ohio geology. Columbus, Ohio: Ohio Department of Natural Resources, Division of Geological Survey, 3–5.
Riley, R. A., Wicks, J., and Thomas, J. (2002). Cambrian-Ordovician Knox production in Ohio: three case studies of structural-stratigraphic traps. AAPG Bull. 89, 539–555. doi:10.1306/61EEDB3E-173E-11D7-8645000102C1865D
Root, S., and Onasch, C. M. (1999). Structure and tectonic evolution of the transitional region between the central Appalachian foreland and interior cratonic basins. Tectonophysics 305, 205–223. doi:10.1016/s0040-1951(99)00022-0
Schlumberger (1987). Log interpretation principles/applications. Houston, Texas: Schlumberger Educational Services, 198.
Schlumberger (1972). Log interpretation, volume I – principles. New York, NY: Schlumberger Ltd., 112.
Sminchak, J., Gupta, N., and Gerst, J. (2009). Well test results and reservoir performance for a carbon dioxide injection test in the Bass Islands Dolomite in the Michigan Basin. Environ. Geosci. 16, 153–162. doi:10.1306/eg.04080909001
Sneider, J. S., and Bolger, G. W. (2008). Understanding porosity and permeability using high-pressure MICP data: insights into hydrocarbon recovery: American Association of Petroleum Geologists, 66. Search and Discovery Article #40345. http://www.searchanddiscovery.com/pdfz/documents/2008/08146sneider/ndx_sneider.pdf.html (Accessed April 18, 2016).
Spane, F. A., Thorne, P. D., Gupta, N., Jagucki, P., Ramakrishnan, T. S., and Mueller, N. (2006). Results from reconnaissance-level and detailed reservoir characterization methods utilized for determining hydraulic property distribution characteristics at Mountaineer AEP #1. Berkeley, California: Lawrence Berkeley National Laboratory, 149–153. Proceedings, CO2SC Symposium, March 20–22.
Spycher, N., Preuss, K., and Ennis-King, J. (2003). CO2–H2O mixtures in the geological sequestration of CO2. I. Assessment and calculation of mutual solubilities from 12 to 100° C and up to 600 bar. Geochimica Cosmochimica Acta 67, 3015–3031. doi:10.1016/s0016-7037(03)00273-4
Takacs, K. G., Nuttall, B. C., and Parris, T. M. (2010). Assessment of Kentucky fields for CO2-enhanced oil recovery: Kentucky geological Survey, series 12, report of investigation 21. Lexington, Kentucky: Kentucky Geological Survey, 15–36.
United States Department of Energy, Office of Fossil Energy, National Energy Technology Laboratory (2015). Carbon sequestration atlas of the United States and Canada. 5th ed. U.S. Department of Energy, Office of Fossil Energy, 113.
van Everdingen, A. F. (1953). The skin effect and its influence on the productive capacity of a well. J. Petroleum Technol. 198, 171–176. doi:10.2118/203-g
Venteris, E. R., Riley, R. R., McDonald, J., Wickstrom, L. H., Drahovzal, J. A., and Harper, J. A. (2009). “Establishing a regional geologic framework for carbon dioxide sequestration planning: A case study,” in Carbon dioxide sequestration in geological media – state of the science: American association of petroleum geologists, studies in geology. Editors M. Grobe, J. C. Pashin, and R. L. Dodge, 59, 191–225.
Wickstrom, L. H., Riley, R. A., Spane, F. A., McDonald, J., Slucher, E. R., Baranoski, M. T., et al. (2011). Geologic assessment of the Ohio geological Survey CO2 No. 1 well in Tuscarawas county and surrounding vicinity. Columbus, Ohio: Ohio Department of Natural Resources, Division of Geological Survey, 82–635. Open-File Report 2011-3.
Wickstrom, L. H., Venteris, E. R., Harper, J. A., McDonald, J., Slucher, E. R., Carter, K. M., et al. (2010). Characterization of geologic sequestration opportunities in the MRCSP region. Columbus, Ohio: Ohio Department of Natural Resources. Division of Geological Survey, Open-File Report 2005-1.
Wickstrom, L. H., Venteris, E. R., Harper, J. A., McDonald, J., Slucher, E. R., Carter, K. M., et al. (2005). Characterization of geologic sequestration opportunities in the Midwest Regional Carbon Sequestration Partnership region, 152. Report submitted to the U.S. Department of Energy, Cooperative Agreement No. DE-PS26-05NT42255. http://216.109.210.162/userdata/mrcsp_report_geo.pdf (Accessed July 17, 2019).
Woodward, H. P. (1961). Preliminary subsurface study of southeastern Appalachian interior plateau. Am. Assoc. Petroleum Geol. Bull. 45, 1635–1655. doi:10.1306/BC743715-16BE-11D7-8645000102C1865D
Zerai, B., Saylor, B. Z., and Matisoff, G. (2006). Computer simulation of CO2 trapped through mineral precipitation in the Rose Run Sandstone, Ohio. Appl. Geochem. 21, 223–240. doi:10.1016/j.apgeochem.2005.11.002
Keywords: Rose Run Sandstone, step-rate test, CO2 storage, Knox Group, Appalachian Basin
Citation: Bowersox JR, Greb SF and Harris DC (2022) Reservoir properties and CO2 storage capacity of the Rose Run Sandstone (Lower Ordovician, Knox Group) in the Central Appalachian Basin, northeast Kentucky. Front. Energy Res. 10:832969. doi: 10.3389/fenrg.2022.832969
Received: 10 December 2021; Accepted: 26 August 2022;
Published: 23 September 2022.
Edited by:
Priyank Jaiswal, Oklahoma State University, United StatesReviewed by:
Ning Wei, Institute of Rock and Soil Mechanicss (CAS), ChinaCopyright © 2022 Bowersox, Greb and Harris. This is an open-access article distributed under the terms of the Creative Commons Attribution License (CC BY). The use, distribution or reproduction in other forums is permitted, provided the original author(s) and the copyright owner(s) are credited and that the original publication in this journal is cited, in accordance with accepted academic practice. No use, distribution or reproduction is permitted which does not comply with these terms.
*Correspondence: J. Richard Bowersox, ai5yLmJvd2Vyc294QHVreS5lZHU=
†These authors share first authorship
Disclaimer: All claims expressed in this article are solely those of the authors and do not necessarily represent those of their affiliated organizations, or those of the publisher, the editors and the reviewers. Any product that may be evaluated in this article or claim that may be made by its manufacturer is not guaranteed or endorsed by the publisher.
Research integrity at Frontiers

Learn more about the work of our research integrity team to safeguard the quality of each article we publish.