 Anzhao Ji
 Zhanjun Chen1
95% of researchers rate our articles as excellent or good
Learn more about the work of our research integrity team to safeguard the quality of each article we publish.
Find out more
ORIGINAL RESEARCH article
Front. Energy Res. , 25 February 2022
Sec. Advanced Clean Fuel Technologies
Volume 10 - 2022 | https://doi.org/10.3389/fenrg.2022.829914
This article is part of the Research Topic Cleaner Treatment Technologies and Productions in The Energy Industry View all 24 articles
Coalbed methane (CBM) is one of the important unconventional oil and gas resources. Since the permeability of the CBM reservoir is very low, CBM is usually developed by hydraulic fracturing technology to enhance gas productivity. In fact, most of the wells are not at the center of the columnar CBM reservoirs, which leads to different wellbore pressure responses. It is meaningful to analyze the wellbore pressure response of the off-center fractured vertical wells with asymmetrical fracture. The adsorption-desorption, fracture asymmetry are considered and a semi-analytical mathematical model is established. The pressure wellbore solution of the Laplace domain can be obtained by Laplace transformation, model coupling, and Gauss elimination. Then, the Stehfest numerical inversion is employed to obtain the pressure solution and rate distribution in the real-time domain. This semi-analytical solution is verified; the results show that the wellbore pressure includes six flow regimes, which include bilinear flow, linear flow, elliptic flow, radial flow, arc boundary reflection, and boundary dominated flow regime. The influence of fracture angle, dimensionless conductivity, and off-center distance on wellbore pressure and rate distribution are discussed in detail.
Owing to the complicated seepage mechanism of CBM, CBM is classified as an unconventional natural gas resource. As one of the vital unconventional resources, development of CBM has been a global concern. The gas is stored in coal beds and there are many natural fractures in CBM reservoirs, which provide the seepage channels for gas flow (Zuber and Kuuskraa, 1990; Aminian and Ameri, 2009). Since the permeability of the CBM reservoir is very low, hydraulic fracturing measures are employed to enhance the production of coalbed methane. The complexity of formation conditions leads to the hydraulic fracture being asymmetric to the wellbore. Pressure transient analysis is an important approach for reservoir evaluation and production performance prediction. Therefore, we can diagnose whether the well is in the center of the reservoir and calculate the distance from the well to the center of the reservoir by pressure transient analysis.
The main component of CBM is methane. CBM reservoirs consist of matrix and natural fractures systems, and there are many small-diameter pores in coal matrix particles. The transport of CBM includes the desorptionand diffusion of CBM in small-diameter pores, and flow through a network of natural fractures (Liu et al., 2020; Nie et al., 2012; Pillalamarry et al., 2011; H.; Wang et al., 2021). However, the above-cited research mainly focuses on micro seepage. There is no research on the unsteady seepage of wellbore pressure in CBM, which cannot evaluate pressure wave propagation directly.
Hydraulic fracturing technology is often used to enhance the production of CBM. Many scholars have carried out research on the unsteady flow theory of vertically fractured wells (Cinco-Ley and Meng, 1988; Huang et al., 2015; Wang and Wang, 2014; L.; Wang et al., 2012). Cinco-Ley and Meng, (1988) presented the approach to couple the hydraulic fracture model and surface source solution firstly, then Huang et al. (2015) and presented an analytical model of a vertically fractured well to stimulate the relationship between wellbore pressure and production time. However, their works assumed that the fractures are symmetrical around the wellbore, which is not consistent with the reality.
In practice, the complexity of the conditions of the reservoir leads to hydraulic fracture being asymmetric around the wellbore. Some scholars simulated wellbore pressure transient response via numerical simulation (Bennett et al., 1983; Berumen et al., 2000; Crawford and Landrum, 1955; Narasimhan and Palen, 1979) and semi-analytical approach (Rodriguez et al., 1992; Tiab et al., 2010; Wang et al., 2019; Wang et al., 2013; Wang and Wang, 2014; Wang and Xue, 2018; Zhao et al., 2019). Crawford and Landrum (1955) firstly introduced a fracture asymmetry mathematical model but meaningful conclusions could not be drawn. Bennett et al. (1983) discussed the influence of the asymmetrical fracture on the rate decline curve by the numerical simulation methods. Wellbore pressure response curve under the condition of constant rate is analyzed by employing the numerical simulation methods (Berumen et al., 2000; Narasimhan and Palen, 1979). Their results showed that fracture asymmetry has an obvious influence on the wellbore pressure curve during the bilinear flow regime. Since the numerical solution is low efficiency and accuracy, some scholars introduced the analytical and semi-analytical approaches to obtain the wellbore pressure. Rodriguez et al. (1992) and Tiab et al. (2010) introduced the analytical method of vertical well with asymmetric hydraulic fracture firstly, but their model only gives the pressure solution of the hydraulic fracture. In order to couple the hydraulic fracture model and reservoirs model, (Wang et al., 2013, 2014, 2018, 2019) introduced the fracture Green’s function and coupled the hydraulic fracture and reservoirs model. Finally, a wellbore pressure curve during the whole flow regime is obtained. Zhao et al. (2019) analyzed the wellbore pressure curve of fractured wells with asymmetric fractures by combining the boundary element method and source function. Although they had carried out a lot of research on the wellbore pressure response of fractured wells with asymmetric fractures, their models assumed that vertical well is the center of the CBM reservoirs.
Assuming the well is the center of the reservoir is an ideal model. Based on an “equivalent well block radius,” Peaceman (1990) presented the simulation method of an off-center well by reservoir numerical simulation. Rosa et al. (1996) presented the off-center vertical well analytical model of radial composite reservoirs with an internal circular discontinuity. However, their research object is vertical wells. Deng et al. (2017) presented the semi-analytical model of the off-center vertical fractured well with a bi-wing symmetrical fracture in a multi-region heterogeneous reservoir to analyze the wellbore pressure behavior. Zhao et al. (2017) presented the semi-analytical solution of the off-center vertical fractured well with bi-wing symmetrical fracture by combining the boundary element method and source function. Although they were given the semi-analytical solution of hydraulic fractured well, their model assumed that the fracture is symmetrical about the wellbore.
Based on the above literature and research, there is no research about off-center fractured vertical wells with an asymmetrical fracture in columnar coalbed methane. In fact, for columnar gas reservoirs with circlar closed boundaries, wellbore is not often the center of circle closed reservoirs and the bi-wing of hydraulic fracture is unequal length because of the influence of reservoir anisotropy. Therefore, the major work of this paper can be summarized as follows.
• An efficient semi-analytical mathematical model of off-center fractured well with an asymmetrical fracture is established and solved.
• Wellbore pressure characteristics curve is discussed and verified with numerical solution.
• The influence of key parameters on wellbore pressure and rate distribution curve is discussed.
Firstly, some assumptions are made and a physical model schematic diagram is shown. Secondly, the governing equations of the 2D CBM reservoirs model and 1D hydraulic fracture are established and solved. Thirdly, discretizing fracture as many small segments, and pressure drop superposition is used to obtain the relationship between wellbore pressure and time. Finally, the influence of some parameters on wellbore pressure and rate distribution curve is analyzed.
The CBM reservoirs are composed of matrix and natural fracture systems and natural fracture is the main seepage channel to connect with hydraulic fracture. The wellbore is not the center of the CBM reservoir, and hydraulic fracture is asymmetric towards the wellbore (Figure 1). Desorption and diffusion in the matrix are considered. Some basic assumptions are given as follows:
• The gas well product by constant rate qsc.
• The distance from the wellbore to the gas reservoir center is ro.
• There is an angle, θF, between fracture and horizontal direction.
• The two wings of fracture are not equal and the distance from the wellbore to the hydraulic fracture center is xasym.
• The gas flow obeys isothermal Darcy seepage in hydraulic fracture and reservoirs.
• The desorption of adsorbed gas in the coal matrix can be described by Langmuir’s isothermal adsorption (Figure 2).
• The outer boundary of the reservoir is a circle closed.
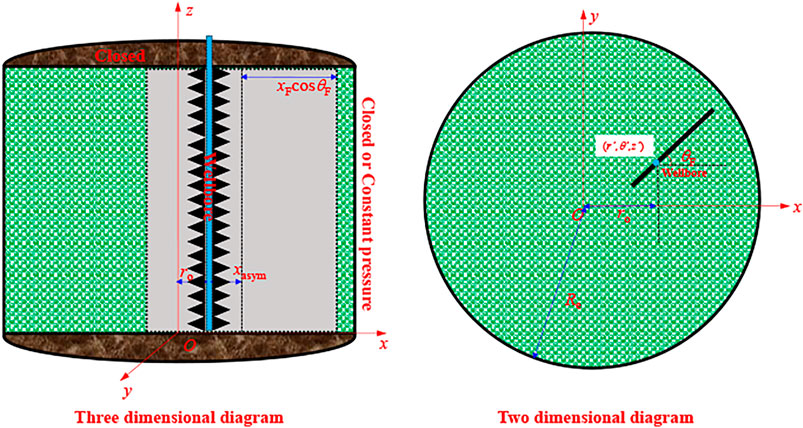
FIGURE 1. Schematic diagram of off-centered fractured well with asymmetric fracture.
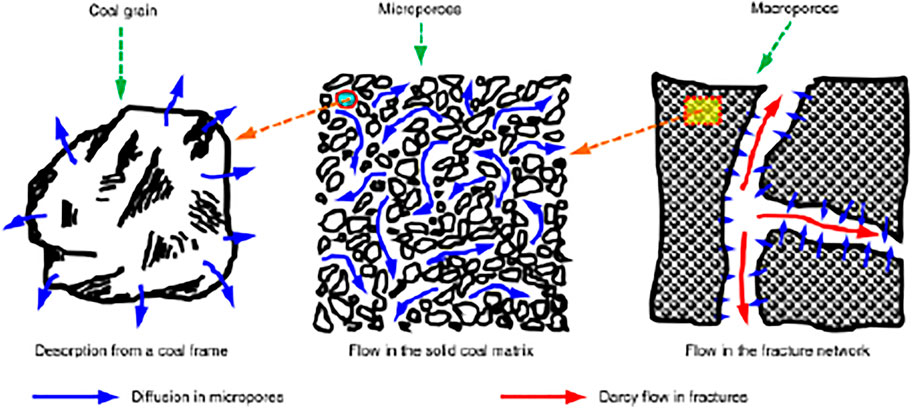
FIGURE 2. Schematic diagram of microflow mechanism of coalbed methane (Zhao et al., 2016).
Langmuir’s isothermal adsorption equation is (Langmuir, 1917; Chen et al., 2016; Zhao et al., 2016; Xu et al., 2020).
Where: VL is Langmuir volume, sm3/m3; pL is Langmuir pressure, Pa; p is Reservoirs pressure, Pa; V is Shale gas adsorption volume, sm3/m3.
In order to find the linear governing equation, pseudo-pressure is defined as:
Where: μ is CBM viscosity, cp.; Z is gas deviation factor, dimensionless; ψ is pseudo-pressure, Pa/s.
For the convenience of mathematical model solving, the following dimensionless variable definition is given in Table 1.

TABLE 1. dimensionless variable definition.
Where: r is the radial distance in x-y plane, m; h is reservoirs thickness, m; Tsc is temperature under standard conditions, K; T is reservoirs temperature, K; psc is pressure under standard conditions, Pa; ϕm is matrix porosity, decimal; ϕf is natural fracture porosity, decimal; Cmt is matrix system compressibility coefficient, Pa−1; Cft is natural fracture system compressibility coefficient, Pa−1; CFD is Dimensionless fracture conductivity, dimensionless; μ is the CBM viscosity, cp;
In cylindrical coordinate system r-θ-z, the location of the line source is assumed to be (r’,θ′,z’). According to the work of Guo et al. (2016) and Xu et al. (2020), he two-dimension governing equation in the radial cylindrical system (Ozkan, 1994; Deng et al., 2017) is
Where:
Where: r’ is the distance from linear source to the center of reservoir, m; θ’ is the angle from linear source to the center of reservoir, degree; βm is matrix apparent permeability coefficient, dimensionless; σ is adsorption gas desorption coefficient, dimensionless.
The general solution of Eq. 3 is (Ozkan, 1994).
Where: P is a center linear source solution of coal gas reservoirs, this solution can be obtained easily. E is chosen such that P + E satisfies the boundary condition at r = Re and the contribution of E to the flux vanishes as
The position relationship between the calculation point and the vertical line source is shown in Figure 3.
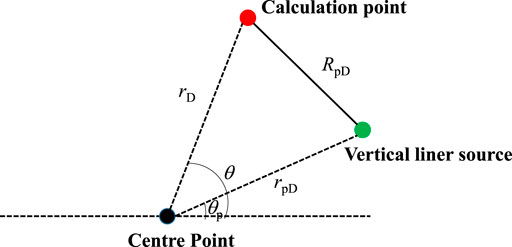
FIGURE 3. The relationship between calculation point and source.
According to the previous research work, the center linear source solution P is (Ozkan and Raghavan, 1991)
Where:
According to the addition theorem of the Bessel function (Carslaw and Jaeger, 1959)
Where: Ik(x) is the k order first type Bessel function; Kk(x) is the k order second type Bessel function.
Therefore, E can be written as
Finally, when the vertical linear source is not the center of coal gas reservoirs, the general solution can be written as:
For circle closed boundary.
For circle constant-pressure boundary.
Substituting Eq. 9 into Eqs 10, 11, coefficient Dk (k = 0, 1, 2, … ,∞) can be obtained for circle closed and constant-pressure boundary.
Substituting Eq. 12 into Eq. 9 and using with the dimensionless variable definition in Table 1. The linear source is integrated along the fracture direction and a uniform flux surface source solution can be obtained.
However, integration of Eq. 13 is very difficult directly. Therefore, according to the triangle similarity and Pythagorean law, there is the following mathematical relationship.
Where: θF is the angle between hydraulic fracture and horizontal line, degree.
In order to improve the calculation speed and accuracy, the grid needs to be divided into unequal distances (Figure 4). Dividing the hydraulic fracture into 2N segments, and the segment numbers of wellbore left fracture and wellbore right fracture is set as N.
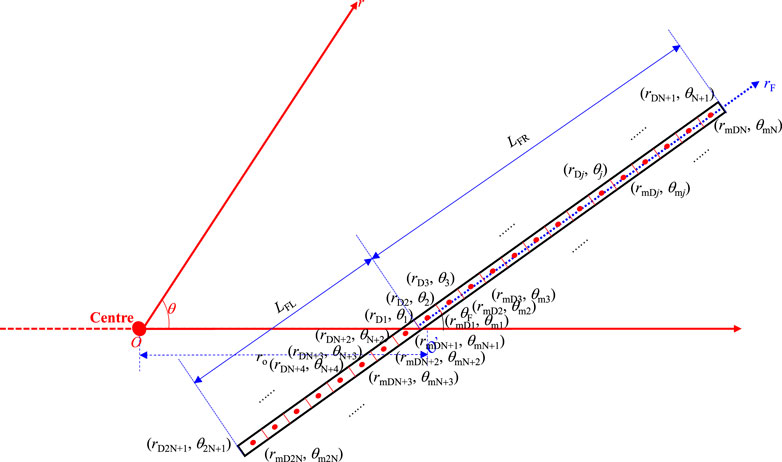
FIGURE 4. Fracture dispersion diagram.
The grid end-point coordinates can be expressed as in local coordinate system (rF-θ)
Where: LFRD is the dimensionless right fracture length; LFLD is the dimensionless left fracture length; N is the fracture segments number. rFDi is the i-th segment end-point in the local coordinate system.
The grid mid-point coordinates can be expressed as local coordinate system (rF-θ)
Where: rmFDi is the i-th segment mid-point in the local coordinate system.
The grid end-point coordinates can be expressed as in coordinate system (r-θ)
The grid mid-point coordinates can be expressed as in coordinate system (r-θ)
Where: rmDi is the i-th segment mid-point in r-θ coordinate system; rDi is the i-th segment end-point in r-θ coordinate system. θmi is the i-th segment mid-point degree in r-θ coordinate system; θi is the i-th segment end-point degree in r-θ coordinate system.
However, the pressure drop of the i-th segment is.
Where:
Wellbore pressure of the off-center vertical fractured well with asymmetric infinite conductivity fracture can be written as.
Where: M is the fracture number.
The fluid flow of fracture is only considered as linear flow. The two wing lengths of hydraulic fracture are unequal. Fracture tips have no fluid supplement. According to the work of Wang (Wang and Wang, 2014), the solution of hydraulic fracture can be written as:
Where:
The left term of Eq. 21 is the wellbore pressure of infinite conductivity fracture and it can be replaced by Eq. 20. Therefore, the discrete linear equations of Eq. 21 can be written as
In addition, according to the mass conservation.
Where: s is the Laplace variable.
Combining with Eqs 22, 23, the 2N + 1 linear equation can be obtained and solved by the Gauss elimination method. However, Wellbore pressure still cannot be obtained. Taking surface flux and average pressure into Eq. 21 and letting the rFD = xasymD, the wellbore pressure of off-center vertical well with asymmetric finite conductivity fracture can be obtained.
Wellbore pressure skin effect and wellbore storage are calculated by Eq. 24 (Van Everdingen and Hurst, 1949).
Where: CD is dimensionless well storage; S is the skin,
The model of this paper can be verified by comparing it with a numerical solution. If xasymD = 0,
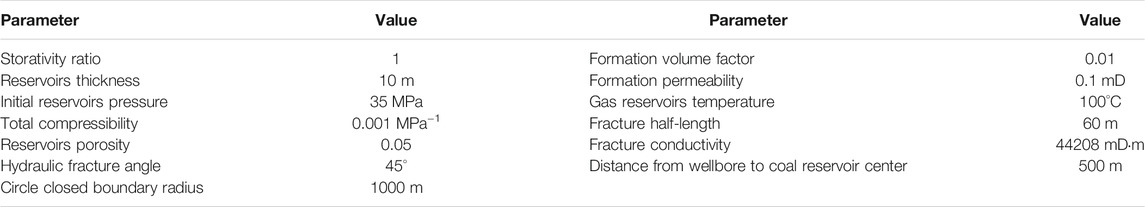
TABLE 2. Model verification basic parameter.
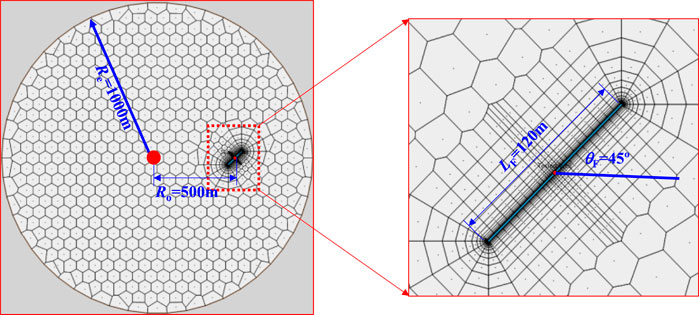
FIGURE 5. Wellbore pressure comparison curves.
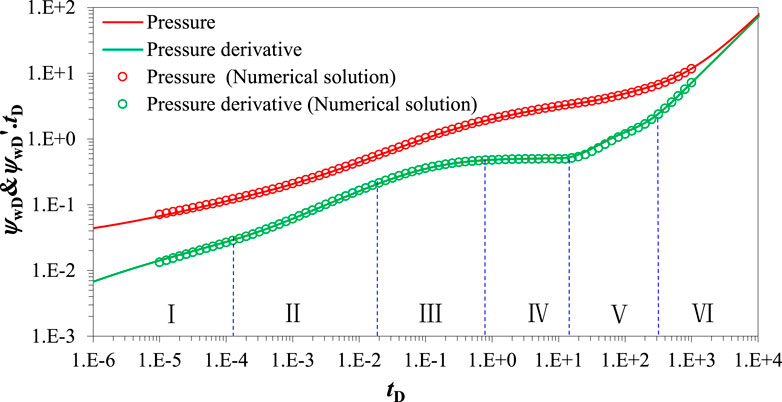
FIGURE 6. Numerical physical model of the off-center fractured well.
Points on Figure 6 represent the numerical results by the Saphir, the solid line represents the results of the semi-analytical solution of this paper. It can be seen from Figure 6 that the numerical solution and the semi-analytical solution are matched well. According to the pressure derivative curve, the six flow regimes are distinguished. The pressure derivative curve characteristic of every flow regime is shown in Table 3.
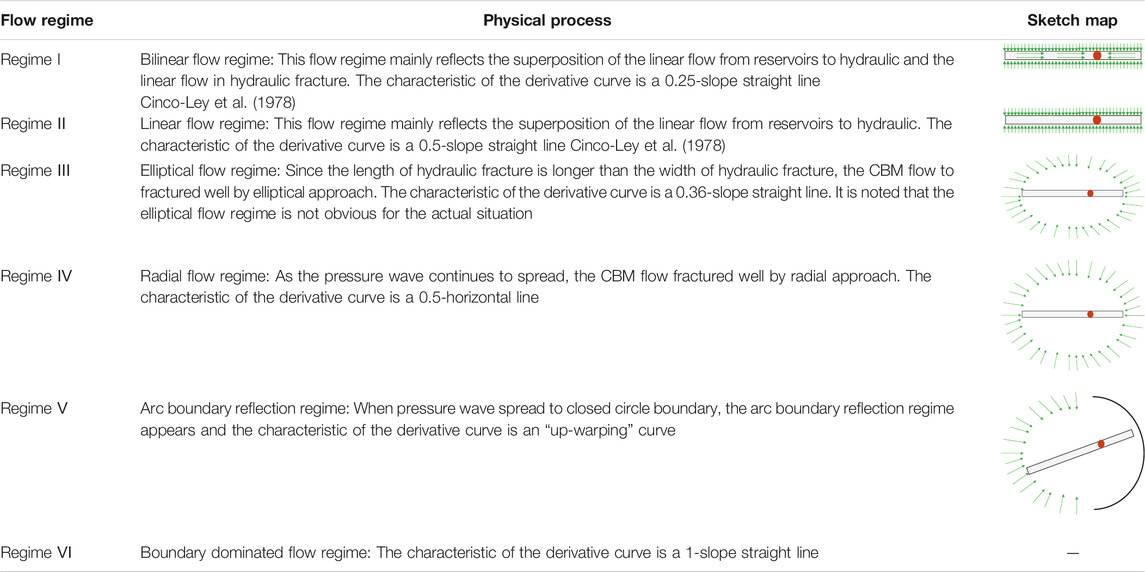
TABLE 3. Flowing regime and characteristic of derivative curve.
According to the file data analysis result, the basic parameter is given under every figure. Based on these basic parameters, we can analyze the influence of every parameter on wellbore pressure and rate distribution.
Figure 7 displays the wellbore pressure curve is affected by dimensionless conductivity. The dimensionless conductivity has an obvious influence on wellbore pressure during the linear and bilinear regimes. Large dimensionless conductivity indicates small seepage resistance in hydraulic fracture. Therefore, the larger dimensionless conductivity is the smaller dimensionless wellbore pressure during bilinear and linear flow regime is. Therefore, in the actual fracturing process, it is helpful for improving the production of the CBM wells to increase the fracture conductivity.
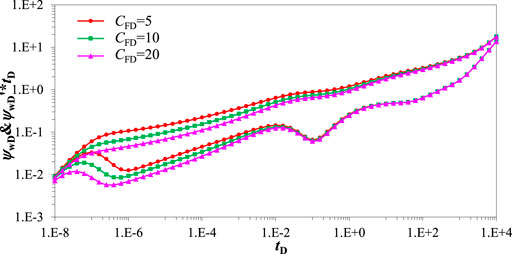
FIGURE 7. Pressure transient response curve effected by dimensionless conductivity. (CD = 1e-5, S = 0.01, xasymD = 0.3, LF = 150 m, θF = 90o, Re = 3000 m, ro = 2000 m, ω = 0.1, λ = 1,σ = 0.7,βm = 3).
Figure 8 displays the rate distribution curve is influenced by dimensionless conductivity. The solid line represents the rate distribution of short fracture and the dots lines represent the rate distribution of the long fracture. The dimensionless conductivity has an obvious influence on rate distribution. Since hydraulic fracture is asymmetric about wellbore, pressure wave around the short fracture wing spreads to reservoir quickly, so rate contribution of short fracture wing is higher than that of length fracture wing during while flow regime. However, as time progresses, since the control radius of short fracture wing is smaller than that of long fracture wing, rate contribution of short fracture wing decreases and rate contribution of long fracture wing increases with time increasing before linear flow regime. Rate contribution of short and long fracture wing keep an approximate constant. Therefore, the large dimensionless conductivity leads to a small rate of short fracture wing and a large of long fracture wing in the whole flow regime.
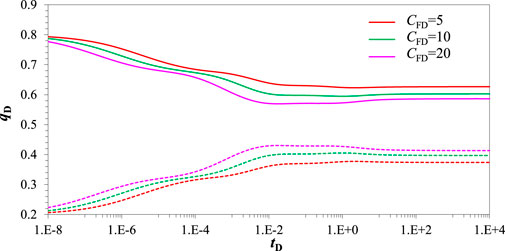
FIGURE 8. Rate distribution curve effected by dimensionless conductivity. (CD = 1e-5, S = 0.01, xasymD = 0.3, LF = 150 m, θF = 90o, Re = 3000 m, ro = 2000 m, ω = 0.1, λ = 1, σ = 0.7, βm = 3).
Figure 9 displays the wellbore pressure curve is affected by the off-center distance. As is shown in Figure 9, the off-center distance has an obvious effect on wellbore pressure during the arc boundary reflection regime. The larger off-center distance indicates that the well is closed to the circle closed boundary. Pressure waves propagate quickly to the boundary and boundary reaction characteristics appear in advance, which leads to the obvious “upwarping” characteristic of the derivative curve. Therefore, the larger the off-center distance is, the earlier the time of the arc boundary reflection regime and derivative curve “upwarping” is.
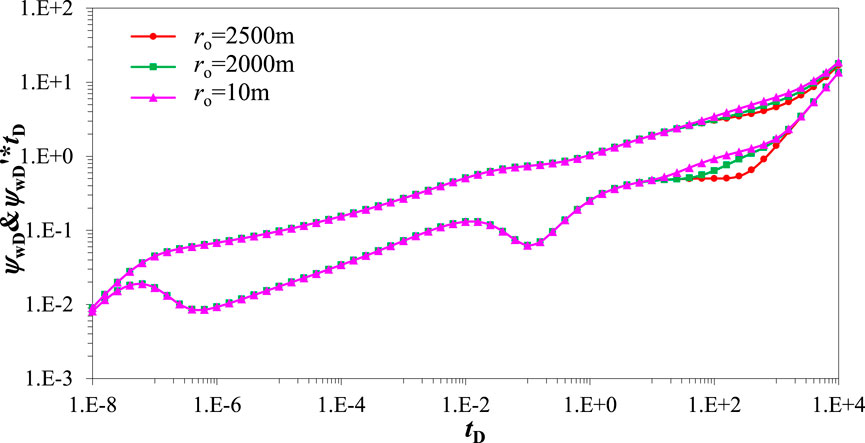
FIGURE 9. Pressure transient response curve effected by the off-center distance. (CD = 1e-5, S = 0.01, xasymD = 0.3, LF = 150 m, θF = 90o, CFD = 10, Re = 3000 m, ω = 0.1, λ = 1,σ = 0.7,βm = 3).
Figure 10 displays that the wellbore pressure curve is affected by the asymmetry factor. The asymmetry factor has an obvious effect on wellbore pressure during bilinear and linear flow regimes. It is assumed that the fracture length is equal for different asymmetry factors. The larger asymmetry factor indicates that the wellbore is closed to the fracture end-point, which leads that the fluid flows time longer in the long fracture. Therefore, the larger asymmetry factor leads to the larger seepage resistance. That is to say, the larger the asymmetry factor is, the higher of pressure and derivative curve before the radial flow regime is.
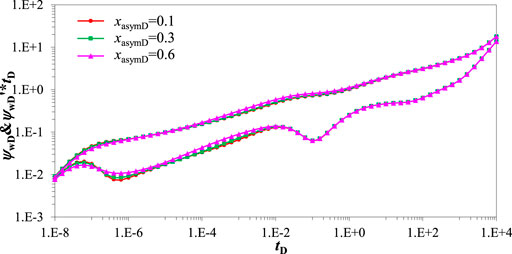
FIGURE 10. Pressure transient response curve effected by asymmetry factor. (CD = 1e-5, S = 0.01, LF = 150 m, θF = 90o, CFD = 10, Re = 3000 m, ro = 2000 m, ω = 0.1, λ = 1,σ = 0.7,βm = 3).
Figure 11 displays how the rate distribution curve is affected by the asymmetry factor. The solid line represents the rate distribution of the short fracture and the dots lines represent the rate distribution of the long fracture. The asymmetry factor has an obvious influence on rate distribution. Since hydraulic fracture is asymmetric about wellbore, pressure wave around the short fracture wing spread to reservoir quickly, so rate contribution of short fracture wing is higher than that of length fracture wing during while flow regime. However, as time progresses, since the control radius of the short fracture wing is smaller than that of the long fracture wing, the rate contribution of the short fracture wing decreases and the rate contribution of the long fracture wing increase with time increasing before linear flow regime. For shorter fracture wing, the larger asymmetry factor leads to a larger pressure drop between the wellbore and hydraulic fracture surface. Therefore, the larger asymmetry factor indicates a larger rate contribution of the short wing. On the contrary, the larger asymmetry factor indicates a larger rate contribution of the short wing with consideration of rate conservation.
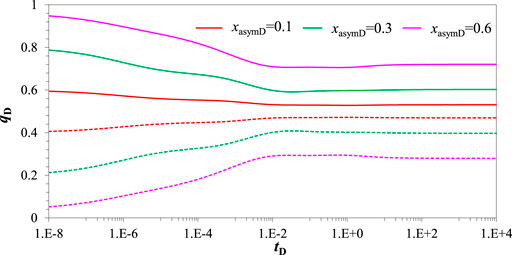
FIGURE 11. Rate distribution curve effected by asymmetry factor. (CD = 1e-5, S = 0.01, LF = 150 m, θF = 90o, CFD = 10, Re = 3000 m, ro = 2000 m, ω = 0.1, λ = 1,σ = 0.7, βm = 3.
Figure 12 displays that the wellbore pressure curve is influenced by different crossflow models. As is shown in Figure 12, a different crossflow model has an obvious influence on wellbore pressure during the crossflow regime. Transient state crossflow shows that the CBM of matrix system can crossflow into naturally fracture system quickly when the pressure of the natural fracture system decreases. On the contrary, pseudo-steady state crossflow shows that the CBM of matrix system cannot crossflow into the natural fracture system quickly when the pressure of the natural fracture system decreases. The CBM of the matrix system can flow out the surface of matrix particles by the seepage type. Therefore, the “concavity” of pressure derivative of transient state crossflow is deeper than that of pseudo-steady state crossflow during crossflow regime.

FIGURE 12. Pressure transient response curve affected by different crossflow model. (CD = 1e-5, S = 0.01, xasymD = 0.3, LF = 150 m, θF = 90o, CFD = 10, Re = 3000 m, ro = 2000 m, ω = 0.1, λ = 1, σ = 0.7, βm = 3).
Figure 13 is the rate distribution curve affected by the storativity ratio. The solid line represents the rate distribution of the short fracture and the dotted lines represent the rate distribution of the long fracture. It is assumed that the crossflow model is transient state crossflow. A large storativity ratio indicates larger storativity volume and a more natural network, which indicates more natural fractures can connect with hydraulic fractures. In addition, since the short fracture wing is closer to the wellbore. the rate contribution of short fracture wing is higher than that of long fracture wing. Therefore, the larger storativity ratio leads to the higher rate contribution of short fracture wing and small rate contribution of long fracture wing before crossflow regime.
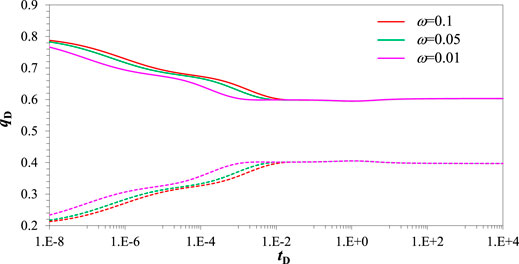
FIGURE 13. Rate distribution curve effected by storativity ratio. (CD=1e-5, S=0.01, xasymD=0.3, LF=150 m, θF=90o, CFD=10, Re = 3000 m, ro = 2000 m, λ = 1, σ = 0.7, βm = 3).
Figure 14 is the pressure transient response curve affected by adsorption-desorption coefficient. The adsorption-desorption coefficient mainly affects the typical curve shape after the crossflow regime. The smaller the value of adsorption-desorption coefficient is, the narrower and shallower the “concave” on the pressure derivative curve is. On the contrary, the larger the value of the adsorption-desorption coefficient is, the wider and deeper the “concave” on the pressure derivative curve is. The larger the amount of adsorbed gas in the coal matrix is, the more obvious the characteristics of crossflow after desorption are.
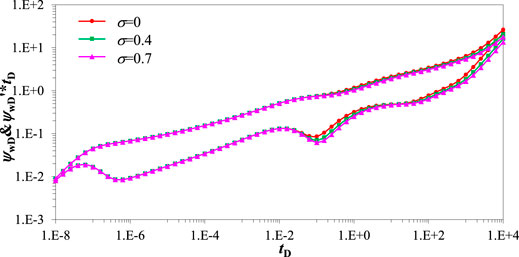
FIGURE 14. Pressure transient response curve effected by adsorption desorption coefficient. (CD = 1e-5, S = 0.01, xasymD = 0.3, LF = 150 m, θF = 90o, CFD = 10, Re = 3000 m, ro = 2000 m, ω = 0.1, λ = 1, βm = 3).
Figure 15 is a pressure transient response curve influenced by fracture angle. The influence of fracture angle on the pressure derivative curve is not very obvious. The fracture angle physical model is shown in Figure 16. The blue is the hydraulic and the red circle is the wellbore. Since fluid cannot flow into the hydraulic fracture and the largest rate supplement of the hydraulic fracture comes from fracture surface, the pressure wave can spread to closed boundary quickly with the increasing of the hydraulic fracture angle. Therefore, a larger fracture angle leads to higher pressure derivative curve during the arc boundary reflection regime. However, since the off-center distance is very large, the influence of a larger fracture angle on the pressure derivative curve is not very obvious.
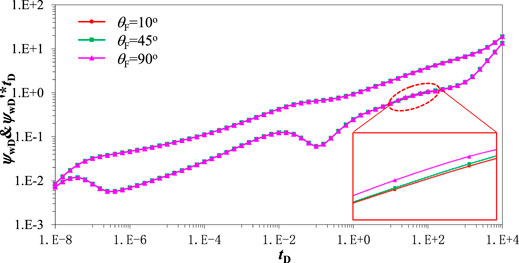
FIGURE 15. Pressure transient response curve effected by fracture angle. (CD = 1e-5, S=0.01, xasymD = 0.3, LF=150 m, CFD = 10, Re = 3000 m, ro = 2700 m, ω = 0.1, λ=1, σ = 0.7, βm = 3).
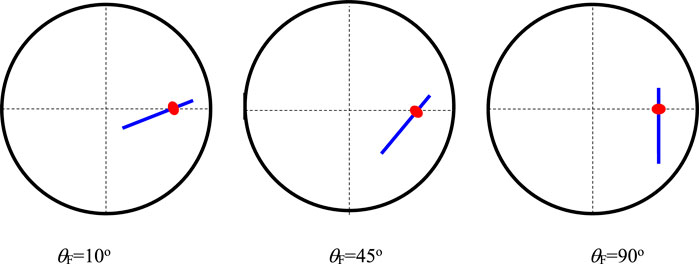
FIGURE 16. Fracture angle physical model.
Figure 17 is the rate distribution curve affected by fracture angle. The solid line represents the rate distribution of the short fracture and the doted lines represent the rate distribution of the long fracture. The fracture angle physical model is shown in Figure 16. The fracture angle has no influence on rate distribution curve before the arc boundary reflection regime. Rate supply around the boundary is finite, so short fracture wing rate contribution decrease with the decreasing of the fracture angle during the arc boundary reflection regime.
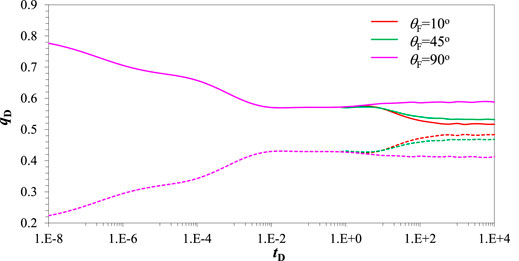
FIGURE 17. Rate distribution curve affected by fracture angle.
The field data is used to verify and apply the research results of this paper. The basic parameters are as follows: the wellbore radius is 0.1397 m, the height of the reservoir is 5 m, reservoir porosity is 0.103, the average gas rate is 5500 m3/d, the CBM viscosity is 1.82 × 10⁻² mPa s, relative density is 0.568, volume factor is 5.568 × 10⁻³, compressibility coefficient is 4.138 × 10⁻² MPa−1, compressibility coefficient of rock is 4.138 × 10⁻⁴ MPa−1, the total compressibility coefficient is 4.388 × 10⁻² MPa−1.
According to the pressure derivative curve, the five flow regimes can be diagnosed, which include well storage regime (①), skin reflection region (②), radial flow regime (③), crossflow regime (④), and arc boundary reflection regime (⑤). However, since well storage is very large, the bilinear and linear flow regimes are covered up. The fitting is shown in Figure 18. The fitting permeability is 25.3 mD, well storage is 0.08 m3/MPa, the storativity-ratio is 0.186, and the interporosity coefficient is 1.25 × 10⁻⁷. Matrix apparent permeability coefficient is 1.2, dimensionless; adsorption gas desorption coefficient is 0.4. Off-center distance is 3610 m and the control radius of a single well is 3,726.4 m. Distance from the center of hydraulic fracture to the wellbore is 40m, and the half-length of hydraulic fracture is 78 m.
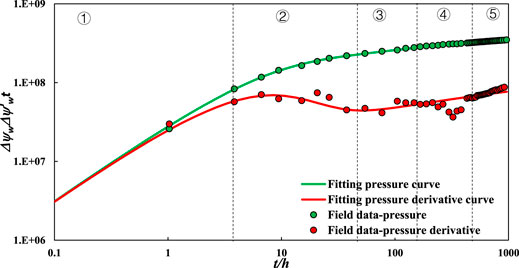
FIGURE 18. Log-log fitting curve.
Based on the micro seepage mechanism of the CBM, the semi-analytical model of off-center fractured well with asymmetric finite conductivity fracture. According to the pressure derivative curve characteristic and parameter sensitivity analysis, the following main conclusion can be drawn in this paper.
1) This semi-analytical solution is verified with a numerical solution and the calculation speed of our semi-analytical model is greater than numerical simulation.
2) Compared to center fractured well, our semi-analytical model has the ability to identify six flow regimes, which include bilinear flow, linear flow, elliptic flow, radial flow, arc boundary reflection, and boundary dominated flow regimes.
3) Off-center distance and fracture angle have an influence on the starting-time of arc boundary reflection. Compared to fracture angle, off-center distance has a sensitive influence on the pressure derivative curve of the arc boundary reflection regime. The larger off-center distance and fracture angle lead to a larger pressure derivative curve during the arc boundary reflection regime.
4) Fracture conductivity, asymmetry factor has obvious influence on the early flow regime. As the fracture conductivity increases, the asymmetry factor decreases, pressure, and the derivative curve is smaller during bilinear flow and linear flow regime.
5) Our application also evaluates hydraulic fracturing result and provide guidance to diagnose well location to the closed boundary.
The original contributions presented in the study are included in the article/Supplementary Material, further inquiries can be directed to the corresponding author.
AJ: Writing-original draft, conceptualization, code, methodology, model validation. ZC: Writing- review and editing, participated the discussions YW: Participated the discussions GZ: Data curation, supervision, constructive discussions guidance ZM: Figure description, supervision, model validation FC: Field application.
This article was supported by the Natural Science Foundation of Gansu Province (21JR1RM327), Innovation Foundation of Colleges and Universities in Gansu Province (2021A-127), and National Natural Science Foundation of China Regional Science Foundation Project (42162015).
Author ZM was employed by the company PetroChina Southwest Oil & Gasfield Company. Author FC was employed by the company PetroChina Qinghai Oil Field Company.
The remaining authors declare that the research was conducted in the absence of any commercial or financial relationships that could be construed as a potential conflict of interest.
All claims expressed in this article are solely those of the authors and do not necessarily represent those of their affiliated organizations, or those of the publisher, the editors, and the reviewers. Any product that may be evaluated in this article, or claim that may be made by its manufacturer, is not guaranteed or endorsed by the publisher.
The Supplementary Material for this article can be found online at: https://www.frontiersin.org/articles/10.3389/fenrg.2022.829914/full#supplementary-material
Aminian, K., and Ameri, S. (2009). Predicting Production Performance of Cbm Reservoirs. J. Nat. Gas Sci. Eng. 1 (1), 25–30. doi:10.1016/j.jngse.2009.03.003
Bennett, C. O., Rosato, N. D., and Reynolds, A. C. (1983). Influence of Fracture Heterogeneity and wing Length on the Response of Vertically Fractured wells. SPE-98-PAJ Soc. Pet. Eng. J. 23 (02), 219–230. doi:10.2118/9886-PA
Berumen, S., Tiab, D., and Rodriguez, F. (2000). Constant Rate Solutions for a Fractured Well with an Asymmetric Fracture. J. Pet. Sci. Eng. 25 (1), 49–58. doi:10.1016/S0920-4105(99)00053-4
Carslaw, H. S., and Jaeger, J. C. (1959). Conduction of Heat in Solids. second edition. London: Oxford University Press.
Chen, Z., Liao, X., Zhao, X., Dou, X., and Zhu, L. (2016). A Semi-analytical Mathematical Model for Transient Pressure Behavior of Multiple Fractured Vertical Well in Coal Reservoirs Incorporating with Diffusion, Adsorption, and Stress-Sensitivity. J. Nat. Gas Sci. Eng. 29, 570–582. doi:10.1016/j.jngse.2015.08.043
Cinco L., H. H., Samaniego V., F. F., and Dominguez A., N. (1978). Transient Pressure Behavior for a Well with a Finite-Conductivity Vertical Fracture. SPE-98-PA 18 (04), 253–264. doi:10.2118/6014-PA
Cinco-Ley, H., and Meng, H.-Z. (1988). Pressure Transient Analysis of wells with Finite Conductivity Vertical Fractures in Double Porosity Reservoirs. Houston, Texas: Paper presented at the SPE Annual Technical Conference and Exhibition. doi:10.2118/18172-MSPressure Transient Analysis of Wells with Finite Conductivity Vertical Fractures in Double Porosity Reservoirs
Crawford, P. B., and Landrum, B. L. (1955). Effect of Unsymmetrical Vertical Fractures on Production Capacity. Trans. AIME 204 (01), 251–254. doi:10.2118/433-G
Deng, Q., Nie, R.-S., Jia, Y.-L., Guo, Q., Jiang, K.-J., Chen, X., et al. (2017). Pressure Transient Behavior of a Fractured Well in Multi-Region Composite Reservoirs. J. Pet. Sci. Eng. 158, 535–553. doi:10.1016/j.petrol.2017.08.079
Guo, J., Wang, H., and Zhang, L. 2016. Transient Pressure and Production Dynamics of Multi-Stage Fractured Horizontal wells in Shale Gas Reservoirs with Stimulated Reservoir Volume. J. Nat. Gas Sci. Eng., 35: 425–443. doi:10.1016/j.jngse.2016.08.074
Huang, T., Guo, X., and Chen, F. (2015). Modeling Transient Pressure Behavior of a Fractured Well for Shale Gas Reservoirs Based on the Properties of Nanopores. J. Nat. Gas Sci. Eng. 23, 387–398. doi:10.1016/j.jngse.2015.02.020
Langmuir, I. (1917). The Constitution and Fundamental Properties of Solids and Liquids. Part II.-Liquids. J. Franklin Inst. 184 (5), 721. doi:10.1016/S0016-0032(17)90088-2
Lei, W., Xiao-dong, W., Xu-min, D., Li, Z., and Chen, L. (2012). Rate Decline Curves Analysis of a Vertical Fractured Well with Fracture Face Damage. J. Energ. Resour. Technology-Transactions Asme 134 (3). doi:10.1115/1.4006865
Liu, Y., Xu, H., Tang, D., Xu, F., Mathews, J. P., Hou, W., et al. (2020). Coalbed Methane Production of a Heterogeneous Reservoir in the Ordos basin, china. J. Nat. Gas Sci. Eng. 82, 103502. doi:10.1016/j.jngse.2020.103502
Narasimhan, T. N., and Palen, W. A. (1979). A Purely Numerical Approach for Analyzing Fluid Flow to a Well Intercepting a Vertical Fracture. Paper presented at the. California: SPE California Regional Meeting.
Nie, R.-S., Meng, Y.-F., Guo, J.-C., and Jia, Y.-L. (2012). Modeling Transient Flow Behavior of a Horizontal Well in a Coal Seam. Int. J. Coal Geology. 92, 54–68. doi:10.1016/j.coal.2011.12.005
Ozkan, E. (1994). New Solutions for Well-Test-Analysis Problems: Part Iii-Additional Algorithms. Paper presented SPE Annu. Tech. Conf. Exhibition. doi:10.2118/28424-ms
Ozkan, E., and Raghavan, R. 1991. New Solutions for Well-Test-Analysis Problems: Part 1-analytical Considerations(includes Associated Papers 28666 and 29213 ). SPE Formation Eval., 6(3): 359–368. doi:10.2118/18615-PA
Peaceman, D. W. (1990). Interpretation of Wellblock Pressures in Numerical Reservoir Simulation: Part 3 -- off-center and Multiple wells within a wellblockSPE Reservoir Engineering. SPE Reservoir Eng. 5 (02), 227–232. doi:10.2118/16976-PA
Pillalamarry, M., Harpalani, S., and Liu, S. (2011). Gas Diffusion Behavior of Coal and its Impact on Production from Coalbed Methane Reservoirs. Int. J. Coal Geology. 86 (4), 342–348. doi:10.1016/j.coal.2011.03.007
Rodriguez, F., Cinco-Ley, H., and Samaniego, -V., F. (1992). Evaluation of Fracture Asymmetry of Finite-Conductivity Fractured wellsSPE Production Engineering. SPE Prod. Eng. 7 (02), 233–239. doi:10.2118/20583-PA
Rosa, A. J., Magalhaes, A. A. C., and Horne, R. N. (1996). Pressure Transient Behavior in Reservoirs with an Internal Circular Discontinuity. SPE J. 1 (01), 83–92. doi:10.2118/26455-PA
Tiab, D., Lu, J., Nguyen, H., and Owayed, J. (2010). Evaluation of Fracture Asymmetry of Finite-Conductivity Fractured wells. J. Energ. Resour. Tech. 132 (1). doi:10.1115/1.4000700
Van Everdingen, A. F., and Hurst, W. (1949). The Application of the Laplace Transformation to Flow Problems in Reservoirs. J. Pet. Tech. 1 (12), 305–324. doi:10.2118/949305-G
Wang, H., Kou, Z., Guo, J., and Chen, Z. (2021). A Semi-analytical Model for the Transient Pressure Behaviors of a Multiple Fractured Well in a Coal Seam Gas Reservoir. J. Pet. Sci. Eng. 198, 108159. doi:10.1016/j.petrol.2020.108159
Wang, L., Dai, C., Li, X., Chen, X., and Xia, Z. (2019). Pressure Transient Analysis for Asymmetrically Fractured wells in Dual-Permeability Organic Compound Reservoir of Hydrogen and Carbon. Int. J. Hydrogen Energ. 44 (11), 5254–5261. doi:10.1016/j.ijhydene.2018.08.082
Wang, L., Wang, X., Li, J., and Wang, J. (2013). Simulation of Pressure Transient Behavior for Asymmetrically Finite-Conductivity Fractured wells in Coal Reservoirs. Transp Porous Med. 97 (3), 353–372. doi:10.1007/s11242-013-0128-z
Wang, L., and Wang, X. (2014). Type Curves Analysis for Asymmetrically Fractured wells. J. Energ. Resour. Technology-Transactions Asme 136 (2). doi:10.1115/1.4025712
Wang, L., and Xue, L. (2018). A Laplace-Transform Boundary Element Model for Pumping Tests in Irregularly Shaped Double-Porosity Aquifers. J. Hydrol. 567, 712–720. doi:10.1016/j.jhydrol.2018.06.027
Warren, J. E., and Root, P. J. (1963). The Behavior of Naturally Fractured Reservoirs. SPE-98-PA 3 (03), 245–255. doi:10.2118/426-PA
Xu, Y., Li, X., and Liu, Q. (2020). Pressure Performance of Multi-Stage Fractured Horizontal Well with Stimulated Reservoir Volume and Irregular Fractures Distribution in Shale Gas Reservoirs. J. Nat. Gas Sci. Eng. 77, 103209. doi:10.1016/j.jngse.2020.103209
Zhao, Y.-l., Shan, B.-c., and Zhang, L.-h. (2019). Pressure Dynamics of Asymmetrically Fractured wells in an Arbitrarily Shaped Reservoir. J. Hydrodyn 31 (4), 767–777. doi:10.1007/s42241-018-0166-7
Zhao, Y.-l, Zhang, L.-H., Feng, G.-Q., Zhang, B.-N., and Kang, B. (2016). Performance Analysis of Fractured wells with Stimulated Reservoir Volume in Coal Seam Reservoirs. Oil Gas Sci. Technol. – Rev. IFP Energies Nouvelles 71 (1), 8.
Zhao, Y., Li, H., Zhang, L., and Kang, B. (2017). Pressure Transient Analysis for Off-Centered Fractured Vertical wells in Arbitrarily Shaped Gas Reservoirs with the Bem. J. Pet. Sci. Eng., 156: 167–180. doi:10.1016/j.petrol.2017.05.015
Keywords: hydraulically fractured well, coalbed methane, off-center well, asymmetrical fracture, pressure transient response
Citation: Ji A, Chen Z, Wang Y, Zhang G, Mao Z and Chen F (2022) A Semi-Analytical Mathematical Model for Off-Center Fractured Vertical Wells With Asymmetrical Fractures in Columnar Coalbed Methane. Front. Energy Res. 10:829914. doi: 10.3389/fenrg.2022.829914
Received: 06 December 2021; Accepted: 14 January 2022;
Published: 25 February 2022.
Edited by:
Jiang Bian, China University of Petroleum (East China), ChinaReviewed by:
Hu Guo, China University of Petroleum, Beijing, ChinaCopyright © 2022 Ji, Chen, Wang, Zhang, Mao and Chen. This is an open-access article distributed under the terms of the Creative Commons Attribution License (CC BY). The use, distribution or reproduction in other forums is permitted, provided the original author(s) and the copyright owner(s) are credited and that the original publication in this journal is cited, in accordance with accepted academic practice. No use, distribution or reproduction is permitted which does not comply with these terms.
*Correspondence: Anzhao Ji, amlhbnpoYW9fODMxMDI0QDE2My5jb20=
Disclaimer: All claims expressed in this article are solely those of the authors and do not necessarily represent those of their affiliated organizations, or those of the publisher, the editors and the reviewers. Any product that may be evaluated in this article or claim that may be made by its manufacturer is not guaranteed or endorsed by the publisher.
Research integrity at Frontiers
Learn more about the work of our research integrity team to safeguard the quality of each article we publish.