- 1Shandong Key Laboratory of Intelligent Buildings Technology, School of Information and Electrical Engineering, Shandong Jianzhu University, Jinan, China
- 2State Grid Shandong Integrated Energy Services CO., LTD, Jinan, China
- 3Jinan Power Supply Company, State Grid Shandong Electric Power Company, Jinan, China
The cultivation of crops in greenhouses is well established in China. However, the greenhouse climate is complex, rendering it difficult to analyze the greenhouse load and control the energy supply system. It is important to ensure the optimal design of greenhouse operation to enable optimal crop growth and maintain low operation costs for improving the greenhouse crop production efficiency and economic benefits. To reduce the energy consumption , we propose a new integrated energy supply system. This system uses a combined cooling, heating and power system, and an air source heat pump. A two-stage integrated optimization model of the integrated energy supply system was built, with “minimum average daily economic cost” and “maximum CO2 emission reduction rate (ERR)” as the objectives in the first stage. The characteristics of the countryside were taken into consideration for optimizing the capacity of the combined cooling, heating and power supply, energy storage and air source heat pump. In the second stage, the objectives were “maximum annual operating saving rate (OSR)”, “maximum CO2 emission reduction rate”, and “maximum primary energy saving rate (PESR)”. The capacity of the equipment designed in the first stage is used as the constraint to optimize the operating output of the combined cooling, heating and power supply, air source heat pump. Finally, a greenhouse is used as a prototype to carry out simulation calculations for two typical days in summer and winter to verify the effectiveness of this method. The simulation results showed that after the first stage of optimization, the average daily operating cost was significantly lower and the CO2 emission rate was reduced by 49.53%. After the second stage, annual operating saving rate, CO2 emission reduction rate, and primary energy saving rate were 39.51, 48.88, and 27.57% for a typical summer day and 52.96, 50.18, and 50.13% for a typical winter day, respectively. Therefore, compared to the existing energy supply systems, the integrated energy supply system and the integrated optimization design of the system could effectively avoid energy wastage, significantly improve the degree of match between the system design and operation, reduce operating cost, and reduce CO2 emission.
1 Introduction
Energy shortages and environmental pollution are serious global concerns. Energy saving, emission reduction, development of renewable energy, and distribution of energy supply systems are the need of modern economies. In a modern agronomic facility with high efficiency and high energy consumption, efficient regulation of greenhouses is an inevitable requirement for high crop yield and quality. However, greenhouse regulation is energy-dependent, for which energy consumption is generally high (Vadiee and Martin, 2013). In addition to the characteristics of greenhouses, such as strong coupling, nonlinearity, and strong perturbation (Lin et al., 2019), excessive energy consumption in greenhouses is a major factor that hinders their development (Ahmad et al., 2021). Unlike that in ordinary buildings, each parameter in the greenhouse environment has a significant influence on the entire greenhouse. The greenhouse climate is a nonlinear dynamic system whose temperature depends on several factors such as solar radiation, outdoor temperature, wind speed, and the type of plants cultivated (Jung et al., 2020). In addition, the greenhouse structure and the operation of internal energy supply equipment influences the greenhouse climate significantly (Lin et al., 2020). Therefore, it is extremely difficult to perform load analysis for greenhouses. To reduce the energy consumption in greenhouse operations, optimal design of greenhouse energy consumption and equipment operation is necessary. This could effectively improve the energy efficiency of agricultural greenhouses, while reducing the cost of greenhouse operation and shortening the energy recovery cycle.
To address the difficulties in greenhouse load analysis, we propose a load analysis method for greenhouse energy supply, using an integrated energy supply system (IESS). The IESS consists of a combined cooling, heating, and power (CCHP) system and an ASHP. Combining a CCHP system with an ASHP enables building a highly efficient energy system that provides greater flexibility in meeting the load requirement (Wegener et al., 2021). The IESS contains different types of energy conversion units, which can provide three forms of energy simultaneously: cooling, heating, and electricity. In addition, it regulates its own operation with a high degree of flexibility to mitigate external disturbances in the face of multiple external factors.
The CCHP system can improve energy efficiency significantly. The system structure is flexible and diverse; therefore, it can simultaneously reduce the emission of pollutants effectively. The CCHP system has wide applications; it improves the overall performance of the system and simultaneously increases the complexity of the relationship between the system structure and energy. Therefore, optimized design of the system and the accurate matching of energy supply and demand are important prerequisites for the efficient operation of CCHP system. This has to account for the changes in the cooling, heating, and electric loads and the actual demand of users. To match the energy demand and improve the performance of CCHP systems, Wegener et al. (2018) and Gao et al. (2019) proposed a system design and optimization method for a CCHP system. For the optimal design of a CCHP system, Ren et al. (2021) proposed a hybrid CCHP system, which consisted of a gas turbine, absorption chiller, photovoltaic (PV) panel, and Battery. Song et al. (2020a) investigated the optimal configuration for a hybrid CCHP system and studied the corresponding optimal economic and energy performance, using a multi-objective optimization model. Wang et al. (2020) determined the capacity configuration of a CCHP system that provided the best integrated performance and quantitatively evaluated the sustainability index of the system. Yan et al. (2021) proposed a multi-objective optimization method for optimizing the capacity configuration of a CCHP system. Tian et al. (2018) proposed a decoupling method to decompose the energy, and a matrix optimization model to optimize the capacity of the CCHP system. Liu et al. (2013) optimized the capacity configuration of power generator unit (PGU) to achieve the optimal performance of the CCHP system. Ghersi et al. (2021) proposed a new operation strategy for the CCHP system and optimized its capacity configuration using a multi-objective optimization algorithm. Wang et al. (2014) added biomass gas to the CCHP system and used a genetic algorithm to optimize the capacity of the system. Kang et al. (2021) constructed a multi-objective optimization model and optimized capacity configurations for four types of building CCHP systems.
However, in the process of capacity configuration, the accessibility to renewable energy deepens the complexity of the CCHP system multi-energy flow and introduces several random factors into the operation strategy. This overturns the traditional operation mode of the CCHP system and creates difficulty in source-load matching. This further deepens the coupling between the capacity configuration and operation strategy of the system. For the operational design of the CCHP system, Li et al. (2018) adopted the traditional operation modes of the following electrical load (FEL) and following thermal load (FTL). The system was considered economical for developing an optimal and cooperative strategy for an integrated energy system comprising multiple energy stations and energy storage devices. Kang et al. (2017) and Das et al. (2018) investigated the system performance under FEL and FTL; these two operation strategies could not fully utilize the system advantages for meeting the various demands. Therefore, there is a need for an optimal operation model that is based on specific parameters such as time-of-day tariffs and energy prices, which are combined with load forecasting to achieve work mode switching. Ren et al. (2021) and Ghersi et al. (2021) used multi-objective optimization algorithms to optimize the design of the CCHP system operation strategy. They developed the Pareto Frontier solution applied in the multi-objective optimization model, considering the economic, energy, and environmental performances of the model. Li et al. (2020) proposed a CCHP system operation strategy that followed the thermoelectric load balance. Considering the interaction between the capacity configuration and operation strategy, Ma et al. (2017) took seasonality into account in the equipment operation strategy. They analyzed the capacity configuration and operation strategy of the equipment in the system using a multi-objective optimization method. Song et al. (2020b) modeled the CCHP system and the sub-supply system separately, and optimized them for an optimal capacity configuration and operation strategy. This results in further deepening of the coupling between the capacity configuration and operation strategy of the core equipment of the CCHP system. Therefore, the traditional CCHP system optimization design method can no longer cope with the requirements of renewable energy characteristics and variable operating conditions. Further studies on the two-stage optimization design of the equipment capacity and operation strategy of the renewable energy IESS, are required.
To address these issues, we proposed a two-stage optimal design method for the IESS capacity configuration and operation strategy based on C-NSGA-II. In the first stage, we optimized the capacity configuration of the core equipment of the designed IESS. In the second stage, we used the optimized design results as constraints, to further optimize the operation strategy of the designed core equipment. Therefore, a two-stage interaction mechanism is established between the system capacity configuration and operation strategy, while improving the efficiency and comprehensive performance of the IESS.
This method establishes an interactive feedback between the two stages and builds a two-stage optimization design architecture that can optimize the systems’ capacity and operation. EnergyPlus can calculate the building’s cooling and heating loads, by analyzing the physical composition of the building and the mechanical system. This can be used to maintain the indoor room temperature through the heating, ventilation, and air conditioning (HVAC) system. We first simulated the energy consumption of the greenhouse’s cooling, heating, and electric loads using EnergyPlus. We used the simulated load data as the input for the CCHP system. Based on this, we constructed a two-stage optimization model of the IESS; in the first stage, the optimization objectives of “minimum average daily economic cost” and “maximum CO2 emission reduction rate” were established based on the results of the second stage optimization design. The C-NSGA-II algorithm was used to optimize the capacity configuration of the core equipment in the IESS. In the second stage, the optimization objectives of “maximum annual operation saving rate,” “maximum CO2 emission reduction rate,” and “maximum primary energy saving rate” were established. The C-NSGA-II algorithm was used to further optimize the operation strategy of the core equipment, using the capacity of the equipment optimized in the first stage as the constraint. Finally, a prototype greenhouse was used as a case study to evaluate the advantages of the method. The simulation results indicated that our two-stage method for the optimization of IESS effectively avoided the wastage of resources, reduced the cost, and lowered the CO2 emissions.
This study uses an innovative approach to improve the functioning of greenhouses. High energy consumption and difficulty in load analysis in the greenhouses is attributed to the challenges in controlling the energy supply system. Therefore, we constructed an integrated energy supply system consisting of CCHP, and ASHP to overcome these challenges.
The introduction of indirect renewable energy in the CCHP system has deepened the coupling between the capacity configuration and operation strategy of the integrated energy supply system. Therefore, we proposed a two-stage optimization for the integrated energy supply system. In the first stage, the optimal capacity of the integrated energy supply system was designed considering the optimization results of the second stage. In the second stage, the optimal capacity of the equipment in the first stage was used as the constraint, for optimizing the design of the optimal operation strategy of the integrated energy supply system. The synergistic optimization in the two stages results in a higher degree of coherence between the system design and operation, greater economy, and energy efficiency.
The remainder of this paper is structured as follows. Section 2 presents the structure of the constructed integrated energy supply system and the models of each device in the system. Section 3 presents the specific principles and methods for the two-stage optimization design of the integrated energy supply system, including the optimization objectives, optimization variables, constraints, and optimization algorithms for each stage. In Section 4, a simulation case study is conducted with a greenhouse as a prototype to verify the effectiveness of the proposed integrated energy supply system and its optimization design method. Finally, in Section 5, the research methods and results of this paper are summarized.
2 System Structure and Energy Supply Equipment Model
The CCHP system is an energy system with low environmental impact and high efficiency. Compared to the conventional energy systems, CCHP systems can achieve sustainable energy savings, typically 10–30%. Therefore, using these systems can significantly reduce CO2 emissions (Song et al., 2020), which is an ideal way for energy conservation and emission reduction. They also ensure the efficient use of new energy sources, and is therefore, highly promising. This study has considered the aspects of rural resource endowment and has built an integrated energy supply system based on CCHP, distributed new energy generation, and ASHP devices.
2.1 Analysis of Integrated Energy Supply System for Agriculture
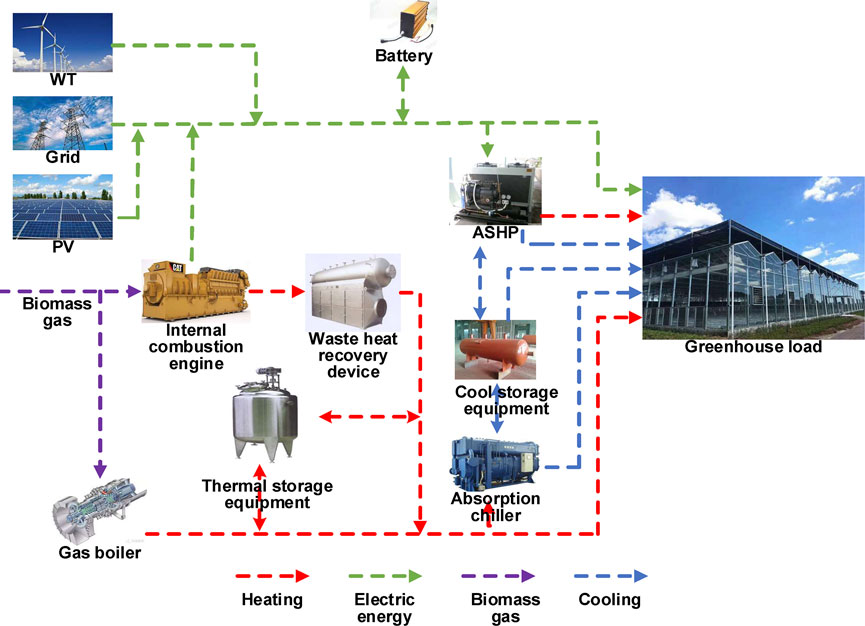
The CCHP system makes full use of the “energy-ladder” principle by recovering waste heat for power generation, cooling, and heating, simultaneously. A high-quality CCHP system can achieve a global efficiency of 42% ensuring an efficient integrated supply of heating and cooling electric energy (Lombardo et al., 2021). The structure diagram of the IESS system built based on CCHP is shown in Figure 1.
The system consists of three parts: power supply, cooling, and heating, which are explained below:
The power supply consists of an internal combustion engine (ICE), wind turbine (WT), and PV. The electric energy produced by the system supplies electricity to the users and the system itself, and the system was “grid-connected”; therefore, it could purchase electricity from the grid when the produced electricity was insufficient; the energy was fed back into the grid when there was an excess of electricity generated (Li et al., 2021).
The heating system includes the waste heat generated by the ICE-consuming biomass gas, gas boiler, and ASHP. The ICE generated cylinder liner water waste heat and flue gas waste heat during operation These were recovered using a cylinder liner water heat exchanger and flue gas heat exchanger, respectively. The recovered waste heat was partly used to operate the absorption chiller for cooling and partly to supply heating to the customers. The ASHP was used for heating during winter. When the waste heat generated by the ICE and the heating provided by the ASHP were insufficient to meet the demand of the customers, the gas boiler was used for auxiliary heating. In cases when excessive heat was available, the thermal storage equipment stored the excess heat from the gas boiler and the waste heat recovery equipment.
The cooling system consists of two parts: an absorption chiller and an ASHP. The cooling load of users is mainly provided by the absorption chillers. When the cooling load is insufficient, the auxiliary cooling of ASHP fulfills the cooling load.
2.1.1 Core Equipment Model of Agricultural Energy Supply System
2.1.2 Wind Turbine (WT)
The relationship between wind power characteristics, mainly output power and wind speed, can be expressed as follows (Zhang et al., 2020):
where PWT(t) is the output power of WT at time t, Pr is the rated power of WT, v(t) is the actual outdoor wind speed at time t, vr is the rated wind speed of WT, vin is the cut-in wind speed of WT, and vout is the cut-out wind speed of WT.
2.1.2.1 Photovoltaic (PV) Output Power
The variation in the PV output power, with respect to the solar radiation and temperature, can be expressed as follows:
where PPV(t) is the output power of PV at time t, I(t) is the solar radiation at time t, PSTC is the maximum test power under standard test conditions (ISTC is 1000W/m2, Tr is 25°C), k is the power temperature coefficient, and TPV(t) is the temperature of PV at time t, which was estimated using the test ambient temperature. TPV(t) was calculated using the following equation:
where, T0(t) is the outdoor temperature at time t.
2.1.2.2 Internal Combustion Engine (ICE)
The operating conditions of the internal combustion generator set are complex and changeable.
The mathematical model of the ICE can be expressed as follows (Yan et al., 2018):
where, GICE(t) is the amount of biomass gas consumed by the ICE at time t, EICE(t) is the amount of electricity generated by ICE at time t; ηpe(t) is the efficiency of electricity generation at time (t) affected by PLR; ηte(t) is the efficiency of heat generation at time (t) affected by PLR; Qre(t) is the recoverable heating of ICE at time t, Qjw(t) is the waste heating of the cylinder sleeve water at time t; ηjw(t) is the efficiency of the cylinder sleeve water heating exchanger at time t, Qexh(t) is the waste heating of the flue gas heating exchanger at time t, and ηexh(t) is the efficiency of the flue gas heating exchanger at time t, Qloss(t) is the lost heating at time t.
2.1.2.3 Biomass Gas Boiler
The mathematical model of the gas boiler can be expressed as follows (Jia et al., 2021):
where Qb(t) is the heat capacity of the gas boiler at time t, Fb(t) is the biomass gas volume of the gas boiler at time t, LNG is the biogas gas calorific value, and ηb is the heating efficiency of the gas boiler.
2.1.2.4 Absorption Chiller
The mathematical model of absorption chiller can be expressed as follows (Zhao et al., 2021):
where Qac(t) is the cooling capacity of the absorption chiller at time t, Qac_in(t) is the input heating of the absorption chiller at time t, and COPac is the energy efficiency rate of the absorption chiller.
2.1.2.5 ASHP
where Qhp,h(t) is the heat capacity of the ASHP at time t, Qhp,c(t) is the cooling capacity of the ASHP at time t, Ehp,h(t) is the power consumption of the ASHP (when heating) at time t, Ehp,c(t) is the power consumption of the ASHP (when cooling) at time t, COPhp,h is the heating energy efficiency rate, and COPhp,h is the cooling energy efficiency rate.
2.1.2.6 Battery
Notably, in the process of charging and discharging, the state of energy storage at each moment is related to the state of energy storage at the previous moment, amount of charging and discharging at the moment, and amount of power decay of the energy storage capacity of the system, which can be expressed as follows:
where EBT(t) is the remaining capacity of the battery at time t, EBT (t-1) is the remaining capacity of the Battery at time t-1, and PBT,charge(t) and PBT,discharge(t) are the average power of the battery charging and discharging, respectively, at time t. Ηcharge and ηdischarge are the charging and discharging efficiencies of the battery, respectively; µc is 1 in the storage charging state and 0 in the non-charging state, and µd is 1 in the storage discharging state and 0 in the non-discharging state.
2.1.3 Energy Flow Analysis of Agricultural Greenhouse Energy Supply System
The electric balance of the agricultural greenhouse energy supply system at moment t can be expressed as follows:
where EPV(t) is the power generation of the PV panel at time t, EWT(t) is the power generation of the WT at time t, Egrid(t) is the system-grid interaction at time t, EL(t) is the electric load required by the user at time t, and EBT,charge(t) and EBT,discharge(t) are the production and energy storage of the battery at time t, respectively.
The heating balance of the agricultural greenhouse energy supply system at moment t can be expressed as follows:
where Qh,L(t) is the heating load required by the user at time t, and the other components are the same as that expressed in the earlier equation.
The cooling balance of the agricultural greenhouse energy supply system at time t can be expressed as follows:
where Qc,L(t) is the cooling load required by the user at time t.
3 Two-Stage Optimization of Agricultural Greenhouse Energy Supply System
The introduction of renewable energy renders the structure of the IESS more complex; the coupling relationship between the capacity configuration and operation strategy of the core equipment is further deepened. In this study, we analyzed the relationship logic between capacity configuration and operation strategy. We adopted a two-stage method for optimizing the capacity configuration and operation strategy of the system. In the second stage, the capacity configuration obtained from the first-stage was used as the constraint for the operation and strategy optimization design; the interaction between the two-stage design was realized, economic and environmental indicators were selected as the optimization targets, and a two-stage optimization model was established. The logical relationship between the two stages is shown in Figure 2.
3.1 System Capacity Configuration Optimization Model
3.1.1 Optimization Objectives
3.1.1.1 Economic Indicators
Economy is a prerequisite for the large-scale application of renewable energy IESS; reducing the costs and improving the economy are critical for promoting the new system. Therefore, in the first-stage of the optimization model, we considered the minimum average daily economic cost of the system as one of the optimization objectives, which can be expressed as follows:
where Cr is the average daily economic cost of the system; Ci,var is the daily operating cost of each equipment of the system, such as the cost of biomass gas consumption, cost of purchased electricity, and operation and maintenance cost of each equipment. Their calculation is expressed in the second stage; Nd is the number of typical days, and Ccap is the daily acquisition cost of each piece of equipment of the system converted by the conversion factor, which can be expressed as follows:
where Ni,r is the capacity of the ith equipment, Ci,v is the unit acquisition cost of the ith equipment, r is the conversion factor (8%), and Ti is the lifespan of the ith equipment.
3.1.1.2 Environmental Indicators
CO2 is the main cause of the greenhouse effect; therefore, the maximum CO2 emissions reduction rate was considered as another optimization objective. The CO2 emissions during the operation cycle of the IESS were calculated, using the equation given below:
where CO2EIESS is the total CO2 emission of the IESS, µg and µe are the CO2 emission factors of biomass gas and grid generation, respectively, and Ggas is the amount of biomass gas consumed by the IESS, which is numerically equal to the sum of biomass gas consumed by the ICE and gas boiler.
The energy supply of the existing greenhouse setup is mainly purchased from the grid; therefore, its CO2 emissions can be expressed as follows:
where, C O 2E is the CO2 emissions of existing energy supply system.
The emission reduction potential of the IESS relative to that of the existing energy supply system can be further evaluated by defining the ERR of the IESS, which can be expressed as follows (Wen et al., 2022):
where, FERR is the maximum CO2 emission reduction rate.
3.1.1.3 Constraints
WT and PV are important renewable energy generation systems. Their capacity has a great impact on the overall performance of the integrated energy supply system. ICE is the core power equipment of the integrated energy supply system. The capacity of biomass gas boiler, absorption chiller and other equipment is determined by the ICE. ASHP is an important link between cooling and heating, the capacity size affects the degree of matching system operation. Battery is the main energy storage equipment of the integrated energy supply system; it can play the role of peak load shifting. Therefore, the capacity of WT, PV, ICE, ASHP, and battery are selected as the optimization variables in the first stage. The system operation needs to meet certain capacity limits; therefore, there was a range of constraints on the capacity configuration of the system equipment. Notably, the optimization objectives were required to meet the following constraints, as shown below:
where NWT, NPV, NICE, and NBT are the configured capacities of WT, PV, ICE, and battery, respectively. Nhp,h and Nhp,c are the configured capacities of the ASHP for heating and cooling, respectively. NPV,max, NICE,max, and NBT,max are the maximum capacities of the PV, ICE, and battery, respectively. Nhp,h,max and Nhp,c,max are the maximum capacities of the ASHP for heating and cooling, respectively. and NBT,min is the minimum capacity of battery.
3.2 System Operation Strategy Optimization Model
3.2.1 Optimization Objectives
3.2.1.1 Economic Indicators
For the second stage of optimization, we first considered the economy of the system. The maximum annual operation saving rate of the system was one of the optimization objectives. It mainly includes the cost of electricity purchased from the grid, cost of biomass gas consumption, and maintenance cost of each equipment. The total annual operation saving rate of the IESS, compared to that of the existing energy supply system of the greenhouse, was calculated using the equations given below:
where C(t) is the cost of the existing greenhouse energy supply system at time t, and CIESS(t) is the cost of the IESS at time t.
where Cgrid(t) is the cost of electricity purchased from the grid at time t, Cgas(t) is the cost of biomass gas consumed by the system at time t, and Ccom(t) is the operation and maintenance cost of the system equipment at time t. The costs were calculated using the equations given below:
where cgrid(t) and cgas(t) are the grid electric price and biomass gas unit price purchased from the grid at time t, respectively. Ci is the operation and maintenance cost of the ith equipment, Pi(t) is the ith equipment in the system operating power at moment t, and Pgrid(t) is the power purchased from the grid at moment t.
3.2.1.2 Environmental Indicators
Similar to that in the first stage of optimization, during the second stage of optimization, we considered the emissions of the pollutant gases during system operation. In this study, the maximum ERR of the system was the optimization objective, and its expression was consistent with that in the first stage.
3.2.1.3 Energy-Saving Indicators
The primary energy consumed by the system was estimated using the following equations:
where GIESS(t) is the primary energy consumed by the system at time t; Ge,IESS(t) is the converted energy consumption of the IESS interacting with the grid at time t; Gb(t) is the amount of biomass gas consumed by the gas boiler of the IESS at time t; GICE(t) is the amount of biomass gas consumed by the gas generator at time t, and ηe,grid is the power plant generation efficiency, and ηtr is the grid transmission efficiency.
Energy-saving indicators are important indicators for evaluating the primary energy use of a system. The primary energy saving rate is given below:
3.2.2 Constraints
The ICE is the source of power generation and heat production in the integrated energy supply system. Therefore, it is the key to determining whether the whole system operates efficiently and is an important link between cooling and heating. A reasonable hour-by-hour operation strategy of the ASHP can match the cooling and heating loads more reasonably and improve the efficiency of the integrated energy supply system. The battery is the main energy storage device; it can be designed to further improve the effect of peak load shifting. Therefore, for the second stage, the hour-by-hour operation of the ICE, ASHP, and battery were selected as the optimization variables. The constraints of the optimization variables are shown as follows.
where EBT,min and EBT,max are the upper and lower limits of the energy storage state of the battery, respectively; PBT,charge,min and PBT,charge,max, are the upper and lower limits of the battery charging, PBT,discharge,min and PBT,discharge,max are the upper and lower limits of the battery discharging.
3.3 Optimization Algorithm
In case of the system multi-objective optimization problem, pure mathematical analysis is limited by the objective function; therefore, it has limited use. In case of the IESS operation strategy problem, the objective function and the system model have nonlinear and discrete characteristics. In this study, we observed a strong coupling between the two stages, which was difficult to solve using traditional analytical methods. In addition, the optimization model had some limitations. Therefore, a hybrid algorithm of non-dominated ranking genetic algorithm and multi-objective particle swarm optimization (C-NSGA-II) was used to solve the multi-objective optimization model. It combines chaotic mapping, multi-objective genetic algorithm (NSGA-II), and multi-objective particle swarm algorithm (MOPSO), with NSGA-II algorithm as the main body, It uses the traversal feature of chaotic mapping to initialize the population, and the speed and position update mode of MOPSO to reconstruct the variation operator, for improving the convergence speed of the algorithm. This could have a significant impact on the field of multi-objective optimization (Zhang et al., 2013).
4 Case Study
In this study, the characteristics of a greenhouse were analyzed using a prototype of a continuous greenhouse with actual crops. The energy supply system was a wet curtain fan and a heat pump system. This often results in energy waste because it is difficult to control the wet curtain fan and heat pump. Therefore, we adopted the IESS for the energy supply and used a two-stage optimization design method for optimizing the energy consumption of the greenhouse.
4.1 Energy Simulation Software
In this study, energy consumption simulations for continuous greenhouses were performed using EnergyPlus, developed by the United States Department of Energy as a whole building energy simulation program based on a modular structure (Mazzeo et al., 2020). EnergyPlus has several modules that are integrated and solved simultaneously. It is a complete energy simulation software that requires a large amount of data input; and, it is time consuming to manually enter all the data. Therefore, to achieve a complete energy simulation, a 3D model of the greenhouse was created using SketchUp and OpenStudio, which allows designers to create intuitive ideas directly and is an excellent tool for creating 3D architectural design solutions. OpenStudio is a plug-in for SketchUp; together, they were used to build a geometric model of the building simulated by EnergyPlus. OpenStudio uses EnergyPlus to simulate the energy consumption of a building and provides it as a visual user interface for EnergyPlus.
4.2 Energy Simulation Data
The construction data of this continuous greenhouse are shown in Table 1. A 3D physical model of the continuous greenhouse, drawn using SketchUp and OpenStudio, is shown in Figure 3. After importing the physical model into EnergyPlus, the thermal properties, as well as the structural data, were assigned to its various parts.
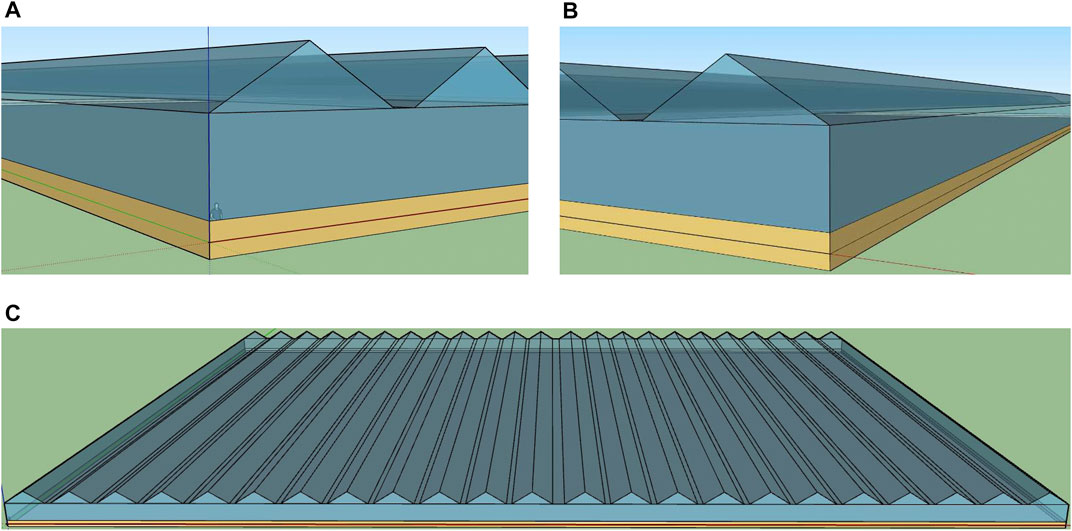
FIGURE 3. Greenhouse three-dimensional (3D) physical model. (A) and (B) shows a partial view of the left and right sides of the greenhouse, respectively, and (C) shows the overall view of the greenhouse.
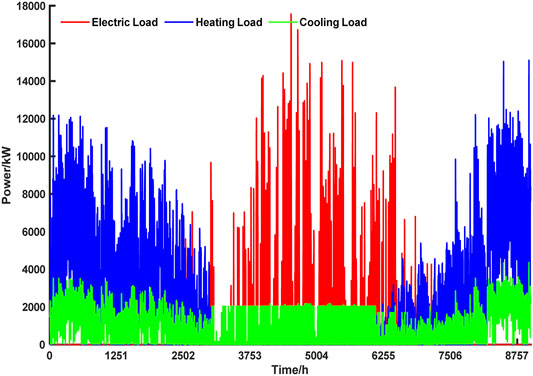
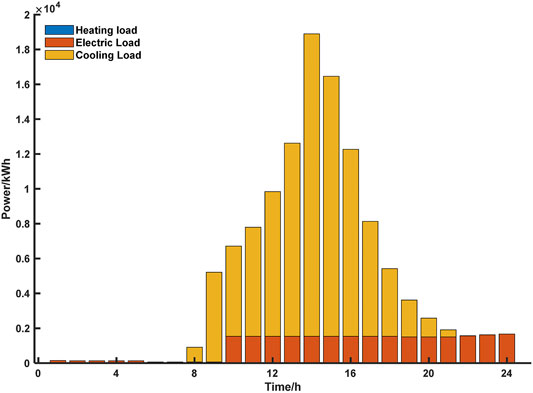
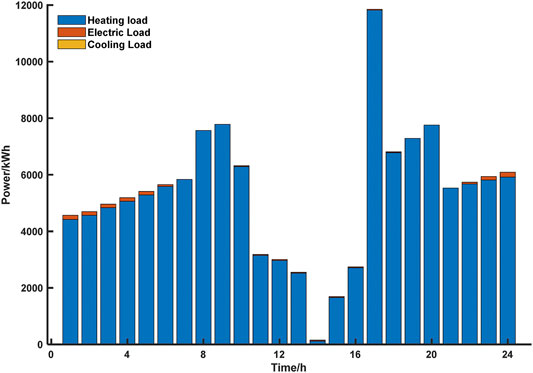
The greenhouse cooling, heating, and electric load data were simulated using EnergyPlus, and the annual load data are shown in Figure 4. The solar radiation and temperature variation curves for the typical summer and typical winter days are shown in Figure 5A and Figure 5B, respectively. The greenhouse loads on typical summer and typical winter days are shown in Figure 6 and Figure 7, respectively.

FIGURE 5. Solar radiation and temperature change curve on a typical day. The solar radiation and temperature variation curves for the typical summer day is shown in (A). The solar radiation and temperature variation curves for the typical winter day is shown in (B).
Tomato was used as the crop; it requires a temperature range of 10–30°C for optimal growth. Temperatures higher than 35°C or lower than 10°C (Ro et al., 2021) affect the growth of tomatoes. Therefore, the cooling temperature was set to 30°C and heating temperature was set to 15°C in EnergyPlus. Agricultural greenhouses can reach a maximum heating load of approximately 12,000 kW and maximum cooling load of approximately 17,500 kW, which is much higher than the heating and cooling loads of ordinary buildings (Figure 4). The radiation and temperature on a typical summer day were significantly higher than that on a typical winter day (Figure 5A and Figure 5B). Additionally, the load on a typical summer day was dominated by the cooling load, and the load on the typical winter day was dominated by the heating load (Figure 6, Figure 7).
4.3 System Optimization Parameters
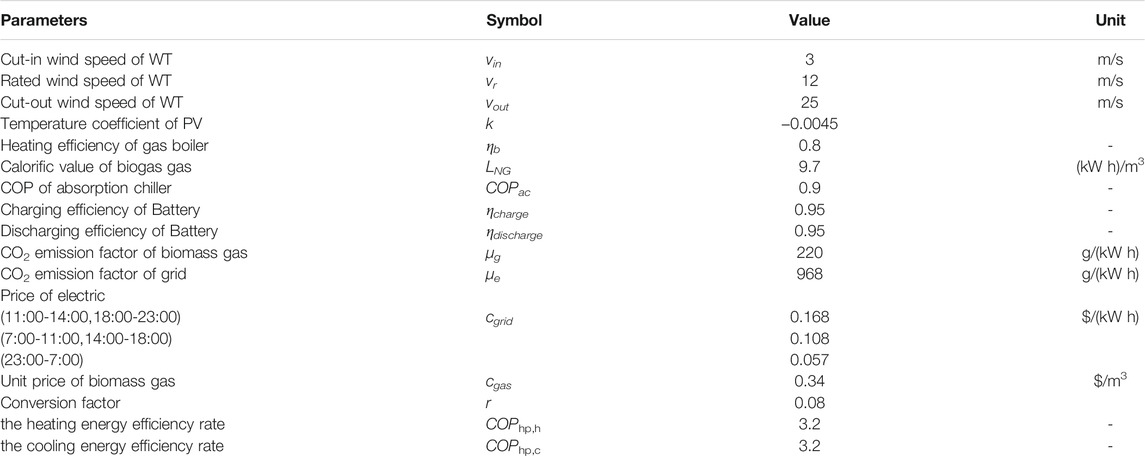
The basic parameters of the agricultural greenhouse energy supply system are listed in Table 2 (Yan et al., 2018; Wegener et al., 2020). The cost and lifespan of each equipment in the agricultural greenhouse energy supply system are listed in Table 3 (Yan et al., 2018; Wegener et al., 2020).
5 Analysis of Simulation Results
To demonstrate the improvements in the optimization method proposed in this study, we compared our method to the existing energy supply model of the greenhouse; we analyzed the advantages of our method in several aspects.
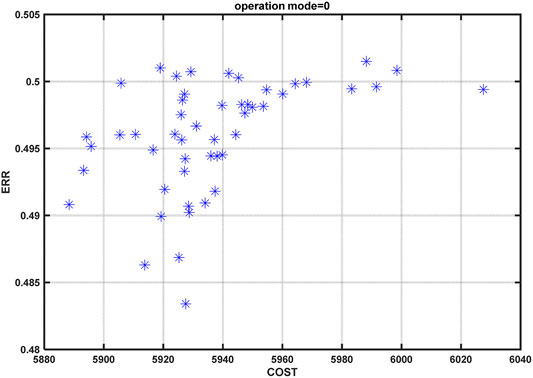
The IESS was used to supply energy to the greenhouse. The annual load simulation data were simulated using EnergyPlus, and then, used as the parameter input for the two-stage optimization. The set of Pareto feasible solutions optimized in the first-stage capacity configuration is shown in Figure 8. The optimized Pareto feasible solution sets for a typical summer day and typical winter day obtained in the second stage of the operation strategy are shown in Figure 9A and Figure 9B, respectively. The greenhouse load in summer is mostly generated at noon, which is the same time as the high power generation of PV generating units. The opposite is true in winter, and there is a clear difference between summer and winter based on the optimization results. When the C-NSGA-II algorithm is used to solve the non-dominated solution of the second-stage optimization objective, the constraints contain a large number of non-linear models and the state of charge (SOC) constraints on the energy storage. This results in a more scattered Pareto feasible solution for the summer optimization compared to that for the winter optimization. The results of the load distribution by equipment on a typical summer day are shown in Figure 10.

FIGURE 9. Set of Pareto solutions optimized during the second-stage. The optimized Pareto feasible solution sets for a typical summer day obtained in the second stage of the operation strategy are shown in (A). The optimized Pareto feasible solution sets for a typical winter day obtained in the second stage of the operation strategy are shown in (B).
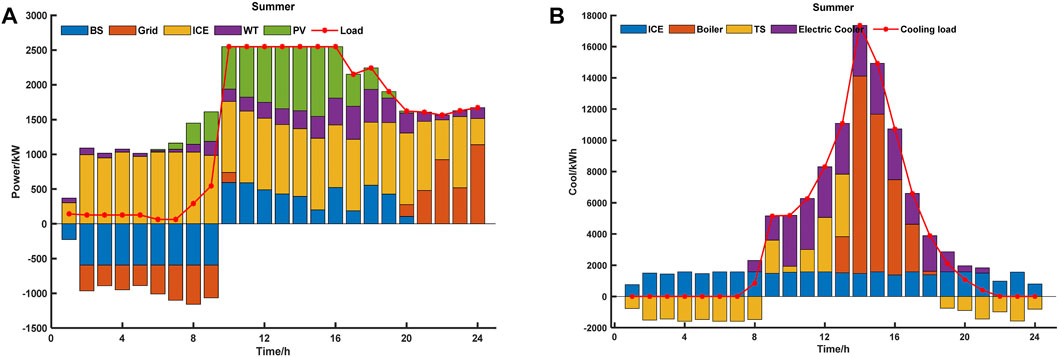
FIGURE 10. Results of load distribution by equipment on a typical summer day. The results of the load distribution by equipment on a typical summer day are shown in Figure. Figure (A) shows the distribution of electrical load in typical summer day; (B) shows the distribution of cooling load in typical summer day.
On a typical summer day (Figure 10A), the electric load and price of electricity were low, and the battery was used to store the electricity generated by the ICE, which could achieve peak load shifting. The cooling load demand was highest around 12:00 h on a typical summer day (Figure 10B). Owing to the lower cost of the gas boiler, absorption chillers mostly absorb heat from the gas boiler to provide the cooling load. The results of the load distribution by equipment on a typical winter day are shown in Figure 11.
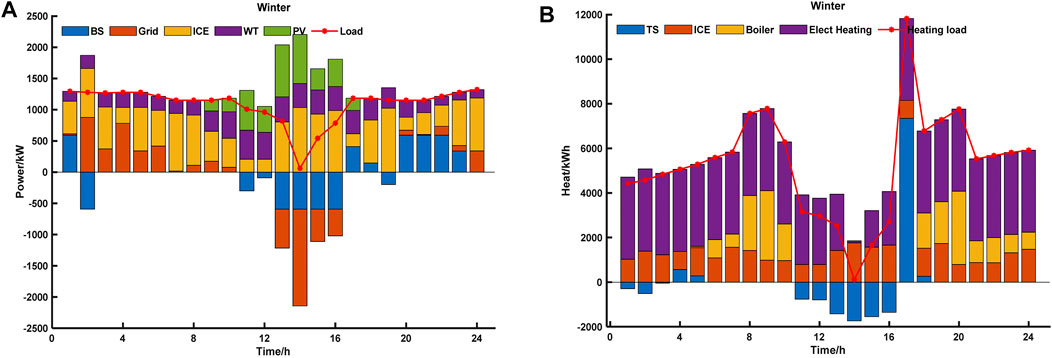
FIGURE 11. Results of load distribution by equipment on a typical winter day. The results of the load distribution by equipment on a typical winter day are shown in Figure. (A) shows the distribution of electrical load in typical winter day; (B) shows the distribution of heating load in typical winter day.
On a typical winter day (Figure 11A, the required electric load was less, and the power generated by the ICE and PV was mainly stored in the storage equipment, to achieve the peak load shifting. On a typical winter day (as seen in Figure 11B), the heating load was low, and the heating load generated by the ICE and electric heating equipment was mainly stored in the storage equipment, to meet the high heating load during the rest of the day. The system optimization results are listed in Table 4.
Compared with the existing energy supply system of the greenhouse, the average daily economic cost of the CCHP was USD 5937.89 and the ERR was 49.53% after the first stage optimization design. After the second stage of optimization design, the total annual OSR, ERR, and PESR for a typical summer day was 39.51, 48.88, and 27.57%, respectively, and the OSR, ERR, and PESR for a typical winter day was 52.96, 50.18, and 50.13%, respectively. These data emphasize the unique advantages of the two-stage method applied to the IESS for the optimization of energy consumption of the greenhouse. It can further reduce the comprehensive cost of the enterprise and improve the economic and environmental protection index of the system; therefore, the proposed method has practical applicability and advantages.
6 Conclusion
In this study, we propose a two-stage collaborative optimization design method for the integrated energy supply system of agricultural greenhouses. We have combined Energy Plus and MATLAB simulation software to enhance the matching of this complex nonlinear system in different stages of design and operation. This improves the overall economy, saves energy, and offers environmental protection. We use a combination of the key equipment output optimization and dynamic adjustment of operating parameters, to make the system operation more suitable for the load characteristics of agricultural greenhouses and the use of a higher percentage of renewable energy.
Greenhouse energy supply systems are difficult to control, resulting in high greenhouse energy consumption and difficult load analysis. Therefore, we constructed an integrated energy supply system consisting of a CCHP and an ASHP. We used this system to supply energy to the greenhouse.
The use of a higher proportion of renewable energy deepens the coupling relationship between capacity configuration and operation strategy of the core equipment of the system. In addition, it becomes difficult to find the optimal operation strategy. Therefore, we proposed a two-stage synergistic optimization design method of integrated energy supply system, based on C-NSGA-II algorithm. This would optimize the design of capacity configuration and the operation strategy of the integrated energy supply system. In the first stage, the optimization objectives are “minimum average daily economic cost” and “maximum CO2 emission reduction rate”. The optimal capacity of each equipment of the integrated energy supply system is optimized using the optimized design results in the second stage. In the second stage, the optimization objectives are “maximum annual operating saving rate”, “maximum CO2 emission reduction rate”, and “maximum primary energy saving rate”. The capacity of the equipment designed in the first stage is used as the constraint to further optimize the design of the optimal operation strategy of the integrated energy supply system.
A greenhouse was used as a prototype. We carried out an arithmetic study on two typical days, summer and winter, respectively, considering the actual crop characteristics. We used the IESS, for the energy supply, and the two-stage optimization design. After the first stage of optimized design, compared to the existing greenhouse energy supply systems, the average daily operating cost was significantly lower and the CO2 emission reduction rate was 49.53%. After the second stage, compared to the existing greenhouse energy supply systems, the annual operating saving rate, the CO2 emission reduction rate, and the primary energy saving rate were 39.51, 48.88, and 27.57% for the typical summer day and 52.96, 50.18, and 50.13% for the typical winter day, respectively. Therefore, the proposed method can effectively alleviate the high energy consumption, improve the energy utilization efficiency, reduce the cost of enterprises, and lower CO2 emissions. In addition, it enables the system to feed the energy back into the grid to help peak load shifting through peak electricity consumption. This further emphasizes the advancement of the proposed method.
Data Availability Statement
The original contributions presented in the study are included in the article/Supplementary Material, further inquiries can be directed to the corresponding author.
Author Contributions
CT: Funding acquisition, Conceptualization, ZS: Software, Conceptualization, Writing- Original draft preparation, Data Curation, RW: Software, Data Curation, YY: Conceptualization, Methodology, Writing- Original draft preparation, Software, XW: Software, Writing- Original draft preparation, AR: Writing- Original draft preparation.
Funding
This work was supported by the Natural Science Foundation of Shandong Province (No. ZR2019MF053).
Conflict of Interest
RW was employed by the State Grid Shandong Integrated Energy Services CO., LTD. AR was employed by the Jinan Power Supply Company.
The remaining authors declare that the research was conducted in the absence of any commercial or financial relationships that could be construed as a potential conflict of interest.
Publisher’s Note
All claims expressed in this article are solely those of the authors and do not necessarily represent those of their affiliated organizations, or those of the publisher, the editors, and the reviewers. Any product that may be evaluated in this article, or claim that may be made by its manufacturer, is not guaranteed or endorsed by the publisher.
References
Ahmad, B., Mehdi, M., Barat, G., Hadi, P., and Fatemeh, K. (2021). Energy Analysis and Assessing Heating and Cooling Demands of Closed Greenhouse in Iran. Therm. Sci. Eng. Prog. 25, 101042. doi:10.1016/j.tsep.2021.101042
Das, B. K., Al-Abdeli, Y. M., and Kothapalli, G. (2018). Effect of Load Following Strategies, Hardware, and thermal Load Distribution on Stand-Alone Hybrid CCHP Systems. Appl. Energ. 220, 735–753. doi:10.1016/j.apenergy.2018.03.068
Gao, L., Hwang, Y., and Cao, T. (2019). An Overview of Optimization Technologies Applied in Combined Cooling, Heating and Power Systems. Renew. Sust. Energ. Rev. 114, 109344. doi:10.1016/j.rser.2019.109344
Ghersi, D. E., Amoura, M., Loubar, K., Desideri, U., and Tazerout, M. (2021). Multi-objective Optimization of CCHP System with Hybrid Chiller under New Electric Load Following Operation Strategy. Energy 219, 119574. doi:10.1016/j.energy.2020.119574
Jia, J., Chen, H., Liu, H., Ai, T., and Li, H. (2021). Thermodynamic Performance Analyses for CCHP System Coupled with Organic Rankine Cycle and Solar thermal Utilization under a Novel Operation Strategy. Energ. Convers. Manage. 239, 114212. doi:10.1016/j.enconman.2021.114212
Jung, D.-H., Kim, H. S., Jhin, C., Kim, H.-J., and Park, S. H. (2020). Time-serial Analysis of Deep Neural Network Models for Prediction of Climatic Conditions inside a Greenhouse. Comput. Electron. Agric. 173, 105402. doi:10.1016/j.compag.2020.105402
Kang, L., Wu, X., Yuan, X., Ma, K., Wang, Y., Zhao, J., et al. (2021). Influence Analysis of Energy Policies on Comprehensive Performance of CCHP System in Different Buildings. Energy 233, 121159. doi:10.1016/j.energy.2021.121159
Kang, L., Yang, J., An, Q., Deng, S., Zhao, J., Li, Z., et al. (2017). Complementary Configuration and Performance Comparison of CCHP-ORC System with a Ground Source Heat Pump under Three Energy Management Modes. Energ. Convers. Manage. 135, 244–255. doi:10.1016/j.enconman.2016.12.055
Li, L., Yu, S., Mu, H., and Li, H. (2018). Optimization and Evaluation of CCHP Systems Considering Incentive Policies under Different Operation Strategies. Energy 162, 825–840. doi:10.1016/j.energy.2018.08.083
Li, N., Zhao, X., Shi, X., Pei, Z., Mu, H., and Taghizadeh-Hesary, F. (2021). Integrated Energy Systems with CCHP and Hydrogen Supply: A New Outlet for Curtailed Wind Power. Appl. Energ. 303, 117619. doi:10.1016/j.apenergy.2021.117619
Li, Y., Tian, R., Wei, M., Xu, F., Zheng, S., Song, P., et al. (2020). An Improved Operation Strategy for CCHP System Based on High-Speed Railways Station Case Study. Energ. Convers. Manage. 216, 112936. doi:10.1016/j.enconman.2020.112936
Lin, D., Wei, R., and Xu, L. (2019). An Integrated Yield Prediction Model for Greenhouse Tomato. Agronomy 9, 873. doi:10.3390/agronomy9120873
Lin, D., Zhang, L., and Xia, X. (2020). Hierarchical Model Predictive Control of Venlo-type Greenhouse Climate for Improving Energy Efficiency and Reducing Operating Cost. J. Clean. Prod. 264, 121513. doi:10.1016/j.jclepro.2020.121513
Liu, M., Shi, Y., and Fang, F. (2013). Optimal Power Flow and PGU Capacity of CCHP Systems Using a Matrix Modeling Approach. Appl. Energ. 102, 794–802. doi:10.1016/j.apenergy.2012.08.041
Lombardo, W., Sapienza, A., Ottaviano, S., Branchini, L., De Pascale, A., and Vasta, S. (2021). A CCHP System Based on ORC Cogenerator and Adsorption Chiller Experimental Prototypes: Energy and Economic Analysis for NZEB Applications. Appl. Therm. Eng. 183, 116119. doi:10.1016/j.applthermaleng.2020.116119
Ma, W., Fang, S., and Liu, G. (2017). Hybrid Optimization Method and Seasonal Operation Strategy for Distributed Energy System Integrating CCHP, Photovoltaic and Ground Source Heat Pump. Energy 141, 1439–1455. doi:10.1016/j.energy.2017.11.081
Mazzeo, D., Matera, N., Cornaro, C., Oliveti, G., Romagnoni, P., and De Santoli, L. (2020). EnergyPlus, IDA ICE and TRNSYS Predictive Simulation Accuracy for Building thermal Behaviour Evaluation by Using an Experimental Campaign in Solar Test Boxes with and without a PCM Module. Energy and Buildings 212, 109812. doi:10.1016/j.enbuild.2020.109812
Ren, F., Wei, Z., and Zhai, X. (2021). Multi-objective Optimization and Evaluation of Hybrid CCHP Systems for Different Building Types. Energy 215, 119096. doi:10.1016/j.energy.2020.119096
Ro, S., Chea, L., Ngoun, S., Stewart, Z. P., Roeurn, S., Theam, P., et al. (2021). Response of Tomato Genotypes under Different High Temperatures in Field and Greenhouse Conditions. Plants (Basel) 10, 10. doi:10.3390/plants10030449
Song, Z., Liu, T., and Lin, Q. (2020a). Multi-objective Optimization of a Solar Hybrid CCHP System Based on Different Operation Modes. Energy 206, 118125. doi:10.1016/j.energy.2020.118125
Song, Z., Liu, T., Liu, Y., Jiang, X., and Lin, Q. (2020b). Study on the Optimization and Sensitivity Analysis of CCHP Systems for Industrial Park Facilities. Int. J. Electr. Power Energ. Syst. 120, 105984. doi:10.1016/j.ijepes.2020.105984
Tian, X., Deng, S., Kang, L., Zhao, J., and An, Q. (2018). Study on Heat and Power Decoupling for CCHP System: Methodology and Case Study. Appl. Therm. Eng. 142, 597–609. doi:10.1016/j.applthermaleng.2018.07.040
Vadiee, A., and Martin, V. (2013). Energy Analysis and Thermoeconomic Assessment of the Closed Greenhouse - the Largest Commercial Solar Building. Appl. Energ. 102, 1256–1266. doi:10.1016/j.apenergy.2012.06.051
Wang, J.-J., Xu, Z.-L., Jin, H.-G., Shi, G.-h., Fu, C., and Yang, K. (2014). Design Optimization and Analysis of a Biomass Gasification Based BCHP System: A Case Study in Harbin, China. Renew. Energ. 71, 572–583. doi:10.1016/j.renene.2014.06.016
Wang, J., Liu, Y., Ren, F., and Lu, S. (2020). Multi-objective Optimization and Selection of Hybrid Combined Cooling, Heating and Power Systems Considering Operational Flexibility. Energy 197, 117313. doi:10.1016/j.energy.2020.117313
Wegener, M., Isalgue, A., Malmquist, A., Martin, A., Santarelli, M., Arranz, P., et al. (2021). Exergetic Model of a Small-Scale, Biomass-Based CCHP/HP System for Historic Building Structures. Energy Convers. Manag. X 12, 100148. doi:10.1016/j.ecmx.2021.100148
Wegener, M., Malmquist, A., Isalgue, A., Martin, A., Arranz, P., Camara, O., et al. (2020). A Techno-Economic Optimization Model of a Biomass-Based CCHP/heat Pump System under Evolving Climate Conditions. Energ. Convers. Manage. 223, 113256. doi:10.1016/j.enconman.2020.113256
Wegener, M., Malmquist, A., Isalgué, A., and Martin, A. (2018). Biomass-fired Combined Cooling, Heating and Power for Small Scale Applications - A Review. Renew. Sust. Energ. Rev. 96, 392–410. doi:10.1016/j.rser.2018.07.044
Wen, Q., Liu, G., Wu, W., and Liao, S. (2022). Performance Evaluation of Distributed Energy System Integrating Photovoltaic, Ground Source Heat Pump, and Natural Gas-Based CCHP. Energ. Convers. Manage. 252, 115039. doi:10.1016/j.enconman.2021.115039
Yan, R., Lu, Z., Wang, J., Chen, H., Wang, J., Yang, Y., et al. (2021). Stochastic Multi-Scenario Optimization for a Hybrid Combined Cooling, Heating and Power System Considering Multi-Criteria. Energ. Convers. Manage. 233, 113911. doi:10.1016/j.enconman.2021.113911
Yan, Y., Zhang, C., Li, K., and Wang, Z. (2018). An Integrated Design for Hybrid Combined Cooling, Heating and Power System with Compressed Air Energy Storage. Appl. Energ. 210, 1151–1166. doi:10.1016/j.apenergy.2017.07.005
Zhang, L., Zhang, L., Sun, B., Zhang, C., and Li, F. (2020). Nested Optimization Design for Combined Cooling, Heating, and Power System Coupled with Solar and Biomass Energy. Int. J. Electr. Power Energ. Syst. 123, 106236. doi:10.1016/j.ijepes.2020.106236
Zhang, Y., Yang, K., Li, X., and Xu, J. (2013). The Thermodynamic Effect of thermal Energy Storage on Compressed Air Energy Storage System. Renew. Energ. 50, 227–235. doi:10.1016/j.renene.2012.06.052
Zhao, H., Wang, X., Wang, Y., Li, B., and Lu, H. (2021). A Dynamic Decision-Making Method for Energy Transaction price of CCHP Microgrids Considering Multiple Uncertainties. Int. J. Electr. Power Energ. Syst. 127, 106592. doi:10.1016/j.ijepes.2020.106592
Glossary
IESS integrated energy supply system
CCHP combined cooling, heating, and power
PGU power generator unit
PV photovoltaic
ORC organic Rankine cycle
FEL following electrical load
FTL following thermal load
WT wind turbine
ICE internal combustion engine
PWT output power of WT
Pr rated power of WT
v actual outdoor wind speed
vr rated wind speed of WT
vin cut-in wind speed of WT
vout cut-out wind speed of WT
PPV output power of PV
I illumination intensity
PSTC maximum test power of PV
k power temperature coefficient of PV
TPV temperature of PV
T0 outdoor temperature
PLR part load rate
GICE amount of biomass gas consumed by the ICE
EICE amount of electricity generated by the ICE
ηpe efficiency of electricity generation
ηte efficiency of heat generation
Qre recoverable heating of ICE
Qjw waste heating of the cylinder sleeve water
ηjw efficiency of cylinder sleeve water heating exchanger
Qexh waste heating of the flue gas heating exchanger
ηexh efficiency of flue gas heating exchanger
Qloss lost heating
Qb heat capacity of gas boiler
Fb biomass gas volume of gas boiler
LNG biogas gas calorific value
ηb heating efficiency of gas boiler
Qac supplied cool capacity of absorption refrigerator
Qac_in input heat of absorption refrigerator
COPac energy efficiency rate of absorption chiller
EBT remaining capacity of the battery
PBT,charge average power of the battery charging
PBT,discharge average power of the battery discharging
ηcharge charging efficiency of the battery
EPV power generation of PV
EWT power generation of WT
Egrid system-grid interaction
EL electric load required
EBT,charge production of battery
Qh,L heating load required
Qc,L cooling load required
Cr average daily economic cost
Ci,var daily operating cost
Ccap daily acquisition cost
N capacity of equipment
Ci unit acquisition cost
r conversion factor
Ti lifespan of equipment
C O2ECCHP total CO2 emission of the CCHP system
µg CO2 emissions factors of biomass gas
µe CO2 emission factors for grid generation
Ggas amount of biomass gas consumed
C O2E CO2 emissions of the existing greenhouse energy supply system
COSR total annual operation saving rate
C cost of the existing greenhouse energy supply system
CCCHP cost of the CCHP system
Cgrid cost of electric purchased from the grid
Cgas cost of biomass gas
Ccom operation and maintenance cost
cgrid grid electric price
cgas biomass gas unit price
Pgrid power purchased from the grid
GCCHP primary energy consumed by the system
Ge,CCHP converted energy consumption of the CCHP
Gb amount of biomass gas consumed by the gas boiler
GICE amount of biomass gas consumed by the gas generator
ηe,grid power plant generation efficiency.
ηtr Grid Transmission Efficiency
FERR maximum CO2 emissions reduction rate
NWT configured capacity of WT
NPV configured capacity of PV
NICE configured capacity of ICE
Nhp,h heating capacity of ASHP
Nhp,c cooling capacity of ASHP
NBT configured capacity of battery
NPV,max maximum capacity of PV
NICE,max maximum capacity of ICE
Nhp,h,max maximum heating capacity of ASHP
Nhp,c,max maximum cooling capacity of ASHP
NBT,max maximum capacity of battery
NBT,min minimum capacity of battery
HVAC heating, ventilation, and air conditioning
ERR emissions reduction rate
PESR primary energy saving rate
OSR cost saving rate
Keywords: greenhouse, combined cooling heating and power (CCHP), energyplus, two-stage optimization design, C-NSGA-II, integrated energy supply system (IESS)
Citation: Tian C, Shao Z, Wang R, Yan Y, Wang X and Ren A (2022) Optimal Design of Integrated Energy Supply System for Continuous Greenhouse Effect: A Study on Carbon Emission and Operational Cost. Front. Energy Res. 10:819420. doi: 10.3389/fenrg.2022.819420
Received: 02 December 2021; Accepted: 24 January 2022;
Published: 23 February 2022.
Edited by:
Amjad Anvari-Moghaddam, Aalborg University, DenmarkReviewed by:
Fubin Yang, Beijing University of Technology, ChinaRosaria Volpe, University of Catania, Italy
Copyright © 2022 Tian, Shao, Wang, Yan, Wang and Ren. This is an open-access article distributed under the terms of the Creative Commons Attribution License (CC BY). The use, distribution or reproduction in other forums is permitted, provided the original author(s) and the copyright owner(s) are credited and that the original publication in this journal is cited, in accordance with accepted academic practice. No use, distribution or reproduction is permitted which does not comply with these terms.
*Correspondence: Yi Yan, eWFueWkxOUBzZGp6dS5lZHUuY24=
 Chongyi Tian1
 Yi Yan