 Jie Sun1
 Hui Jin
 Fu-Sheng Tsai
 Mihajlo Jakovljevic
- 1Graduate School of Global Environmental Studies, Kyoto University, Kyoto, Japan
- 2School of Economics and Management, Zhejiang Sci-Tech University, Hangzhou, China
- 3North China University of Water Resources and Electric Power, Zhengzhou, China
- 4Department of Business Administration, Cheng Shiu University, Kaohsiung, Taiwan
- 5Center for Environmental Toxin and Emerging-Contaminant Research, Cheng Shiu University, Kaohsiung, Taiwan
- 6Super Micro Mass Research and Technology Center, Cheng Shiu University, Kaohsiung, Taiwan
- 7Department Global Health Economics and Policy, University of Kragujevac, Kragujevac, Serbia
- 8Institute of Comparative Economic Studies, Hosei University Faculty of Economics, Tokyo, Japan
Sustainable development and its assessment have increasingly played a key background role in government policymaking across the world. Generally, sustainable development is defined as the coordination of economic, environmental, and social development in order to balance intra-generational welfare and maximize inter-generational overall welfare. Therefore, the purpose of our research is to assess national sustainable development from the perspective of integrating economic, environmental, and social dimensions, and then to better monitor the status of sustainable development. We first adopt and modify the National Sustainable Development Index, which has been proposed as a way to amend the Human Development Index, including 12 indicators (weighted by the Entropy Method) in economic, environmental, and social dimensions. After that, we assess the sustainable development status of 179 countries from 2010 to 2016. The result shows that there is no obvious trend of narrowing the gap in sustainable development levels among countries, or even an expanding trend in this period. We also make a comparison between the original NSDI and our modified NSDI and find that the modified NSDI not only retains the merits but also makes up for the shortcomings of the original one in acceptability, reliability, and continuity.
Introduction
Governments and researchers have had the tendency to investigate and monitor the progress of sustainability ever since the UN 2030 Agenda and Sustainable Development Goals (SDGs) were adopted by all 193 member states (Hametner and Kostetckaia, 2020). This action turns out to be necessary in terms of constructing a composite index system (Alaimo and Maggino, 2020), which serves as the tool to evaluate national sustainable development, basically because it, on the one hand, unfolds a comprehensive picture of sustainability and, on the other hand, supports governments in putting the public policies into practice (Jin et al., 2020).
As reviewed in the next section, a list of sustainable development indices has been proposed for sustainability assessment, but these indices have limitations in three aspects. First, some indexes contain too many indicators to measure sustainability for most countries due to data restrictions (Jin et al., 2020). For example, Li et al. (2014) (Li et al., 2014) built the Human Green Development Index (HGDI) by including 12 indicators in socioeconomic and resource environment dimensions, which can well represent sustainable development, but the HGDI is unable to measure sustainability for many countries because of the unavailability of data, especially for some developing countries. Second, some indices have simple structures and low data requirements, which can measure sustainability for most countries but cannot effectively represent sustainable development. The Human Development Index (HDI) is widely used as a sustainability assessment index simply because of its concise composition and connotation (Bilbao-Ubillos, 2013). However, it is also criticized for not being “strict” enough as it fails to present indicators in environmental and resource dimensions (Bravo, 2014; Hickel, 2019). Third, the popular weighing methods reported in the literature include “equal weights,” “expert weights,” and “factor analysis,” but these methods have limitations in varying degrees. The first two methods are criticized for their lack of objectivity (Li et al., 2014; Wang et al., 2019), and the third method can only estimate weights if correlation exists between indicators (Khalid et al., 2020).
In order to make a breakthrough or progress on the above issues, the National Sustainable Development Index (NSDI) is proposed as a way to amend the HDI (Jin et al., 2020). The NSDI includes 12 indicators in economic, social, and environmental dimensions, which are built as an improvement index of HDI. Like many other well-known improvement indices of HDI, such as HSDI (Bravo, 2014), HGDI (Li et al., 2014), and SDI (Hickel, 2019), NSDI is built by adding indicators in the environment and resource dimensions to the HDI. But the difference is that NSDI measures the weight of each indicator with the entropy method, which is based on the idea of entropy from basic information theory. This method is objective compared with the traditional equal weight method or expert weight method (Ma et al., 2015). Therefore, NSDI is considered as a scientific and acceptable index that has been used as a dependent variable in empirical research (Jin and Martinez-Vazquez, 2021).
However, there is an obvious demerit to NSDI. The NSDI includes “drinking water” and “sanitation” which are respectively measured by “population using improved drinking water sources (%)” and “population using improved sanitation facilities (%),” but the data for these two indicators are counted every 5 years, such as 2010 and 2015. It means that NSDI can only be measured once every 5 years, which means it could not be used for annual continuous monitoring of national sustainable development.
Therefore, this study not only aims to assess national sustainable development globally but also to modify the NSDI to make up for its demerit and then propose a more continuous and acceptable index, so as to better monitor the status of sustainability. First, this study helps strengthen the public and academic understanding of sustainable development. Admittedly, there are many studies investigating the environmental dimension of sustainable development yet failing to recognize the core of sustainable development, that is, comprehensive and coordinated development involving economic, environmental, and social dimensions (Jin et al., 2020). Second, we propose a modified NSDI to make up for some demerits of the original one and enhance its acceptability, continuity, and reliability, which represents a small step ahead of the other existing indices. The two sub-indicators in the original NSDI can only be measured once every 5 years, which means the original one can only be measured once every 5 years, such as 2005, 2010, and 2015, while the modified one can be measured every year.
The following will be categorized into five sections. Section 2 is a literature review. Section 3 describes the NSDI and its modification, as well as the data source and the entropy method. Section 4 presents the result. Section 5 compares the NSDI with the modified NSDI. Section 6 concludes.
Literature Review
The Concept of Sustainable Development
The concept of sustainable development has its origins in ecology; however, it has been justified as a more comprehensive concept involving economics, sociology, and environmental science. Sustainable development has come under the spotlight in academia ever since the Our Common Future reported in Brundtland Commission (World Commission on Environment and Development-WCED, 1987). That report theoretically updated the definition specifically that sustainable development now refers to the development that meets the needs of the present generation without compromising the needs of the future generation. It could be reckoned as the first definition of sustainable development, considering its first emphasis on intergenerational and ecologically oriented aspects (Alaimo and Maggino, 2020). Although the concept of sustainable development derives from ecology, it has brought together many other disciplines such as sociology, economics, and environmental science (Ramos and Caeiro, 2010; Bolcárová and KološTa, 2015). As Guillén-Royo (2016) pointed out, sustainable development requires action in three aspects through development policies that promote economic growth, promote social equality, and reduce negative environmental impacts. Similarly, Kwatra et al. (2020) (Kwatra et al., 2020) put forward that sustainable development is a multi-dimensional concept that highlights the integration and dynamic balance among economic, social, and environmental domains to ensure inter- and intragenerational equity. Overall, the definition of sustainable development varies among researchers, although it has now acknowledged to be the cross-cutting concept with respect to economy, society, and environment (Goodland and Daly, 1996). As Jin et al. (2020) have concluded, sustainable development is to coordinate economic, social, and environmental development, hence to balance the intra-generational welfare and then maximize the total welfare of generations (Jin et al., 2020).
Indices for Sustainable Development Assessment
Sustainable development has stirred a fervent debate worldwide and gained momentum in academia after the updated concept was put forward. Recently, a growing number of researchers have been delving into building a composite index for sustainability assessment. There are such pioneering and classic examples like the Index of Sustainable Economic Welfare (Cobb, 1989; Cobb and Cobb, 1994), ecological footprint (Wackernagel and Rees, 1997), Environmental Sustainability Index (Esty et al., 2005), and Environmental Performance Index (Esty et al., 2006). In addition, many widely cited sustainable development indices are constructed by international organizations, such as the UN’s Sustainable Development Goals Index (United Nations (UN), 2019) and the United Nations Development Program’s (United Nations Development Programme (UNDP), 2004) Human Development Index (HDI).
The Human Development Index (HDI) is the one of the most widely used and referenced indices (Estoque and Murayama, 2014). It has gained popularity because of its simple composition, representative sub-indicators, and rich connotation (Hickel, 2019). Specifically, it consists of three equal weighted indicators: income, life expectancy, and education. However, it is also criticized for not being “strict” enough as it fails to present indicators in environmental and resource dimensions (Türe, 2013; Bravo, 2014).
Some sustainable development indexes were built based on the HDI by adding indicators of resources and the environment, such as the Human Sustainable Development Index (HSDI) constructed by Bravo (2014) (Bravo, 2014), the Human Green Development Index (HGDI) by Li et al. (2014), and the National Sustainable Development Index (NSDI) by Jin et al. (2020) (Jin et al., 2020). HSDI, HGDI, and NSDI are all taken as “modified indices” or improved schemes of the HDI, but they are quite different in composition and connotation. Among these modified indices of HDI, NSDI is considered a relatively comprehensive indicator and more in line with the concept of sustainable development (Jin and Martinez-Vazquez, 2021).
Methods and Data
The Framework and Modification of NSDI
Jin et al. (2020) put forward the NSDI with 12 indicators in economic, social, and environmental dimensions based on the concept of sustainable development. Sustainable development is to coordinate economic, social, and environmental development and to balance intra-generational welfare so as to maximize the total welfare of generations (Guillén-Royo, 2016; Kwatra et al., 2020). So, the government should set a sustainable development goal in a comprehensive way, including the three dimensions (Goodland and Daly, 1996).
However, as Introduction has mentioned, the NSDI has an obvious demerit that makes it impossible to measure sustainability annually. Jin et al. (2020) measure the “drinking water” and “sanitation,” respectively, by “population using improved drinking water sources (%)” and “population using improved sanitation facilities (%).” But the data for the two indicators are accounted every 5 years, like 2005 and 2010, which means the NSDI can only be measured once every 5 years. It brings three issues: 1) the NSDI is unable to monitor national sustainable development annually; 2) information loss in the process of sustainability assessment; 3) can not be used for annual panel data analysis, which will restrict the further empirical research.
Therefore, it is necessary to modify and improve the NSDI to better monitor and evaluate sustainability. As Khalid et al. (2020) have pointed out, data shortage is an important reason why many sustainable development indices cannot be effectively measured and compared. So, the data issue of NSDI must be addressed. This study makes the “drinking water” and “sanitation,” respectively, measured by “population using at least basic drinking water sources (%)” and “population using at least basic sanitation facilities (%),” as shown in the bottom two rows of Table 1. We adopt these two indicators because 1) they are accounted for once a year and the annual measurement of NSDI can be guaranteed; and 2) basic drinking water sources and sanitation facilities can better reflect the basic needs of humans for public health and the environment. Finally, we propose a modified NSDI based on the original one (see Table 1).
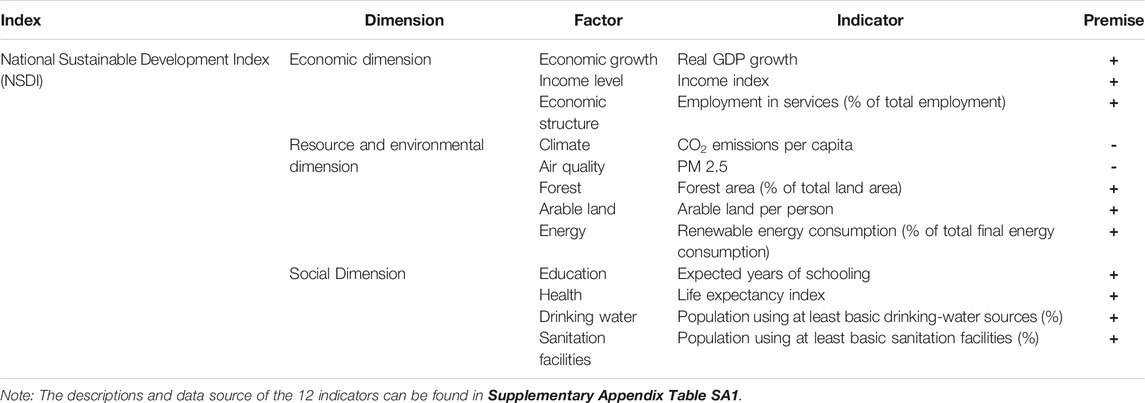
TABLE 1. Framework of National Sustainable Development Index.
Normalization
Normalization is a necessary step before the 12 indicators are aggregated into a composite index. There are many kinds of normalization methods, such as “ranking,” “distance to target,” “Z-Score,” and “min-max” (Nardo et al., 2005; Pollesch and Dale, 2016). We adopt the min-max method for normalization because it is simple, mature, and widely used (Bravo, 2014; Khalid et al., 2020). According to the min-max method, we divide the 12 indicators into positive indicators and negative indicators (as shown in the last column of Table 1). Positive indicators are those whose increasing values represent better performance in sustainable development, such as income level and forest area, and negative indicators are the ones whose lower values represent better performance, such as CO2 emissions per capita. The min-max normalization formula for positive and negative indexes is shown in Eqs. 1, 2, respectively.
In the aforementioned equations,
Weighting for 12 Indicators
Weighting is another important step to aggregate all the indicators into a sustainable development index. There are some popular weighting methods presented in the literature, such as equal weights, factor analysis, expert weights, and the entropy method (Li et al., 2014; Jin et al., 2020; Khalid et al., 2020). But these methods have limitations in varying degrees. For example, equal weights mean that the weights of all indicators are equal, but the importance of different indicators for sustainable development is obviously different. Similarly, the expert weights method also lacks objectivity (Li et al., 2014). And the factor analysis can only estimate weights if a correlation exists between indicators (Khalid et al., 2020). The entropy method is considered an objective weighting technique in sustainable development studies (Wang et al., 2019).
We use the entropy method to weight each indicator. The entropy method is a weighting technique based on the idea of entropy from the information theory. Specifically, information is a measure of the order degree, and entropy is a measure of the disorder degree in a system; hence, the smaller the entropy of the indicator, the more information provided by the indicator, the greater its role and weight in the comprehensive evaluation (Zhang et al., 2003; Wang et al., 2019). As Zhang et al. (2003) have pointed out, the weight measured by the entropy method represents the relative rate of change of the indicator in a composite index system, while the relative level of each indicator should be figured by the standardized value of its data. Thus, the entropy method is an objective weighting technique that makes weight judgments based on the size of the data information load. It can reduce the influence of human subjectivity on the evaluation result and makes the evaluation results more realistic (Ma et al., 2015; Wang et al., 2019).
According to the principle of the entropy method, we first normalize each index, as shown in Eqs. 1, 2. Thus, the entropy value
where n is the number of samples and the constant k depends on n.
The information utility value of indicator j,
Finally, we can get the weight of indicator j,
where the p is the number of indicators.
Threshold Establishment: Rating for Sustainability
It is also necessary to establish a threshold and distinguish these countries accordingly (Rama et al., 2020). After weighting and aggregation, we can get the National Sustainable Development Index of each country with a range from 0 to 1. First, we rank the NSDI of each country from high value to low value. The higher the NSDI, the better will be performance in sustainable development. Second, according to the ranking of the NSDI, these countries are divided into three parts. Countries whose ranking of the NSDI in is the first part, signed as a High-NSDI country. Countries with ranking of NSDI between the first and third parts signed as a medium-NSDI country. Finally, countries with ranking in the third part signed as a low-NSDI country. Many recent studies attempt to define a sustainable country through a similar rating method (Li et al., 2014; Rama et al., 2020).
Data Source and Imputation
We chose to measure the NSDI for 179 countries from 2010 to 2016 (the list of countries is shown in Table 3). These countries were selected by two criteria: 1) all countries had published the data of all 12 indicators (see Supplementary Appendix Table SA1) and 2) internationally recognized non-sovereign entities were not selected, such as Hong Kong, China. In general, the 179 selected samples include most countries and cover more than 90% of the population and land in the world.
Due to the missing data of some indicators in this period for some countries, this study adopts a different imputation method to fill in the missing data. The current studies prefer to adopt the imputation method to fill in missing data, rather than missing out information. This notion is also in tune with works by Campagnolo et al. (2018). This study adopts different imputation methods according to the actual situation. First is the mean value interpolation method. For example, if the data of 2010 and 2012 are available but the data of 2011 are missing, we use the average value of 2010 and 2012 to replace the value of 2011. This method is used to the imputation of these data: 1) the data of economic structure of Sudan in 2013, 2) the data of health of Yemen in 2013, and 3) the data of education of Afghanistan in 2012. Second is the nearest neighbor interpolation method. This method is used to deal with missing data for the variables that are very stable over time, like the arable land. This method is to the imputation of these data: the data of arable land of the United Arab Emirates, Pakistan, Sudan, Iraq, Yemen, and Central Africa in 2016. These imputations in instances can distort the results, but losing out data might prove costlier to some countries (Khalid et al., 2020).
Results
NSDI Measurement and Ranking of Each Country
This study measures the weight of 12 indicators using the entropy method (see the last column of Table 2). As a result, the weights of the economic dimension, resource–environmental dimension, and social dimension are, respectively, accounted for at 29.26, 35.26, and 35.48%. The weights of the three dimensions are very close, and the weights of the resource–environmental and social dimensions are slightly higher than those of the economic dimension. And the highest weighed factors are income level, energy and education, respectively, in each dimension. On the one hand, it means that these three factors are the most important factors for national sustainable development. On the other hand, the NSDI is a derivative index or improvement scheme of HDI, so the three indexes with the highest weight are corresponding to the HDI, which reflects that income, education, and health are the basic needs of human development (Bravo, 2014; Jin et al., 2020).
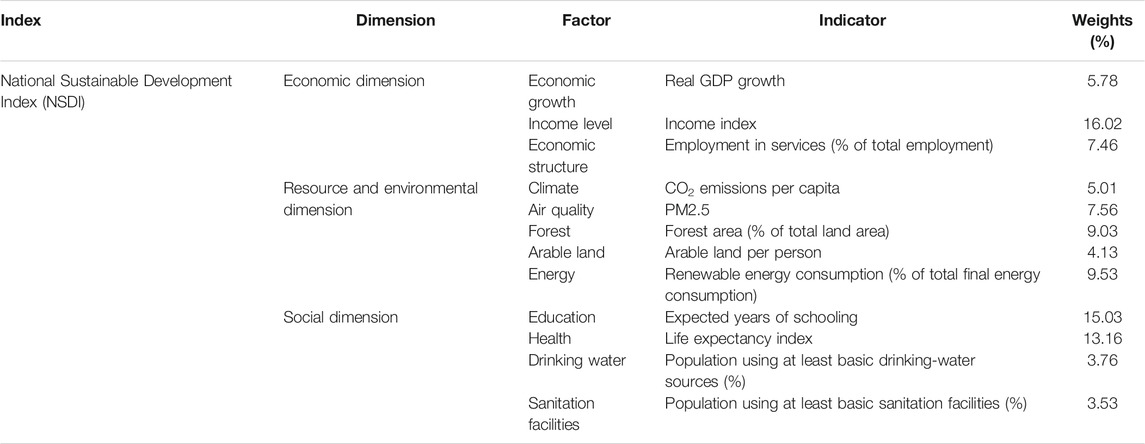
TABLE 2. Weights of 12 indicators.
According to the weights in Table 2, we aggregate the 12 indicators into the NSDI and measure the sustainability of 179 countries from 2010 to 2016 (see Table 3 and Supplementary Appendix Tables SB1, B2, and B3). As a result, countries are rated between 0 and 1. And these countries are rated as three levels, namely, high-NSDI country, medium-NSDI country, and low-NSDI country, according to their average NSDI values and rankings in this period. As the average NSDI value of each country is shown in Table 3, the top ten countries are the Netherlands (0.7892), Finland (0.7824), Iceland (0.7677), Denmark (0.7642), Sweden (0.7575), Singapore (0.7575), Austria (0.7361), Norway (0.7356), Switzerland (0.7305), and Belgium (0.7288), while the bottom ten countries are Mali (0.3598), Eritrea (0.3571), Yemen (0.3449), Sierra Leone (0.3432), Afghanistan (0.3278), Malawi (0.3058), Chad (0.2958), South Sudan (0.2926), Central Africa (0.2831), and Niger (0.2445).
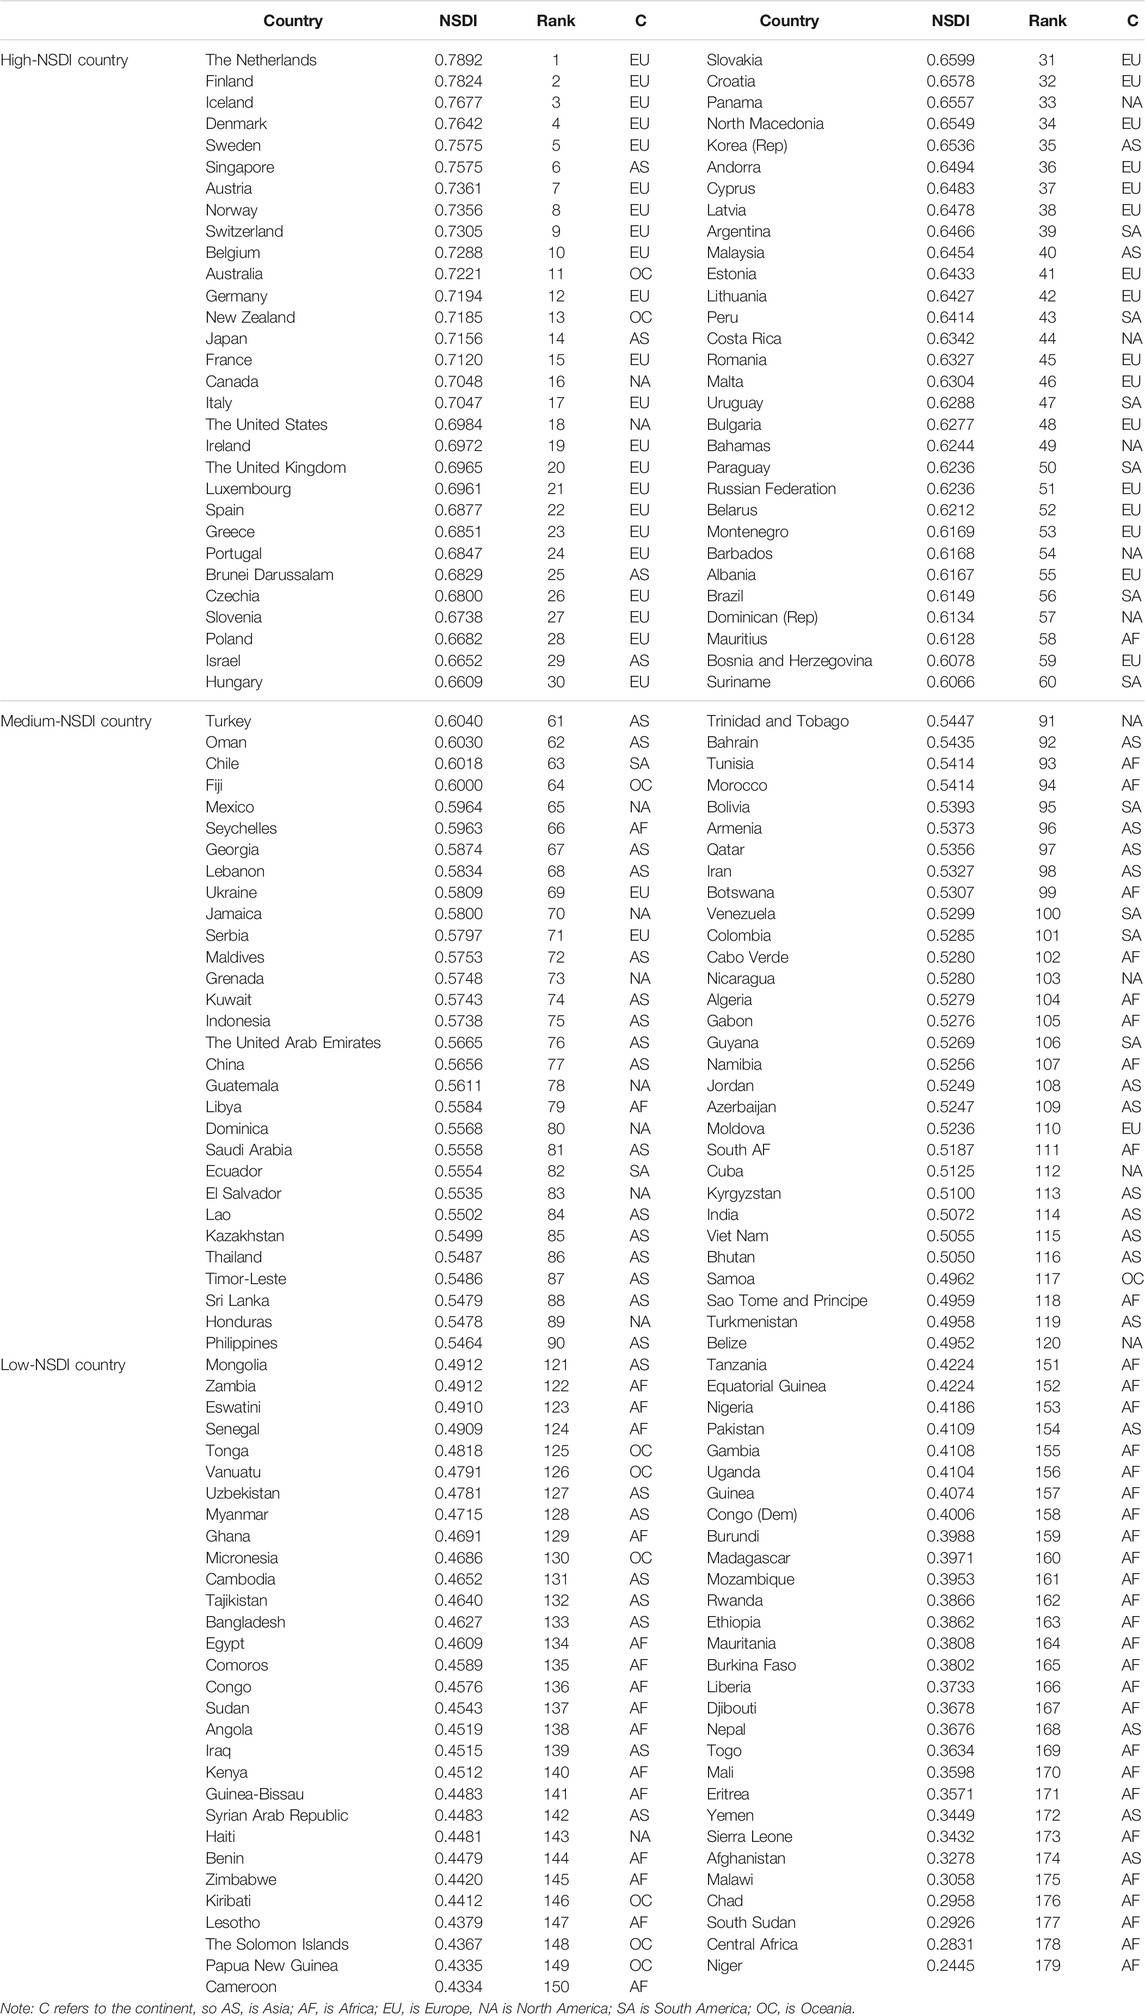
TABLE 3. The mean value of NSDI and its ranking of 179 countries from 2010 to 2016.
The ranking and rating of each country show distinct characteristics. Most of the high-NSDI countries are in Europe and North America, of which there are 38 in Europe and 7 in North America, respectively. The countries with low NSDI are mainly in Africa (39) and Asia (13). And the countries rated as medium NSDI are mainly in Asia (27), Africa (11), and North America (11). In addition, we find that all the developed countries1 are high-NSDI countries, and most of them are ranked in the top 30, while all the medium-NSDI and low-NSDI countries are developing countries.
There are three main reasons for the poor performance of sustainability in developing countries. First, the level of the economy and residents’ income is relatively low. Second, the supply of public goods and services is insufficient and inefficient, like education, public health, and environmental protection, due to poor governments or inadequate fiscal revenue (Jin and Qian, 2020). Last, some developing countries, such as China, are bombarded with such problems as inadequate management and technology of pollution control and resource utilization while still promoting economic growth at all costs, which damages national sustainable development (Jin et al., 2020).
Variations of NSDI Value and Ranking From 2010 to 2016
The variations in NSDI values and rankings reflect variations in the sustainability of these countries in 2010–2016. As the results in Table 4 and Supplementary Appendix Table SB1 show, the sustainability of 20 countries increased from 2010 to 2016, 11 countries decreased, and the rest of 19 countries remained unchanged, in these high-NSDI countries. The five countries with the highest growth rates of NSDI were Denmark (0.0302), Bosnia and Herzegovina (0.0267), Iceland (0.0266), Albania (0.0227), and Finland (0.0224), while the five countries with the largest decline in NSDI were Barbados (−0.0180), New Zealand (−0.0212), Suriname (−0.0226), Belarus (−0.0228), and Argentina (−0.0335).
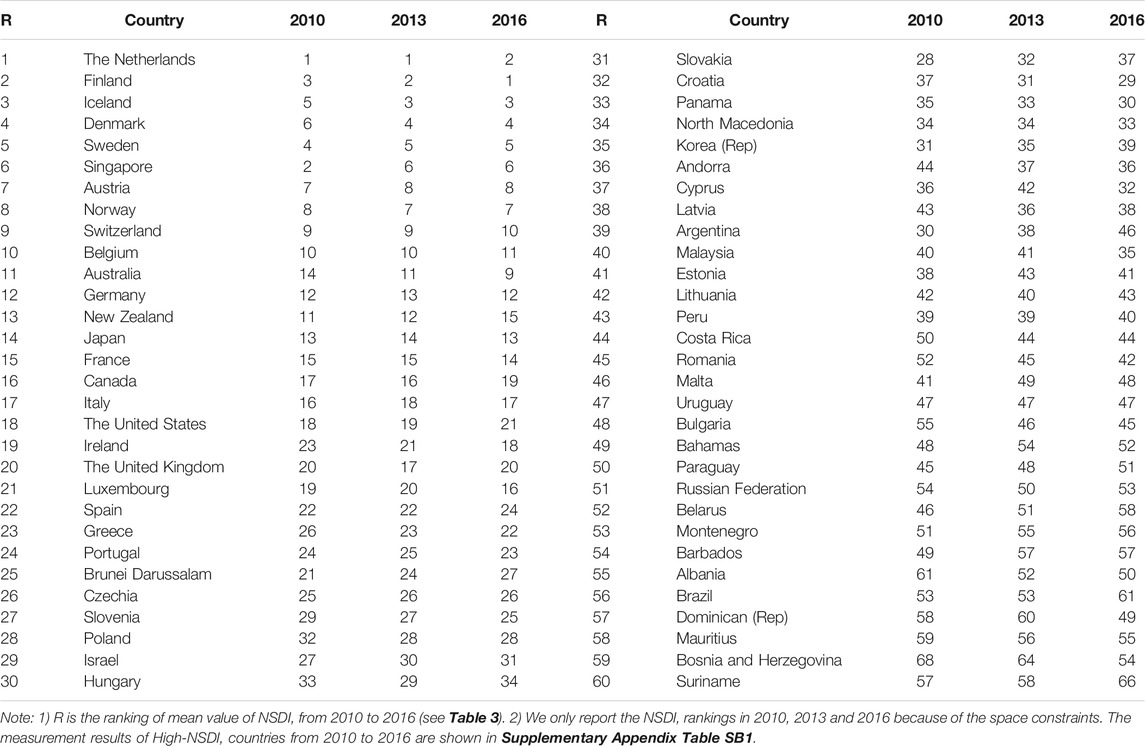
TABLE 4. The rankings of High-NSDI countries.
Table 5 and Supplementary Appendix Table SB2 report the NSDI ranking and values for medium-NSDI countries in the same period. As a result, the sustainability of 17 countries increased from 2010 to 2016, 15 countries decreased, and the rest of 18 countries remained unchanged, in these medium-NSDI countries. Among them, the five countries with the highest growth rates of NSDI were China (0.0317), Vietnam (0.024), Laos (0.0238), India (0.0225), and Iran (0.0208), while the five countries with the largest decline in NSDI were Namibia (−0.0354), Venezuela (−0.0479), Qatar (−0.0518), Timor-Leste (−0.0542), and Libya (−0.112).
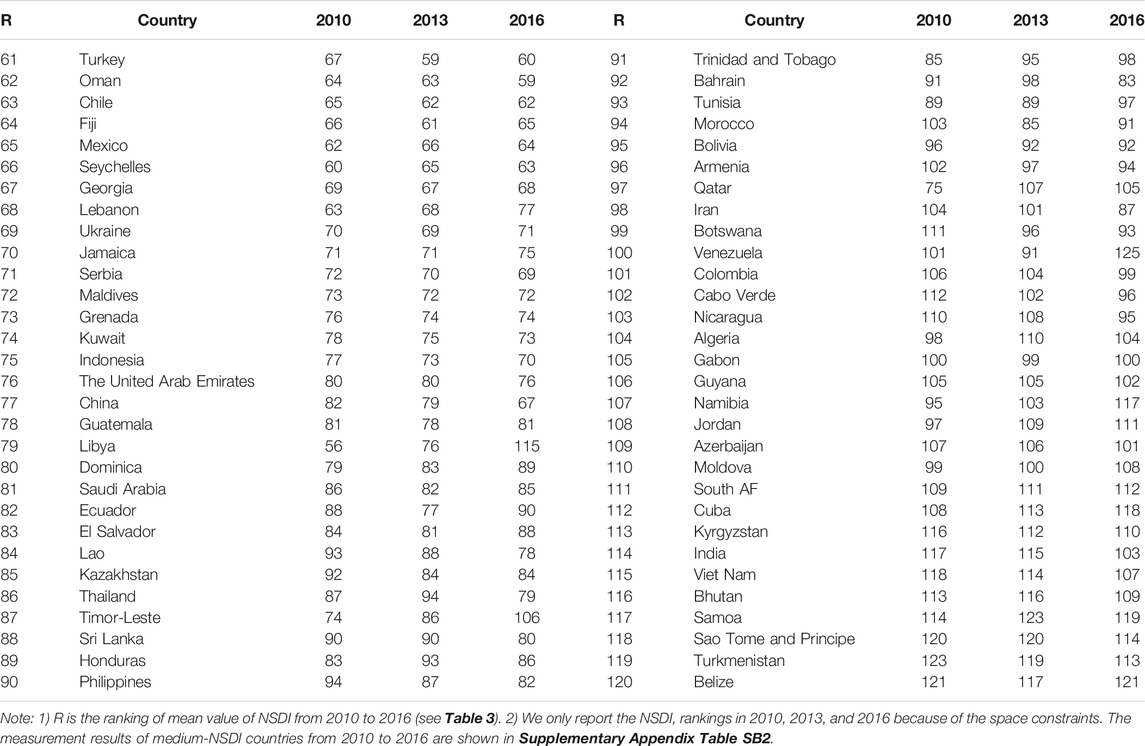
TABLE 5. Rankings of medium-NSDI countries.
The NSDI ranking and values of low-NSDI countries are presented in Table 6 and Supplementary Appendix Table SB3. As a result, the sustainability of 17 low-NSDI countries increased from 2010 to 2016, 12 ones decreased, and the rest of 20 ones remained unchanged. Among these countries, the five countries with the highest growth rates of NSDI were Cambodia (0.0288), Bangladesh (0.0276), Eswatini (0.0265), Pakistan (0.0255), and Iraq (0.0215), while the five countries with the largest decline in NSDI were Gambia (−0.0249), Nigeria (−0.0282), Chad (-0.0548), Yemen (−0.0685), and the Syrian Arab Republic (−0.0959).
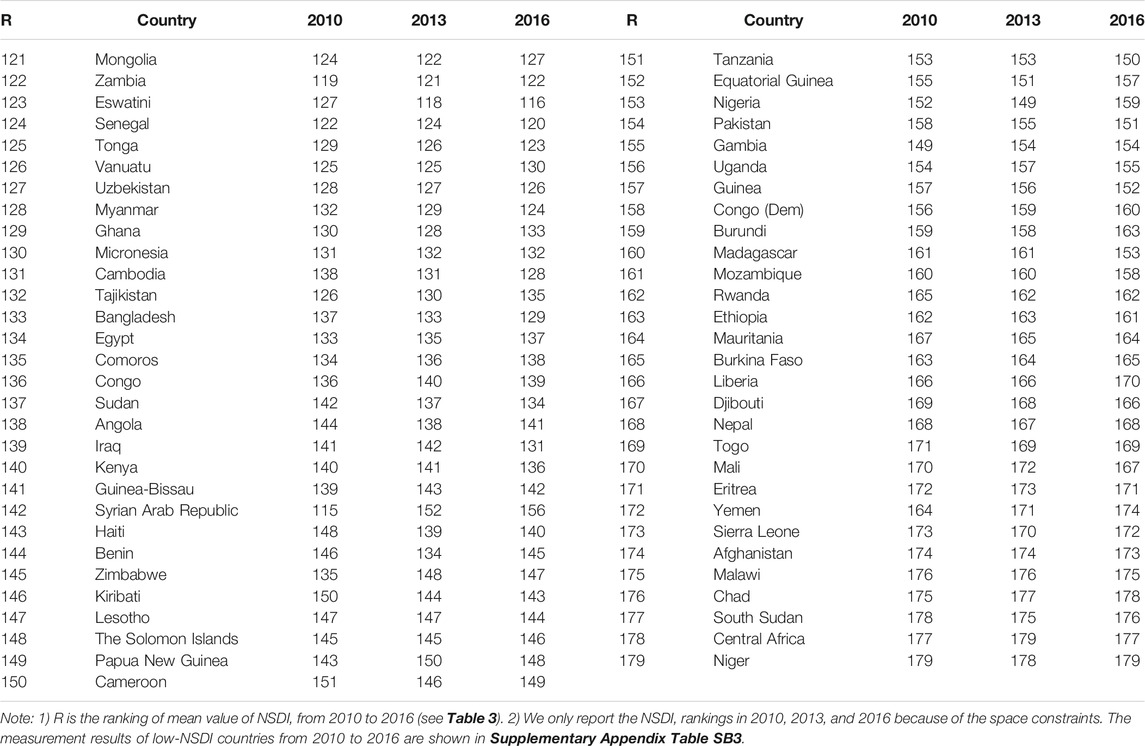
TABLE 6. Rankings of low-NSDI countries.
In sum, the variations of NSDI value and ranking in each country show distinct characteristics. First, the 30 countries with the largest increase in NSDI were mainly Asian countries (12) and European countries (9). On the one hand, many European developed countries still maintain a high growth rate of the NSDI. Exemplary is the case of upper-middle income Serbia—the country representing a historical statehood core of both Yugoslavia countries. It owns its fluctuating dynamics in the NSDI list due to the partial lack of sustainable investment in health care (Jakovljevic, 2013) and social insurance coverage (Jakovljevic et al., 2011). Issues affecting fiscal sustainability were largely driven by the prohibitively expensive budget impact of blockbuster pharmaceuticals (Jakovljevic et al., 2015), population aging (Ogura and Jakovljevic, 2014), and migration (Jakovljevic et al., 2018). On the other hand, many Asian countries have performed better and better in sustainable development in recent years. For example, the NSDI of China has increased the most in 2010–2016, thanks to rapid economic growth and environmental protection. Second, the 30 countries with the largest decline in the NSDI were mainly in Africa (9) and Asia (9). Third, most African and South American countries experienced a decline in sustainability from 2010 to 2016. The average NSDI of South American and African countries decreased by 0.102 and 0.038, respectively. Last, the sustainability of most European countries showed an increasing trend, with an average increase of 0.0053 in the NSDI. It means that the global sustainable development level may have a trend of divergence in 2010–2016.
Geographical Distribution of NSDI
The geographical distribution of the NSDI is shown in Figure 1. As the figure shows, the darker the blue, the higher will be the NSDI of the country and the better will be its performance in sustainable development, while the white indicates the data vacancy. The subfigures (a), (b), and (c), respectively, show the geographical distribution of the NSDI in 2010, 2013, and 2016. Overall, the blue color of countries in Western Europe, North America, and Oceania is the deepest, while that in Africa and West Asia is the shallowest, especially in sub-Saharan Africa. And, the blue color of Central Asia, East Asia, and South America is in the middle. In addition, countries in the northern hemisphere are darker in blue than those in the southern hemisphere. And, we find that the “north–south gap” in the development level still exists and has not narrowed in this period, by comparing the NSDI in 2010, 2013, and 2016. Furthermore, there is no obvious trend of convergence in the level of sustainable development globally.
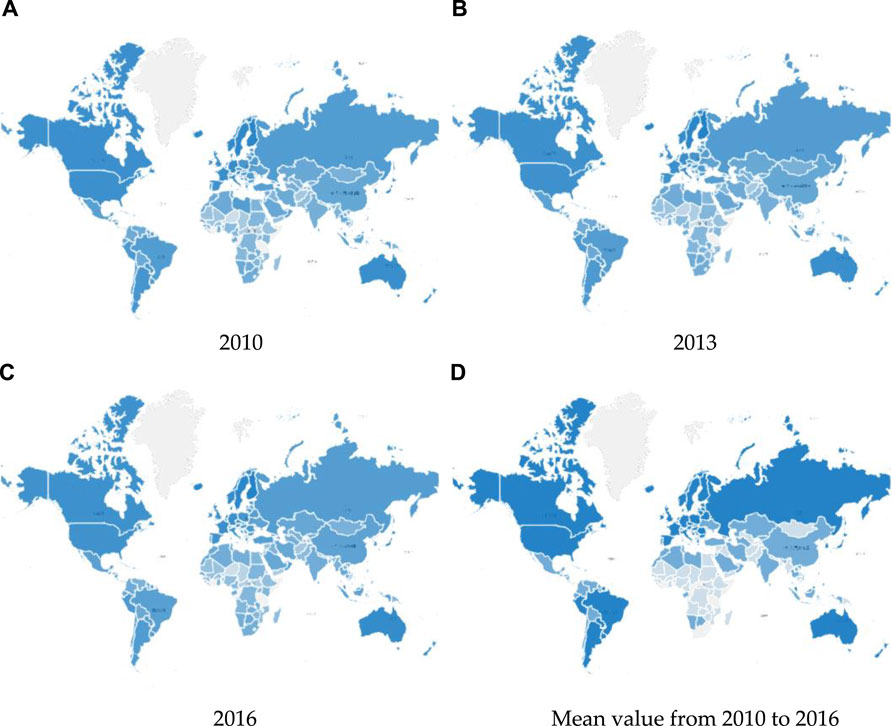
FIGURE 1. Geographical distribution of NSDI. Note: (A) is the geographical distribution of NSDI in 2010; (B) is the geographical distribution of NSDI in 2013; Subfigure (C) is the geographical distribution of t NSDI in 2016; (D) is the geographical distribution of the mean value of NSDI from 2010 to 2016, and high-NSDI countries are dark blue, medium-NSDI countries are light blue, and low-NSDI countries are gray.
There is an important reason why the geographical distribution of NSDI shows the aforementioned characteristics. On the one hand, the countries with higher economic levels always maintain a good performance in sustainable development because of their mature and sound systems in economics, social security, environmental protection, and so on. On the other hand, those backward countries not only have poor economic foundation but also do not have the aforementioned conditions, so it is always difficult to improve their sustainable development level. Even some countries have always been mired in war and extreme poverty, so sustainable development is out of the question. Therefore, the development of various countries presents a similar phenomenon to the “Matthew effect.”
Fortunately, we can be optimistic from the cases of the rapid increase in the NSDI in some developing countries. For example, the NSDI of China has greatly improved, from 0.5517 to 0.5834, with an increase of 0.0317, during 2010–2016. In another case, the NSDI of India increased from 0.4943 to 0.5168, with an increase of 0.0225. Both countries used to be very backward and poor countries in the world, but they have achieved great development in recent decades and still maintain a strong momentum of economic growth. It may provide important reference for other developing countries, through studying the laws of the rapid development of these two countries. Furthermore, it is essential to emphasize that China is the classic case of overachiever among the large nations in terms of Sustainable Development Goals (Jakovljevic et al., 2019). This is clearly visible in its struggle to lift 800 million citizens out of poverty line (Liu et al., 2017). Another well documented evidence are Chinese historical trends and future long-run forecasts on health spending up to 2025 (Jakovljevic et al., 2017) and 2030. These underlying hidden patterns clearly point out to Chinese leadership among the most rapidly developing emerging BRIC nations.
Discussion: A Comparison Between Original NSDI and Modified NSDI
Table 7 shows the comparison between our modified NSDI and the NSDI constructed by Jin et al. (2020). There are two main differences between the two indices: 1) the factors “drinking water” and “sanitation” are measured by “population using at least basic drinking water sources (%)” and “population using at least basic sanitation facilities (%)” in the modified NSDI; 2) the weight of each indicator is recalculated with new data through the entropy method. Comparing with the original NSDI, the weights of “income level,” “energy,” “education,” and “health” are significantly increased in our modified NSDI, while the weights of economic structure,” “climate,” and “arable land” are decreased.
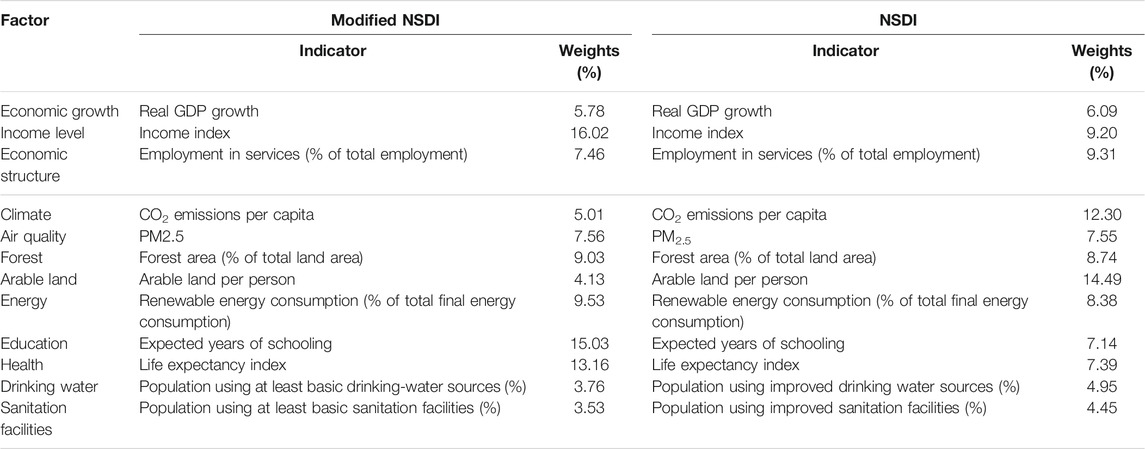
TABLE 7. Rankings of low-NSDI countries.
From the measurement results of sustainable development, we find that the modified NSDI retains some merits of the original NSDI. First, NSDI is an improved scheme of HDI, which has many characteristics of HDI, while the modified NSDI retains the characteristics of HDI that focus on human development and welfare. Second, it is clear that the modified NSDI still puts a stop to the “celebration” of “gas-guzzling developed countries” (Togtokh, 2011; Bravo, 2014). Those Middle Eastern countries that are rich but energy-intensive perform poorly in NSDI rankings, for example, Qatar and the United Arab Emirates are, respectively, ranked at 97 and 76 in Table 3.
Furthermore, the modified NSDI has more merits than the original one. First, the modified NSDI can measure the level of sustainable development globally and annually, but the original one can only measure it once every 5 years, such as in 2010 and 2015. Second, the modified NSDI can be used for further empirical research on annual panel data. For example, Jin and Martinez-Vazquez (Jin and Martinez-Vazquez, 2021) have studied the relationship between fiscal decentralization and sustainable development by using NSDI as a dependent variable. Third, the modified NSDI is more applicable and acceptable than the original one and can be used to measure for more countries. The modified NSDI could be used to measure sustainable development for 179 countries in this study, while the original one could be used to measure it for 163 countries (Jin et al., 2020). Last, the measurement result of the modified NSDI is more reliable than that of the original one. The measurement results of the original NSDI lack of accuracy, that is, the measurement results of the sustainable development level in some countries, are higher than the actual level, such as Lithuania and Kazakhstan, which are ranked at 15 and 18, respectively (Jin et al., 2020). This is because the original NSDI overemphasizes the proportion of the environment and resources.
Conclusion
This study is intended to assess sustainability globally based on the modified NSDI, hence to help policymakers better monitor the status of sustainable development and formulate development policies. So, we first modify the NSDI with some alternative indicators and adopt it for sustainable development assessment, and then compare the modified NSDI with the original one. The result shows that the modified NSDI not only retains the merits but also makes up for the shortcomings of the original NSDI in acceptability, reliability, and continuity. In addition, we also find that there is no obvious trend toward narrowing the gap in sustainable development levels among countries, or even an expanding trend.
As mentioned earlier, the HSDI, HGDI, and NSDI are all regarded as “derivative indices” or modification schemes of the HDI, but they vary from each other in composition and connotation. The HDI stresses on the ability and sustainability of human beings (Pata et al., 2021). But no matter whether they are poor, rich, or even developing or developed countries, they must act under the constraints of the earth’s environment. Living in this interrelated ecosystem, humans are believed to be tied to nature; hence, the local actions of each country are subject to the natural conditions of the world. Bravo (Bravo, 2014) reckons that the environment is an integral part of human sustainable development and builds the HSDI by adding an indicator (per capita CO2 emissions) to the present environmental dimension based on the HDI. Besides, the resource crisis has been increasingly exposed to such noticeable issues as excessive energy consumption and land pollution. Hence, it is safe to say that the sustainability of human beings, to a great extent, is susceptible to the resources on the earth. The HGDI is constructed by adding some indicators both in resource and environmental dimensions from those considerations. In terms of the previously defined concept of sustainable development, we ought to promote the realization of economic growth while raising awareness of protecting the ecological environment and making rational use of natural resources to ensure the welfare of future generations. Conceivably, protecting the environment at the cost of hindering economic development is not a sustainable development mode. Thus, the NSDI is set with economic, social, and resource-environmental dimensions and 12 indicators (see Table 1) (Jin et al., 2020). The NSDI is seen as a reliable and relatively complete SD index, but still with shortcomings. Therefore, we amend and upgrade the NSDI in this study to make up for the shortcomings of the original one in acceptability, reliability, and continuity.
Based on the aforementioned results, we derived the following policy implication. Governments should be committed to promoting coordinated development in the dimensions of the economy, society, and environment, without “care for this and lose that.” Specifically, governments should first accommodate the business climate to help economic growth, then strengthen environmental protection and resource utilization supervision, and finally improve government spending on livelihood projects, especially education, medical care, and social security.
Data Availability Statement
The original contributions presented in the study are included in the article/Supplementary Materials, further inquiries can be directed to the corresponding authors.
Author Contributions
JS conceived and designed the research and provided guidance throughout the entire research process; JS wrote and supplemented the English paper, and MJ participated in data analysis. HJ and F-ST review and edited and paper and is responsible for all R and R works.
Funding
The authors acknowledge funding support from the Major Program Project of the National Social Science Fund of China (No: 19ZDA055), Zhejiang Sci-Tech University (ZSTU) Scientific Research Fund (No: 21092117-Y) and ZSTU philosophy and social sciences research prosperity program (No: 21096075-Y).
Conflict of Interest
The authors declare that the research was conducted in the absence of any commercial or financial relationships that could be construed as a potential conflict of interest.
Publisher’s Note
All claims expressed in this article are solely those of the authors and do not necessarily represent those of their affiliated organizations, or those of the publisher, the editors, and the reviewers. Any product that may be evaluated in this article, or claim that may be made by its manufacturer, is not guaranteed or endorsed by the publisher.
Acknowledgments
F-ST acknowledges a distinguished (visiting) professorship from the NCWREP.
Supplementary Material
The Supplementary Material for this article can be found online at: https://www.frontiersin.org/articles/10.3389/fenrg.2022.816714/full#supplementary-material
Footnotes
1According to the standards of CIA’s the World Fact Book and IMF
References
Alaimo, L. S., and Maggino, F. (2020). Sustainable Development Goals Indicators at Territorial Level: Conceptual and Methodological Issues-The Italian Perspective. Soc. Indic Res. 2, 383–419. doi:10.1007/s11205-019-02162-4
Bilbao-Ubillos, J. (2013). The Limits of Human Development Index : The Complementary Role of Economic and Social Cohesion, Development Strategies and Sustainability. Sust. Dev. 21, 400–412. doi:10.1002/sd.525
Bolcárová, P., and KološTa, S. (2015). Assessment of Sustainable Development in the EU 27 Using Aggregated SD index. Ecol. Indic 48, 699–705. doi:10.1016/j.ecolind.2014.09.001
Bravo, G. (2014). The Human Sustainable Development Index: New Calculations and a First Critical Analysis. Ecol. Indicators 37, 145–150. doi:10.1016/j.ecolind.2013.10.020
Campagnolo, L., Eboli, F., Farnia, L., and Carraro, C. (2018). Supporting the UN SDGs Transition: Methodology for Sustainability Assessment and Current Worldwide Ranking. Economics 12, 1–31. doi:10.5018/economics-ejournal.ja.2018-10
Cobb, C. W., and Cobb, J. B. (1994). The Green National Product: A Proposed Index of Sustainable Economic Welfare. Lanham, MD, USA: University Press of America.
Estoque, R. C., and Murayama, Y. (2014). Social-ecological Status index: A Preliminary Study of its Structural Composition and Application. Ecol. Indicators 43, 183–194. doi:10.1016/j.ecolind.2014.02.031
Esty, D. C., Levy, M. A., Srebotnjak, T., and de Sherbinin, A. (2005). Environmental Sustainability Index: Benchmarking National Environmental Stewardship. New Haven, CT, USA: Yale Center for Environmental Law & Policy.
Esty, D. C., Levy, M. A., Srebotnjak, T., de Sherbinin, A., Kim, C. H., and Anderson, B. (2006). Pilot2006 Environmental Performance Index. New Haven, CT, USA: Yale Center for Environmental Law & Policy.
Goodland, R., and Daly, H. (1996). Environmental Sustainability: Universal and Non-negotiable. Ecol. App 6 (4), 1002–1017. doi:10.2307/2269583
Guillén-Royo, M. (2016). Sustainability and Wellbeing: Human-Scale Development in Practice. London, UK: Routledge.
Hametner, M., and Kostetckaia, M. (2020). Frontrunners and Laggards: How Fast Are the EU Member States Progressing towards the Sustainable Development Goals. Ecol. Econ. 177, 745623. doi:10.1016/j.ecolecon.2020.106775
Hickel, J. (2019). The Sustainable Development index: Measuring the Ecological Efficiency of Human Development in the Anthropocene. Ecol. Econ. 167, 423517. doi:10.1016/j.ecolecon.2019.05.011
Jakovljevic, M. B., Djordjevic, N., Jurisevic, M., and Jankovic, S. (2015). Evolution of the Serbian Pharmaceutical Market Alongside Socioeconomic Transition. Expert Rev. Pharmacoeconomics Outcomes Res. 15 (3), 521–530. doi:10.1586/14737167.2015.1003044
Jakovljevic, M. B. (2013). Resource Allocation Strategies in Southeastern European Health Policy. Eur. J. Health Econ. 14 (2), 153–159. doi:10.1007/s10198-012-0439-y
Jakovljevic, M., Jakab, M., Gerdtham, U., McDaid, D., Ogura, S., Varavikova, E., et al. (2019). Comparative Financing Analysis and Political Economy of Noncommunicable Diseases. J. Med. Econ. 22 (8), 722–727. doi:10.1080/13696998.2019.1600523
Jakovljevic, M., Jovanovic, M., Lazic, Z., Jakovljevic, V., Djukic, A., Velickovic, R., et al. (2011). Current Efforts and Proposals to Reduce Healthcare Costs in Serbia. Ser. J. Exp. Clin. Res. 12 (4), 161–163. doi:10.5937/sjecr1104161j
Jakovljevic, M. M., Netz, Y., Buttigieg, S. C., Adany, R., Laaser, U., and Varjacic, M. (2018). Population Aging and Migration - History and UN Forecasts in the EU-28 and its East and South Near Neighborhood - One century Perspective 1950-2050. Glob. Health 14 (1), 30–36. doi:10.1186/s12992-018-0348-7
Jakovljevic, M., Potapchik, E., Popovich, L., Barik, D., and Getzen, T. E. (2017). Evolving Health Expenditure Landscape of the BRICS Nations and Projections to 2025. Health Econ. 26 (7), 844–852. doi:10.1002/hec.3406
Jin, H., and Martinez-Vazquez, J. (2021). Sustainable Development and the Optimal Level of Fiscal Expenditure DecentralizationICePP Working Paper Series, #2103, Andrew Young School of Policy Studies. Georgia, USA: Georgia State University.
Jin, H., Qian, X., Chin, T., and Zhang, H. (2020). Global Assessment of Sustainable Development: Based on the Modification of Human Development Index with Entropy Method. Sustainability 12 (8), 1–20. doi:10.3390/su12083251
Jin, H., and Qian, X. (2020). How the Chinese Government Has Done with Public Health from the Perspective of the Evaluation and Comparison about Public-Health Expenditure. Int. J. Environ. Res. Public Health 17 (12), 3466. doi:10.3390/ijerph17249272
Khalid, A. M., Sharma, S., and Dubey, A. K. (2020). Data Gap Analysis, Indicator Selection and Index Development: A Case for Developing Economies. Soc. Indic Res., 148. doi:10.1007/s11205-019-02225-6
Kwatra, S., Sharma, P., and Kumar, A. (2020). A Critical Review of Studies Related to Construction and Computation of Sustainable Development Indices. Ecol. Indic 112 (112), 106061. doi:10.1016/j.ecolind.2019.106061
Li, X. X., Liu, Y. M., and Song, T. (2014). Calculation of the Green Development Index. Soc. Sci. China 6, 69–95.
Liu, Y., Liu, J., and Zhou, Y. (2017). Spatio-temporal Patterns of Rural Poverty in China and Targeted Poverty Alleviation Strategies. J. Rural Stud. 52, 66–75. doi:10.1016/j.jrurstud.2017.04.002
Ma, Y. M., Wu, Y. M., and Wu, B. J. (2015). Comprehensive Evaluation of Sustainable Urban Development of Yangtze River Delta Based on Entropy Method and Quadrant Method. Econ. Geogr. 6, 47–53.
Nardo, M., Saisana, M., Saltelli, A., Tarantola, S., Hoffman, A., and Giovannini, E. (2005). Handbook on Constructing Composite Indicators: Methodology and User Guide.
Ogura, S., and Jakovljevic, M. (2014). Health Financing Constrained by Population Aging - an Opportunity to Learn from Japanese Experience/Finansiranje Zdravstvene Zaštite U Uslovima Starenja Popualcije - Prilika Da Učimo Na Japanskom Iskustvu. Serbian J. Exp. Clin. Res. 15 (4), 175–181. doi:10.2478/sjecr-2014-0022
Pata, U. K., Aydin, M., and Haouas, I. (2021). Are Natural Resources Abundance and Human Development a Solution for Environmental Pressure? Evidence from Top Ten Countries with the Largest Ecological Footprint. Resour. Pol. 70, 101923. doi:10.1016/j.resourpol.2020.101923
Pollesch, N. L., and Dale, V. H. (2016). Normalization in Sustainability Assessment: Methods and Implications. Ecol. Econ. 130, 195–208. doi:10.1016/j.ecolecon.2016.06.018
Rama, M., González-García, S., Andrade, E., Moreira, M. T., and Feijoo, G. (2020). Assessing the Sustainability Dimension at Local Scale: Case Study of Spanish Cities. Ecol. Indicators 117, 106687. doi:10.1016/j.ecolind.2020.106687
Ramos, T. B., and Caeiro, S. (2010). Meta-performance Evaluation of Sustainability Indicators. Ecol. Indicators 10, 157–166. doi:10.1016/j.ecolind.2009.04.008
Türe, C. (2013). A Methodology to Analyse the Relations of Ecological Footprint Corresponding with Human Development index: Eco-Sustainable Human Development index. Int. J. Sustain. Dev. World Ecol. 20, 9–19. doi:10.1080/13504509.2012.751562
United Nations Development Programme (Undp), (2004). Note on Statistics in the Human Development Report. New York, NY, USA: UNDP.
Wackernagel, M., and Rees, W. (1997). Our Ecological Footprint. Basel, Switzerland: Birkhouse Publishing.
Wang, M., Zhao, X., Gong, Q., and Ji, Z. (2019). Measurement of Regional Green Economy Sustainable Development Ability Based on Entropy Weight-Topsis-Coupling Coordination Degree-A Case Study in Shandong Province, China. Sustainability 11, 280–295. doi:10.3390/su11010280
World Commission on Environment and Development-Wced, (1987). Our Common Future. Oxford, UK: University Press.
Keywords: sustainable development, UN indicators, entropy method, environmental assessment, innovation
Citation: Sun J, Jin H, Tsai F-S and Jakovljevic M (2022) A Global Assessment of Sustainable Development: Integrating Socioeconomic, Resource and Environmental Dimensions. Front. Energy Res. 10:816714. doi: 10.3389/fenrg.2022.816714
Received: 25 November 2021; Accepted: 13 January 2022;
Published: 14 February 2022.
Edited by:
Adrian Ilinca, Université du Québec à Rimouski, CanadaReviewed by:
Viktor Sebestyén, University of Pannonia, HungaryUgur Korkut Pata, Osmaniye Korkut Ata University, Turkey
Judit T. Kiss, University of Debrecen, Hungary
Copyright © 2022 Sun, Jin, Tsai and Jakovljevic. This is an open-access article distributed under the terms of the Creative Commons Attribution License (CC BY). The use, distribution or reproduction in other forums is permitted, provided the original author(s) and the copyright owner(s) are credited and that the original publication in this journal is cited, in accordance with accepted academic practice. No use, distribution or reproduction is permitted which does not comply with these terms.
*Correspondence: Hui Jin, amluaHVpMjAxN0B6anV0LmVkdS5jbg==; Fu-Sheng Tsai, dHNhaWZzQGdjbG91ZC5jc3UuZWR1LnR3