 Jie Dong1
 Ziyue Liu
94% of researchers rate our articles as excellent or good
Learn more about the work of our research integrity team to safeguard the quality of each article we publish.
Find out more
ORIGINAL RESEARCH article
Front. Energy Res. , 18 March 2022
Sec. Smart Grids
Volume 10 - 2022 | https://doi.org/10.3389/fenrg.2022.816246
In view of the operational risk issues such as safety and economy caused by the connection of new energy and multiple types of electric vehicles (EVs) to the AC–DC distribution network, an AC–DC distribution network operational risk assessment method that takes into account multiple risk factors is proposed. First, a probability distribution model of scenery output and EV timing is constructed, and the starting charge state of multiple types of EVs is replaced by the number of daily driving miles subjectively set; then, based on the complex network theory, timing safety indicators, such as voltage overrun risk and branch power overload operation risk, are proposed, and the economic risk is established according to the economic operation of the distribution grid; Furthermore, a risk assessment matrix for grid-connected EVs with different capacities is constructed, and the principal component analysis (PCA) method is used to reduce the dimension of the risk assessment matrix and calculate the objective weight coefficient; finally, taking the improved IEEE 33 node AC/DC power distribution system as an example, the comprehensive risk evaluation based on PCA is compared with the traditional one, and the results show that when the safety and economic risk factors are considered at the same time, the operation risk in a certain range has a downward trend when the proposed method is adopted, which has a positive guiding significance for the planning of EV capacity in a certain area.
In recent years, with the rapid increase of new energy and electric vehicle (EV) access capacity, the structure, flow, and operation mode of the AC and DC distribution network have undergone tremendous changes (Liang et al., 2020). On the one hand, the output of DG (distributed generation) has randomness and uncertainty, which will cause negative effects such as line overload, reduced power quality, and increased system loss (Yang et al., 2020a); on the other hand, the random charging behavior of EVs will provide a safe and economically stable operation of the power system bringing new risks and challenges (Chen et al., 2019). Therefore, evaluating the operational risks of DG and EV after being connected to the power grid is an urgent problem to be solved in the power system.
The risk assessment for the simultaneous access of DG and EVs to the AC/DC distribution network is mainly divided into two aspects: risk assessment method and risk assessment index construction. The traditional risk assessment analysis method mainly follows the reliability assessment method, which can usually be divided into the analytical and simulation methods (Lu and Yuan, 2017). Nan et al., (2020) established a risk assessment system from four levels for EV fast charging stations using the AHP (analytic hierarchy process) and entropy weight methods to determine the weight of each level of the index and finally combined with the fuzzy comprehensive evaluation method to quantify the evaluation results; Xiong et al., (2016), based on the stochastic power flow of the full probability theory, established and solved the level 2 risk index, established the comprehensive risk assessment index, and realized the quantitative assessment of the risk of the distribution network; Hu et al., (2016) established the dynamic distribution model of EV charging power using the semi-invariant probabilistic power flow algorithm and solved the risk indicators of node voltage and branch power flow over-limit so as to analyze the security risk of the electric power distribution network. Although the abovementioned studies have made certain contributions to risk assessment methods, most of them rely on expert evaluation (Yuan et al., 2016) or semi-quantitative analysis when determining indicator weights. They are susceptible to subjective factors and are often not comprehensive enough to consider the true size of risk indicators.
In terms of the construction of the risk index system, the index system that uses the degree of severe loss to describe the consequences of operating events has developed more maturely. Liu et al., (2015) defined the calculation expressions of risk indicators such as voltage overruns, probability of line fluctuations, and severity of accidents and conducted a comprehensive risk assessment of the power grid and quantified the differences of components; Zhang et al., (2019) fully considered wind power, and based on the uncertainty of EV access to the distribution network, the load aggregator response reliability and risk cost indicators are proposed based on fuzzy theory. In addition, harmonic risk (Zhao et al., 2014), load reduction risk (Wang et al., 2018), flexibility risk (Li et al., 2015) and other risk indicators are also involved in research, but most of them are limited to a single risk indicator that considers safety or economy and does not consider operational risks. Due to variable factors and dynamic processes, it is impossible to clearly grasp the operating status of the power system.
At the same time, the abovementioned documents are all researched under the premise of considering a single type of EV, and the charging power remains unchanged. Yang et al., (2020b) built a weighted basis for the scenario where DG and three types of variable power EV charging loads are simultaneously connected to the distribution network, entropy voltage, and power flow limit risk, but it did not further analyze the EV type and charging mode and failed to objectively consider the operation risk status of the distribution network from multiple factors. Therefore, it is necessary to establish a set of multilevel risk indicator system and objective and reasonable comprehensive evaluation methods, thereby reducing repeated risk information and better analyzing the operating status. This study analyzes the stochastic characteristics of DG output and EV charging load and constructs a time-series model of constant current–constant voltage (CC–CV) variable power multitype EV charging load based on daily driving mileage; proposes a short-term safety risk index based on the complex network theory, while introducing an economic risk that includes the operating profit; a three-dimensional and multi-angle risk index system is established; and the principal component analysis (PCA) method is used to comprehensively evaluate the operation risk of the distribution network under different EV capacities. The validity of the proposed risk index and the rationality of the comprehensive evaluation method are verified by numerical example analysis. The results show that the proposed method can actively guide the safe, economical, and stable operation of DG and EV in the distribution network.
Wind power output is mainly determined by wind speed, and the statistical characteristics of wind speed obey the two-parameter Weibull distribution (Liu et al., 2017). Therefore, the expression of the distribution function of the active power output
where
The intensity of solar light varies with the geographical environment and location. Based on a large amount of measurement data, beta distribution (Zhang et al., 2013) can be used to represent the distribution of solar light intensity in a day. Then, the probability density function of photovoltaic power generation’s active power output is as follows:
where
The conventional load at any time adopts normal distribution to reflect its randomness and uncertainty. The probability density function of the conventional load active power
where
The factors that affect EV charging load can be summarized as charging characteristics, charging period, and charging mode. The following three influencing factors will be analyzed separately to establish a mathematical probability distribution model.
The EV charging process meets the charging characteristics of lithium batteries. It is a CC–CV variable power charging method. When the battery state of charge is low and the battery internal resistance is relatively stable, the constant current method is used for fast charging. As the charging time increases, the charging voltage increases after reaching
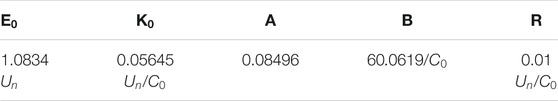
TABLE 1. Parameters of the constant current-constant voltage two-stage variable power charging process of the lithium battery.
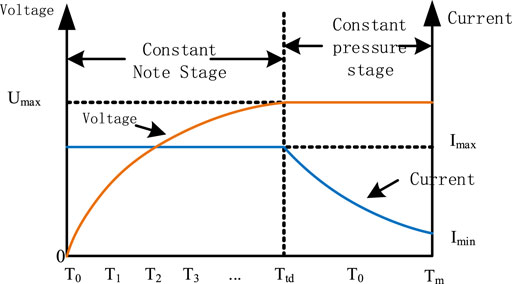
FIGURE 1. Current and voltage changes in the CC–CV charging mode.
Therefore, the charging power of the jth EV can be defined as
where

TABLE 2. Parameter setting of the electric vehicle’s battery.
The initial charging time, daily mileage, and EV charging period are very closely related, so this study is based on the 2017 and 2018 National Family Travel Survey (NHTS) data published by the US Federal Highway Administration on the entire network (Guo et al., 2020; U.S. Department of Transportation, 2018); the Monte Carlo simulation (MCS) method is used to fit the normal distribution of EV daily mileage, as shown in Eq. 6.
where
The initial charging time of EV satisfies the normal distribution shown in Eq. 7.
where
The charging time T is calculated according to the daily mileage d, as shown in formula Eq. 8.
where
The charging mode has a great influence on the EV charging power. At present, the main charging modes of EVs include slow charging, regular charging, and fast charging. Generally, different charging modes are distinguished by a given constant current. In the following paragraphs, according to the driving characteristics of different types of EVs, the charging mode that meets the actual situation is selected.
The driving range of a fully charged private car battery is much greater than the average daily driving range, so one charging cycle a day can meet the daily driving demand of a private car. Private cars can be charged in the parking lot of the workplace from 09:00–12:00 and 14:00–17:00 or charged in the parking lot of residential areas from 19:00 to 07:00 the next day, charging in three periods. The probabilities are 20, 10, and 70%. If charging in the parking lot of the work unit, the charging time does not exceed 3 h; then, the fast charging mode is chosen with larger constant current; if charging in the parking lot of a residential area, the charging can continue all night; then, the regular constant current moderate charging mode is chosen. Official vehicles are mainly used for daily official travel of government agencies. Long-distance travel is not considered. Its driving characteristics are similar to private cars. It can meet the charging demand even if it is charged once a day. The charging period is from 19:00 to 07:00 the next day. The constant current moderate regular charging mode is chosen.
It is difficult to meet the operational requirements of actual work for buses and taxis to be charged only once a day. Generally, two charging cycles a day are adopted. The bus operating time is 06:00–22:00 and the route is relatively fixed. It can be charged centrally. Charging is not arranged during the peak operation period during the day. During the 10:00–16:30 shift and lunch break, the bus will be charged with a constant current. Charging in the charging mode and in the regular charging mode with moderate current from 23:00 to 05:30 is conducted the next day. Taxis have limited rest time and need to replenish electricity in time. Therefore, taxis are charged in a constant-current fast charging mode during the two periods of 02:00–05:00 and 11:30–14:30.
The specific parameters of the four EVs are set according to the influence of the different charging modes on the magnitude of the charging power Table 3.
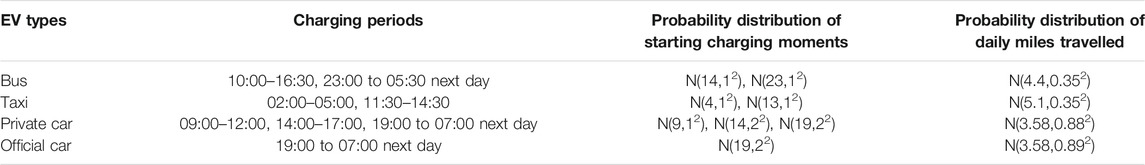
TABLE 3. Driving characteristic parameters of the EV.
As a complex system, each node of the power grid does not exist independently but as a whole that restricts and influences each other. The vulnerability of each component is not only related to its structural position in the power grid but also to other components when the power grid is running. The influence of the node is related. Therefore, when evaluating the risk of DG and EV connecting to the AC/DC distribution network, it is necessary to comprehensively consider the impact of various factors. Therefore, this study proposes a short-term security risk assessment model for power grids that combines network structure vulnerability and risk theory. The importance of the node comprehensively considers the degree of the node, the betweenness (Shi et al., 2018), and the proportion of the conventional load connected to the node. The importance of the branch is measured by the degree and betweenness of the line, and the calculation formulas are as follows:
where
EV charging load will bring short-term security risks to the power grid. Impact indicators include node voltage over-limit risk indicators and line power over-limit risk indicators. The specific calculation method is as follows.
a) The calculation formula of the node voltage over-limit operation risk index is.
where
b) The calculation formula of the risk index of line power exceeding the limit is.
where
In this study,
where
The ERI (economic risk indicator) of DG and EV charging loads connected to the AC/DC distribution network comprises two parts: ELLR (economic line-loss risk) and EPLR (economic operational profit or loss risk). The formula is as follows:
where
In order to fully consider the uncertainty of EV charging time and charging location and its impact on the power distribution system, EV capacity (Yang et al., 2020b) is defined as the sum of the rated charging power of all EVs in the charging and non-charging states in an area. According to the risk indicators mentioned above, in order to ensure the safe and stable operation of DG and EV in the distribution network, the PCA method (Xiao et al., 2018) is used to analyze the risks caused by different EV capacities to the distribution network, and a small number of risk variables are used to replace the original large number of risk variables and can contain the full content of the original input risk variable. P risk indicators
Among them,
According to the standardized risk index matrix
The proportion of the variance of the
If the cumulative variance of the principal components reaches a certain proportion, the original index can be replaced by the corresponding principal component, and the comprehensive risk assessment index result can be calculated by the linear superposition of the abovementioned principal components, namely:
On the premise of retaining the main information of the original data, PCA effectively reduces the correlation between the evaluation indicators and the data dimension, so the obtained evaluation is more credible. At the same time, since the comprehensive risk assessment takes the contribution rate of each principal component as the weight, it not only avoids the drawbacks of subjective weighting but also fully reflects the information value contained in the risk index.
In this study, the improved IEEE 33 node distribution system is selected as a simulation example. The system is a 10 kV network with a reference voltage of 12.66 kV and a three-phase power reference value of 10 MV A. Its improved topology is shown in Figure 2 with node 1 as a balancing node and the voltage set to 1.05 p. u. The wind power is equivalently connected to node 18, the PV is equivalently connected to node 33, and the EV charging load of 13 MW is equivalently connected at node 8, with a total expected peak value of 3.715 MW for the conventional load. The relevant parameters of the EV are shown in Tables 1–4.
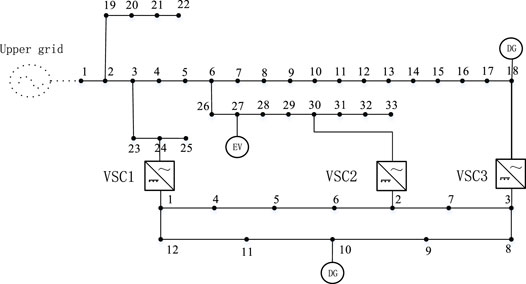
FIGURE 2. Improved 33-node AC/DC system.
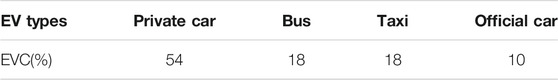
TABLE 4. EVC proportion of various types of electric vehicles.
The simulation parameters and distribution parameter variation curves of the DG are shown in Table 5 and Figure 3, respectively, and the DG output curve is shown in Appendix Figure 4.
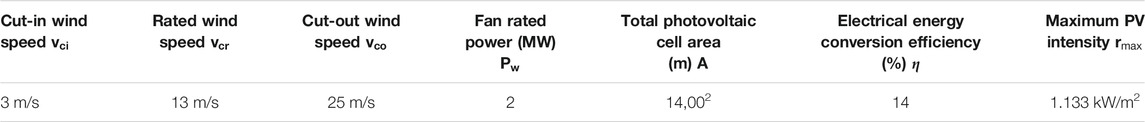
TABLE 5. Simulation parameters of wind power and photovoltaic power.
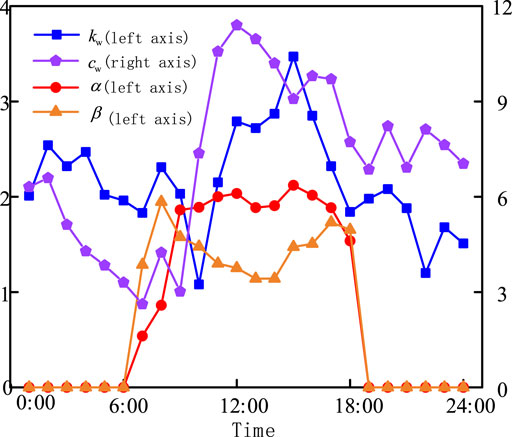
FIGURE 3. Photovoltaic power distribution parameters
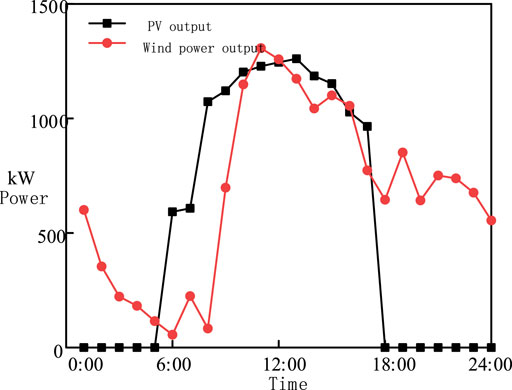
FIGURE 4. Output of wind-PV in each period.
The DG tariff setting reference (Ju et al., 2019). The power factor of both the load and the power source is 0.95. The O &M cost of both wind and PV is $55. The calculation process for distribution network operational risk is shown in Figure 5.
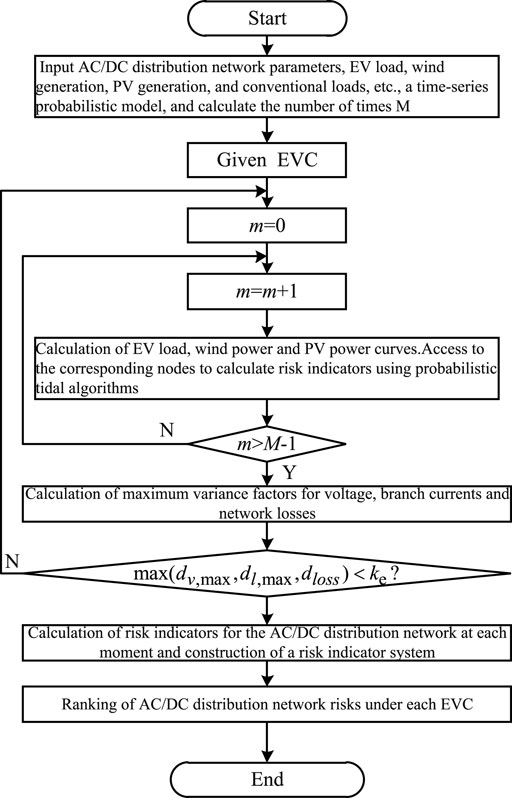
FIGURE 5. Calculation process of distribution network operation risk.
In this study, the AHP method is used to determine the weight coefficients of the risk indicators in Section 3.1, which can be obtained as
According to the model in Section 2 and 3, the expected charging power values of 4 EV types are obtained based on the MCS method, as shown in Figure 5. It can be seen from Figure 6 that for private cars, they are charged in a relatively large constant current fast charging mode between 09:00–12:00 and 14:00–17:00, resulting in a double-peak load state; at 00: 00: during 00–07:00 and 19:00–24:00, although the conventional charging mode is adopted, a large number of private car access also caused load peaks. Among them, the private car charging load and regular load during 19:00–24:00 both reached the peak value, which intensified the operation risk of the power grid. During the period of 00:00–07:00, the battery power of most private cars was close to saturation, which caused the charging load of private cars to drop. For official vehicles, the regular charging mode is adopted during the period from 19:00 to 24:00, forming a single peak load, which aggravates the total load during this period to a certain extent. For buses, the fast charging mode is adopted during the period of 13:00–16:00 so that the load reaches the peak during the day; the regular charging is adopted during the period of 00:00–01:00 and 23:00–24:00 The mode makes the night load increase, which has an impact on the operation risk of the distribution network, but it complements other types of EV charging loads, which reduces the load peak-to-valley difference to a certain extent. For taxis, the fast charging mode with a relatively large constant current is adopted during the period of 03:00–05:00, which dominates the EV charging load; the fast charging mode is also adopted during the period of 12:00–14:00. This intensified the peak of the daytime charging load but reduced the volatility of the load to a certain extent. In summary, it can be seen that the charging load fluctuates sharply within a day, so it is necessary to analyze the risk of power grid operation.
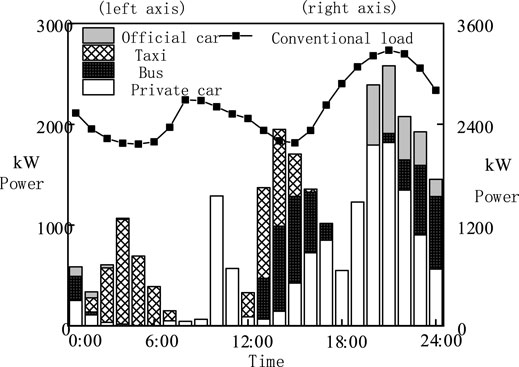
FIGURE 6. Expected charging power for four EV types.
In order to study the rationality and necessity of the short-term safety risk indicator, this study first compares the deterministic assessment and the short-term safety risk indicator proposed in this study, that is, an equivalent EV charging load of 13 MW is connected at node 8, and the AC voltage at nodes 1–18 is assessed during the period 20:00–21:00; the results are shown in Figure 7 (AC voltages in the figure are the standardized values). The stochastic nature of the DG output power, EV charging power, and conventional load is ignored in the deterministic assessment. The average equivalent access node power was used to calculate the AC node voltage. As can be seen from Figure 7A, when the deterministic assessment is taken, nodes 9–18 are the nodes with voltages exceeding 0.93 p. u. In other words, only 10 nodes have voltage overruns under the deterministic assessment; however, as can be seen from Figure 7B, nodes 4–18 all have voltage overrun risks according to the risk indicators proposed in this study, that is, most nodes have voltage crossing probability. It can be seen that as the deterministic assessment ignores the “probability” and uncertainty, the assessment results do not reflect the actual operating conditions.
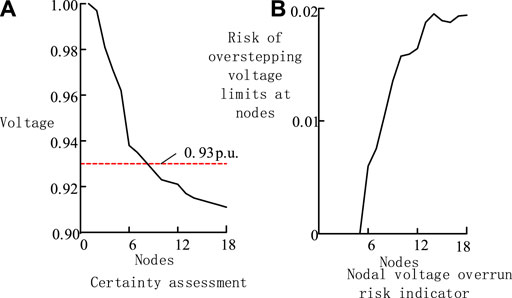
FIGURE 7. Results of deterministic assessment and proposed short-term safety risk indicator: (A) Certainty assessment. (B) Nodal voltage overrun risk indicator.
As there are differences in the short-term safety risk of DG and EV access to the AC–DC distribution network at different time sequences, the results of the AC node voltage crossing risk indicators at each time are obtained on the basis of Figure 7, taking into account the time sequence, as shown in Figure 8. This is due to the fact that nodes 18 and 33 are at the end of the distribution system and have a short electrical distance from the DG or EV. The temporal variation also has a significant impact on the power quality of nodes 5–18 and 25–33. The temporal dimension shows that the AC distribution network nodes experience voltage overruns between 06:00 and 19:00 when the EV charging load is small and the DG output is too high; in addition, a large number of taxis charge quickly between 01:00 and 05:00, resulting in a certain voltage overrun at the nodes. In addition, a large number of taxis charge quickly between 01:00 and 05:00, resulting in a certain voltage overrun at the node. The DC distribution network node voltage is constant, and there is no node voltage overrun, which indicates that the DC distribution network node is not affected by the time series change and is relatively stable Table 1 shows the risk index results of line power overrun. It can be seen from the table that during the period of 20:00–21:00, the risk of line power over-limit is mainly concentrated at the head end of the distribution network. Line 1–2 has the greatest risk of line power over-limit. This period is also the superposition of EV charging load and conventional load. The peak value of the power line leads to the greatest risk of line power violation.
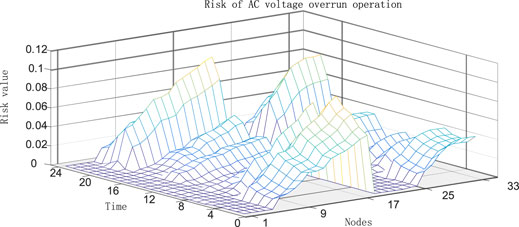
FIGURE 8. Risk of over-voltage operation of AC distribution network nodes.
Figure 9 gives the results of the AC and DC line power overrun risk indicators. From Figure 9A, it can be seen that in the 20:00–21:00 time period, line power overrun risk is mainly concentrated at the head of the AC distribution network. From Figure 9B, it can be found that at 21:00, line 1–2 has the highest risk of line power overrun, which is also the peak of EV charging load and conventional load superposition, resulting in the highest risk of line power overrun. As can be seen in Figures 9C,D, branch tide overruns occur in the DC distribution network during the 06:00–19:00 time period, and the risk values are greater than those in other time periods due to the smaller EV charging load and excessive DG output power in the AC distribution network at this time.
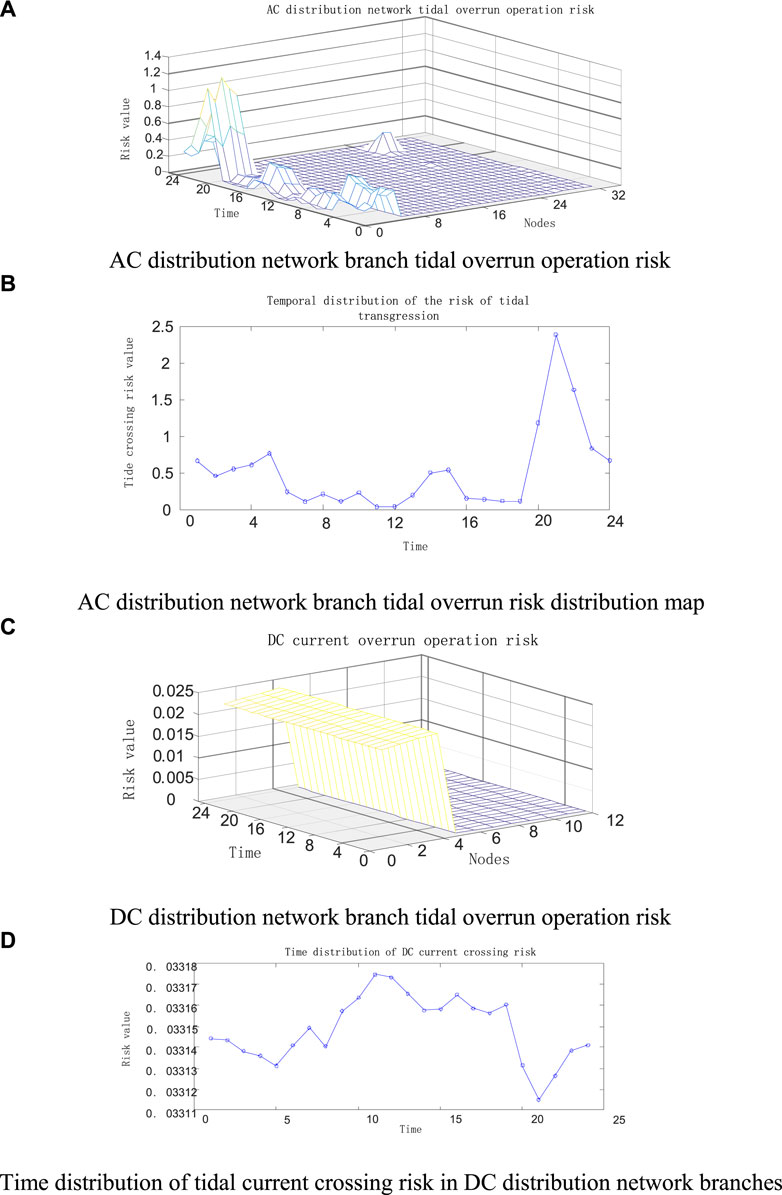
FIGURE 9. AC and DC distribution network branch current overrun operational risk: (A) AC distribution network branch tidal overrun operation risk. (B) AC distribution network branch tidal overrun risk distribution map. (C) DC distribution network branch tidal overrun operation risk. (D) Time distribution of tidal current crossing risk in DC distribution network branches.
After the time-series economic risk assessment, the ERI results of AC and DC distribution networks for one day can be obtained as shown in Figure 10. From Figure 10A, it can be seen that the CERI is positive during the 05:00 and 20:00–22:00 time periods, with the maximum value occurring during the 21:00–22:00 time period. The most risky time period is 20:00–22:00 when the risk values for both economy and safety are high due to the superposition of the conventional load and the EV charging load reaching peak load. At the same time, the operational state of the distribution network can be divided into the following two categories: ①During the periods 06:00–19:00 and 23:00–03:00, the value of the RSRI is greater than 0, while the value of CERI is less than 0. This indicates that the operational state is economic but unsafe, and measures should be taken to reduce the RSRI, for example, by reducing the output power of the DG and increasing the charging power of the EV station. ② The values of RSRI and CERI are both positive during the hours of 04:00–05:00 and 20:00–22:00, indicating that the operating state of the distribution network is neither safe nor economical at this time due to the huge load demand and the fluctuation of DG output, and measures should be taken to improve the operating quality of the actual distribution network. As can be seen in Figure 10B, the value of RSRI is almost zero and the value of CERI is less than zero at all times in the DC distribution network, which is both safe and economical.
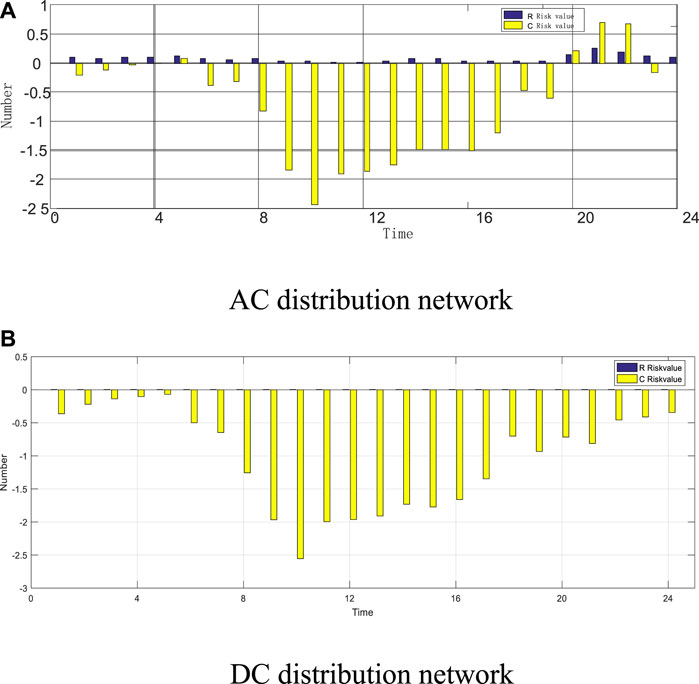
FIGURE 10. ERI results of the distribution network: (A) AC distribution network. (B) DC distribution network.
From the previous simulation results, it can be seen that the short-term safety risk index and economic risk index at 21:00 reach the maximum value. Therefore, the risk value at 21:00 is selected, and the EV capacity is increased from 9 to 15 MW at intervals of 0.5 MW; 13 EV capacity values. According to the definition of risk indicators in Section 3, a 4 × 13-order risk indicator matrix is constructed. The risk index matrix was processed by the Z-Score method, and the standardized risk index results under each EV capacity were obtained. The KMO (Kaiser–Meyer–Olkin) test obtained by SPSS software simulation is 0.770, and the significance is less than 0.05. The results show that there is a strong correlation between the risk indicators, and factor analysis can be carried out.
The factor analysis in PCA is used to reduce the dimension of the risk index matrix, and the related factor loading matrix of the risk index and
According to formula Eq. 24, the scores of each risk index can be calculated, and the results are shown in Table 6. It can be seen from Table 6 that the importance of each risk index is related, and the node voltage over-limit risk index has the largest weight, which is also an important basis for the next stage of the distribution network to be transformed.

TABLE 6. Component score coefficient.
In order to better reflect the superiority of the method in this study, it is compared with the comprehensive risk assessment method based on weighted entropy in literature (Yang et al., 2020b) and the traditional voltage and power flow out-of-limit comprehensive risk evaluation method in literature (Hou, 2017). When DG and EV are connected to the distribution network at the same time, the comprehensive risk assessment index results under different EV capacities are shown in Figure 11. In the figure
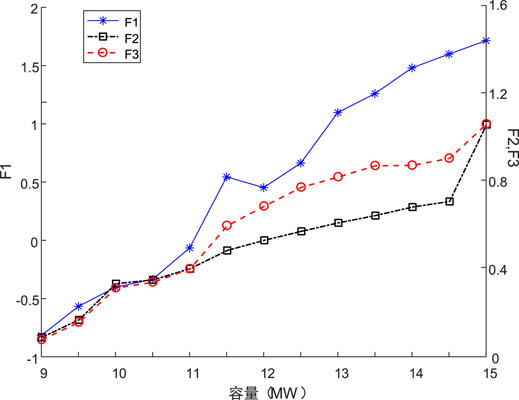
FIGURE 11. Comprehensive risk assessment indicator results with different EV capacities.
It can be seen from Figure 11 that with the continuous increase of EV capacity, the comprehensive risk value only considering safety factors continues to increase. However, using the method in this study, it can be found that when the EV capacity is within the 12 MW range, the comprehensive risk assessment index value of the distribution network decreases, which has a mitigating effect on the operation of the distribution network. It can be seen that it is better to consider the risk factors such as safety and economy at the same time. It can accurately grasp the operation risk status of the distribution network and can play a positive role in guiding EV access to the distribution network capacity.
In this study, a risk analysis method for grid-connected operation of EVs in AC–DC distribution networks is proposed, and the conclusions obtained are as follows.
1) In considering the impact of DG and EV on the AC–DC distribution network, a CC–CV variable power charging load model without subjective prediction laws is established, which avoids the shortcomings of the commonly used EV charging load modeling methods, such as the incompatibility between the model with artificially set parameters and the random driving characteristics of users, and can reflect the actual charging characteristics of EV more realistically.
2) Compared with deterministic assessment, the short-term safety risk index based on the complex network theory proposed in this study can more realistically reflect the short-term safety risk caused by the uncertainty of the distribution network node; the greater the security risk is.
3) Using the ERI with ELLR and EPLR, it is verified through simulation that the distribution network has economic risk during the hours of 04:00–05:00 and 20:00–24:00, and the distribution network can obtain certain economic benefits during other hours.
4) Based on the proposed risk index, the risk index matrix of different EV capacities connected to the distribution network is constructed, and PCA is used to conduct comprehensive risk assessment. The results show that with the increase of EV capacity, the comprehensive risk assessment index value also increases, but the comprehensive risk has been alleviated within a certain range, and EV charging can be better guided. In addition, the weight coefficient of the risk index is calculated by PCA, which effectively avoids the deviation caused by the adverse influence of other subjective factors.
The raw data supporting the conclusions of this article will be made available by the authors, without undue reservation.
JD, JZ, and YL made important contributions to the concept, idea, topic selection, design and data acquisition, analysis, or interpretation of the research work; ZL and ZY wrote the manuscripts or modified their key contents; JL and ZW comprehensively reviewed and checked the final published articles.
This research was funded by Science and Technology Project of State Grid Jibei Electric Power Co., Ltd. (2021 research on distribution flexible DC networking technology of State Grid Jibei intelligent distribution center B30144210005).
JD, JZ, YL, and JL were employed by Smart Distribution Network Center, State Grid Jibei Electric Power Co. Ltd. This study received funding from Science and Technology Project of State Grid Jibei Electric Power Co., Ltd. The funder had the following involvement with the study Electric vehicle modelling.
The remaining authors declare that the research was conducted in the absence of any commercial or financial relationships that could be construed as a potential conflict of interest.
All claims expressed in this article are solely those of the authors and do not necessarily represent those of their affiliated organizations, or those of the publisher, the editors, and the reviewers. Any product that may be evaluated in this article, or claim that may be made by its manufacturer, is not guaranteed or endorsed by the publisher.
Chen, L., Zhang, Y., and Figueiredo, A. (2019). Overview of Charging and Discharging Load Forecasting for Electric Vehicles[J]. Automation Electric Power Syst. 43 (10), 269–289. doi:10.7500/AEPS20180814001
Guo, C., Liu, D., and Zhu, C. (2020). Modeling and Analysis of Electric Vehicle Charging Load in Residential Area[J]. Electric Power Automation Equipment 40 (1), 1–9. doi:10.16081/j.epae.201912015
Hou, Y. (2017). Risk and Safety Assessment of Distribution Network with Distributed Generation and Electric vehicle[D]. Changsha: Hunan University.
Hu, W., Wu, W., and Wanmeng, H. (2016). Operation Risk Assessment on Distribution System with the Integration of Electric Vehicles[J]. Mod. Electric Power 33 (2), 45–50. doi:10.19725/j.cnki.1007-2322.2016.02.008
Ju, L., Tan, Q., Lu, Y., and Tan, Z. (2019). A CVaR-Robust-Based Multi-Objective Optimization Model and Three-Stage Solution Algorithm for a Virtual Power Plant Considering Uncertainties and Carbon Emission Allowances[J]. Int. J. Electr. Power Energ. Syst. 107 (MAY), 628–643. doi:10.1016/j.ijepes.2018.12.012
Li, H., Lu, Z., and Qiao, Y. (2015). Assessment on Operational Flexibility of Power Grid with Grid-Connected Largescale Wind Farms[J]. Power Syst. Technology 39 (6), 1672–1678. doi:10.13335/j.1000-3673.pst.2015.06.032
Li, Y., Han, M., Yang, Z., and Li, G. (2021). Coordinating Flexible Demand Response and Renewable Uncertainties for Scheduling of Community Integrated Energy Systems with an Electric Vehicle Charging Station: A Bi-level Approach. IEEE Trans. Sustainable Energ. 12 (4), 2321–2331. doi:10.1109/tste.2021.3090463
Liang, Y., Wu, Y., and Zhao, M. (2020). Technical Analysis and Development prospect of New Generation Low-Voltage DC Power Supply System in the "new Infrastructure" [J/OL]. Chin. J. Electr. Eng. 1-13–1128. doi:10.13334/j.0258-8013.pcsee.201180
Liu, P., Li, H., Zhao, Y., and Zeng, K. (2015). Power Grid Security Risk Assessment Considering Comprehensive Element Importance Index[J]. Electric Power Automation Equipment 35 (4), 132–138. 144. doi:10.16081/j.issn.1006-6047.2015.04.020
Liu, S., Zhao, B., and Wang, X. (2017). Capacity Configuration Model for Robust Optimization of Stand-Alone Microgrid Based on Benders Decomposition[J]. Automation Electric Power Syst. 41 (21), 119–126.
Lu, D., and Yuan, Y. (2017). Weak Part Identification Based Onfault-Tree Monte Carlo Simulation for Islanded Microgrid[J]. Electric Power Automation Equipment 37 (4), 38–44. doi:10.16081/j.issn.1006-6047.2017.04.006
Nan, Q., Mu, Y., and Dong, X. (2020). Comprehensive Evaluation index System and Method for Fast Charging Network of Electric Vehicles[J]. Automation Electric Power Syst. 44 (1), 83–91. doi:10.7500/AEPS20190408004
Shi, W., Li, X., and Wang, X. (2018). Vul-nerability Assessment Method for Distribution Network[J]. Proc. CSU-EPSA 30 (12), 125–131. doi:10.3969/j.issn.1003-8930.2018.12.019
U.S. Department of Transportation (2018). “Federal Highway Administration,” in National Household Travel survey[EB/OL]. [2019-03-20]Avialable at: http://nhts.ornl.gov.
Wang, L., Liu, C., and W, B. (2018). Risk Based Assessment Method for Transmission System Considering the Influence of Micro-grid Charging Station[J]. Power Syst. Prot. Control. 46 (5), 114–121. doi:10.7667/PSPC170232
Xiao, B., Liu, Y., and Shi, Y. (2018). Power Supply Reliability Assessment of Mid-voltage Distribution Network Based on Principal Component Analysis[J]. Electric Power Automation Equipment 38 (10), 7–12. doi:10.16081/j.issn.1006-6047.2018.10.002
Xiong, F., Dong, B., and Li, G. (2016). Risk Evaluateon of Distribution System with Stochastic Distributed Generator[J]. Automation Electric Power Syst. 40 (12), 62–67. doi:10.7500/AEPS20160118007
Yang, J., Yi, Y., and Zhang, Y. (2020b). Operation Risk Analysis of Electric Vehicle Integrated to Distribution Network Based on Weighted Distribution Entropy[J]. Automation Electric Power Syst. 44 (5), 171–179. doi:10.7500/AEPS20190303007
Yang, M., Dai, B., and Liu, L. (2020a). A Review of Wind Power Probabilistic Prediction[J]. J. Northeast Electric Power Univ. 40 (02), 1–6. doi:10.19718/j.issn.1005-2992.2020-02-0001-06
Yuan, J., Wang, X., and Shen, G. (2016). Static Security Analysis of Power Grid Based on Comprehensive Risk Index[J]. Proc. CSU-EPSA 28 (10), 129–134. doi:10.3969/j.issn.1003-8930.2016.10.022
Zhang, J., Zhang, P., Wu, H., Qi, X., Yang, S., and Li, Z. (2019). Reliability and Risk Analysis of Load Aggregators in Demand Response [J]. Acta Energiae Solaris Sinica 40 (12), 3526–3533.
Zhang, S., Cheng, H., Zhang, L., Masoud, B., and Liangzhong, Y. (2013). Probabilistic Evaluation of Available Load Supply Capability for Distribution System[J]. IEEE Trans. Power Syst. 28 (3), 3215–3225. doi:10.1109/tpwrs.2013.2245924
Zhao, W., Jiang, F., and Tu, C. (2014). Harmonic Currents of Grid-Connected EV Charging Station[J]. Electric Power Automation Equipment 34 (11), 61–66. doi:10.3969/j.issn.1006-6047.2014.11.010
Zhao, Y., Zhou, J., and Liu, Z. (2009). Convergence Analysis and Comparison of Sequential and Nonsequential Monte-Carlo Simulation for Bulk Power System Reliability Assessment[J]. Trans. China Electrotechnical Soc. 24 (11), 127–133. doi:10.3321/j.issn:1000-6753.2009.11.020
Keywords: electric vehicle, risk assessment index, complex network, AC/DC distribution networks, new energy
Citation: Dong J, Zhao J, Liu Z, Li Y, Yu Z, Liu J and Wang Z (2022) Risk Assessment of AC/DC Hybrid Distribution Network considering New Energy and Electric Vehicle Access. Front. Energy Res. 10:816246. doi: 10.3389/fenrg.2022.816246
Received: 16 November 2021; Accepted: 24 February 2022;
Published: 18 March 2022.
Edited by:
Mohd Hasan Ali, University of Memphis, United StatesReviewed by:
Mehdi Firouzi, Islamic Azad University, Abhar, IranCopyright © 2022 Dong, Zhao, Liu, Li, Yu, Liu and Wang. This is an open-access article distributed under the terms of the Creative Commons Attribution License (CC BY). The use, distribution or reproduction in other forums is permitted, provided the original author(s) and the copyright owner(s) are credited and that the original publication in this journal is cited, in accordance with accepted academic practice. No use, distribution or reproduction is permitted which does not comply with these terms.
*Correspondence: Ziyue Liu, MTA1NTQzNTAwNEBxcS5jb20=
Disclaimer: All claims expressed in this article are solely those of the authors and do not necessarily represent those of their affiliated organizations, or those of the publisher, the editors and the reviewers. Any product that may be evaluated in this article or claim that may be made by its manufacturer is not guaranteed or endorsed by the publisher.
Research integrity at Frontiers
Learn more about the work of our research integrity team to safeguard the quality of each article we publish.