 Rong Xia
 Yang Zhao2
- 1State Key Laboratory of Power Grid Environmental Protection, China Electric Power Research Institute Co., Ltd., Wuhan, China
- 2Cable Branch of State Grid Beijing Electric Power Co., Ltd., Beijing, China
- 3College of Electrical Engineering and New Energy, Three Gorges University, Yichang, China
A capacitive coupling sensor for partial discharge detection with the fusion of high voltage XLPE cable joint is designed in this paper. The sensor is to address partial discharge signals leading to transmission attenuation and external interference causing poor field detection sensitivity. First, a coaxial waveguide transmission model was established of high-frequency electrical signals in the body and joint. The result showed that the signal transmission attenuation was minimized while the sensor electrodes were closely attached to the outer semi-conductive layer of the body. Second, the equivalent circuit model was constructed of the capacitive coupling sensor fused with the 110 kV straight passing joint. The specific installation location, main structure size, detection bandwidth, and sensitivity of the sensor in the joint area were determined, which was to maximize the coupling output signal amplitude and transfer function amplitude. Finally, a lightning surge voltage test was carried out with the integration of the fusion of the joint voltage thermal cycling. Simulation and measurement show the following: while the sensor is installed in the cable metal sleeve break and the electrodes are closed to the overall semi-conductive layer, there is excellent performance for partial discharge detection in the frequency range of 1–300 MHz, with a sensitivity of 5 pC.
Introduction
The power grid may have abnormal operating events including insulation breakdown and line shutdown if the high voltage cable insulation defects cannot be detected in time (Zhou et al., 2014; Fang, 2018). Of the operational faults of high-voltage cable lines, 70% are caused by the joint according to statistics (Luo et al., 2003; Li et al., 2004; Jiang, 2007). Partial discharge is one of the main factors causing insulation deterioration and triggering joint faults. Therefore, partial discharge detection is an important technical means to discover potential insulation defects of high voltage XLPE cable joint in an efficient manner.
Researchers had developed various principles of partial discharge detection methods for a series of physicochemical phenomena accompanying the partial discharge (Liang, 2019). There are mainly electromagnetic coupled, capacitance coupling, ultrasonic, and UHF methods (Meng et al., 2015; Wang, 2017; Shu et al., 2018; He J. et al., 2020). Meanwhile, many achievements have been made in cables and accessories in the transmission law of PD (partial discharge) signals, signals spectrum identification, and PD source location (Chen, 2017; Shen, 2018; Wang et al., 2019; Wu et al., 2020). However, PD detection still faces the problems of weak signals, complex and variable waveforms, and susceptibility to external electromagnetic interference (Zhao, 2018; Xie et al., 2019). These problems hamper the accurate sensing and effective identification of PD signals.
Many efforts have been made to solve the problem of significant attenuation of PD signals in transmission. A capacitive coupling sensor with a response band of 500 MHz built into the body was developed (Tang et al., 2008). A simulated field defect PD test using a patch type partial discharge sensor built into both sides of the joint shield was conducted (Luo et al., 2018). The experiments could obtain a good PD detection effect and better shield the external interference. A built-in partial discharge detection system based on a differential capacitance sensor was designed in reference (He N. et al., 2020). The detection system had a good detection effect on the three types of defect models constructed (Yang et al., 2021a; Yang et al., 2021b). The built-in PD sensor is designed and optimized by using the integrated model of the built-in sensor in the cable intermediate joint (Ge, 2016). Several built-in sensor capacitance coupling charged correction technologies were studied and found that based on the equivalent circuit simulation of built-in cable capacitance coupling sensor of charged highest accuracy calibration method (Wang et al., 2017).
The sensor needs to be close to the outer semi-conducting layer of the cable to get a better coupling effect because the semi-conductive layer of the cable will accelerate the attenuation of PD signals. Therefore, this study designs a capacitive coupling sensor fused with high voltage XLPE cable joint, based on the principle of capacitive coupling, and combining with the characteristics of high partial discharge at the joint. The corresponding relationship was analyzed between the circuit components and the physical structure by establishing the equivalent circuit model of the built-in coupling sensor. The influence of the circuit component parameters on the detection performance and frequency response characteristics of the sensor was calculated. The ring electrode width and the insulating pad thickness were determined by combining the numerical calculation and experimental test results. The installation position and structural dimensions of the sensor were optimized. Experiments were conducted to verify the performance of the fused sensor in terms of safety and partial discharge detection.
High Voltage XLPE Cable Joint Partial Discharge Signals Coupling Method and Sensor Design
Design of Partial Discharge Signal Coupling
The internal structure of the cable joint is much more complex than that of the cable body, therefore, taking the cable model YJLW03-Z 64/110 1 × 800 as an example, high frequency partial discharge signal is analyzed with distance transmission in the cable body. Its structure is shown in Figure 1.
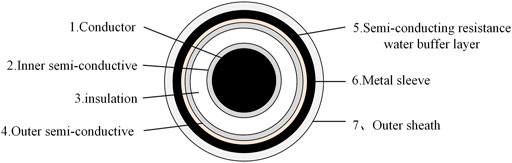
FIGURE 1. Schematic cross-sectional structure of the body of the 110 kV cable.
The high frequency electrical signals in high voltage XLPE cable can be considered as a coaxial waveguide in the form of a uniform transmission line. Its equivalent model is shown in Figure 1.
The series impedance in Figure 2 can be expressed as:
where r1 is the radius of the first layer structure (conductor) of the cable body from inside out, r6 is the inner radius of the sixth layer structure (metal sleeve), σ1 is the conductivity of copper, σ6 is the conductivity of aluminum, and μ0 is the permeability in vacuum.

FIGURE 2. 110 kV cable uniform transmission line model.
The cable parallel admittance consists of insulating layer and semi-conductive layer, which can be expressed as:
where
ε0 is the vacuum dielectric constant with a value of 8.85 × 10⁻¹² F/m,
Yi(ω) is the parallel admittance of the structure of layer i.
The value of Yi(ω) is related to the relative complex dielectric constant of the structural material of the layer and the internal and external radii of the structural layer.
The propagation coefficient of the uniform transmission line model for high voltage XLPE cable can be deduced from the series impedance and parallel admittance expressions as:
where
α is the attenuation coefficient, and β is the phase constant.
ATP-EMTP software was used to establish a uniform transmission model of high voltage XLPE cable, which was to investigate the influences of the inner and outer semi-conductive layer on the transmission characteristics of high frequency signals. Sine waves
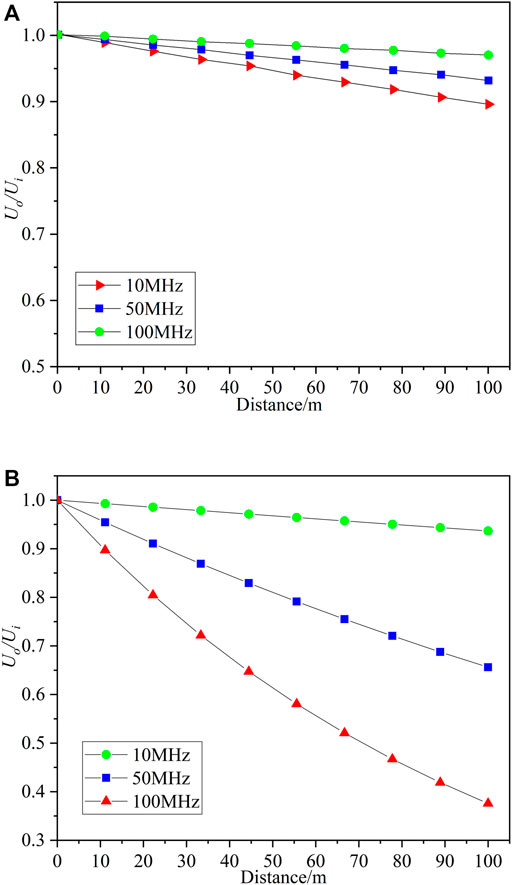
FIGURE 3. Variation of transmission attenuation of signal amplitude at different frequencies with axial distance of high-voltage cable. (A) Without semi-conductive layer. (B) With semi-conductive layer.
Signal amplitude decays faster than low frequency signals with the increase in transmission distance for high frequency signals, which can be seen from Figure 3. The signal amplitude decay is faster than the case without considering the influence of the semi-conductive layer while the influence of the semi-conductive layer is considered. The higher the frequency, the greater the influence of the semi-conductive layer on the signal decay.
The coupling of the PD signals is achieved by the sensor through the principle of capacitive voltage division. The equivalent circuit is shown in Figure 4.
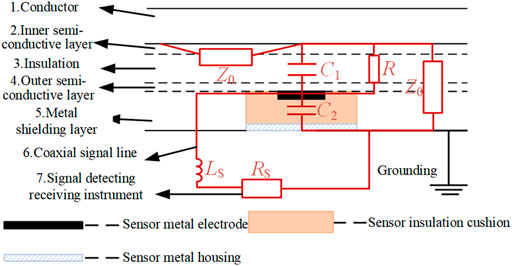
FIGURE 4. Schematic of the capacitive coupling principle of the local amplifier signal in the connector.
where Z0 is the cable characteristic impedance, C1 is the coupling capacitance between the cable core and the metal enclosure of the sensor, C2 is the stray capacitance between the metal electrode of the sensor and the metal enclosure, R is the cable insulation resistance of the joint area, Ls is the stray inductance on the coaxial signal cable, and RS is the coupling output resistance.
Selection of Sensor Location
A 110-kV combined prefabricated straight passing joint is used as the research object. The protection tail pipe of high voltage XLPE cable joint is divided into a long end and a short end. The sensor can only be installed on the break side of the metal enclosure due to the short end area has limited space.
To determine the appropriate installation position of the sensor in the long end area of the protection liner, the following numerical calculation model was established: The joint center to the long end of 515 mm was taken as the origin. From the origin, the sensor was moved with a step of 10 mm from the origin. The excitation source was injected at the short end of the joint with the amplitude of 1 A and the frequencies of 37, 105, and 148 MHz, respectively. The average value of the voltage coupled to the sensor under the action of the three frequency excitation sources at the same installation position is shown in Figure 5.
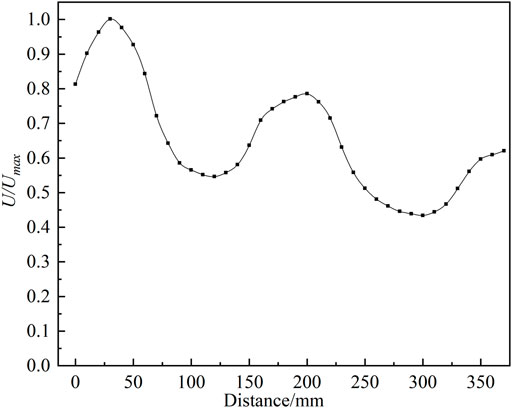
FIGURE 5. Average values of coupling signals for different installation positions of sensors in the long end zone of the protection tail pipe.
The amplitude of the coupling signal is not monotonically decaying with increasing distance which can be seen from Figure 5. The sensors in both long end and short end areas are chosen to be installed at the metal enclosure break of the body considering the factors of sensor coupling signal amplitude attenuation, installation convenience, and fusion reliability at various locations.
Design of Sensor Structure
The transfer function of the sensor in the frequency domain is given by:
As can be seen from Equation 5, while frequency is low, R and RS mainly affect the power frequency voltage division. So, the power frequency high voltage is mainly in R, and the detection system only has a small voltage drop. The main influence on the transfer function is determined by the ratio of C1 and C2 for the high frequency PD signal. C1 and C2 are correlated with the sensor structure parameters, electrode width, and insulation pad thickness. The relationship can be expressed as:
where
ε0 is the vacuum dielectric constant, εr1 is the relative dielectric constant of the insulation material, being 2.3 for XLPE, D1 is the overall diameter of the cable insulation layer, D2 is the inner diameter of the cable insulation layer, W is the sensor electrode width, εr2 is the relative dielectric constant of the insulation pad layer, and the insulation pad layer uses silicone rubber material with relative dielectric constant 2.6,
d is the thickness of the insulation pad layer,
d1 is the sensor electrode thickness with a value of 1 mm, r4 is the overall diameter of the semi-conducting layer.
Equations 6 and 7 are taken into Equation 5. The stray inductance Ls takes the value of 10 mH, and the frequency is taken as the center frequency of the designed detection band. The above parameters are taken into the transfer function to obtain the relationship between amplitude change, sensor electrode width, and insulation layer thickness, as shown in Figure 6.
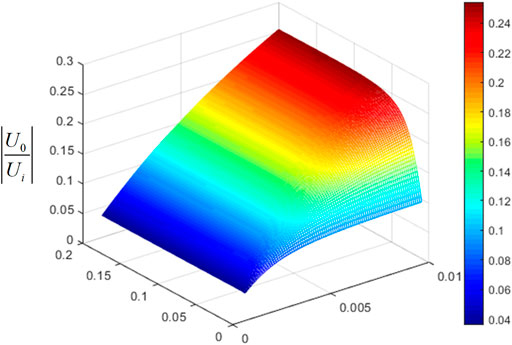
FIGURE 6. Variation curve of transfer function amplitude with electrode width and insulation pad thickness.
The greater the thickness of the sensor insulation pad layer and the transfer function amplitude, the better the detection performance, which can be seen from Figure 5. While the thickness of the insulation pad layer is less than 4 mm, the sensor electrode width has less influence on the transfer function amplitude. While the insulation pad layer thickness is greater than 4 mm, the sensor electrode width gradually increases the influence on the transfer function amplitude. The sensor shell is designed to be at the same level as the cable metal sleeve and the thickness of the insulation pad layer is 6 mm, which is to ensure the installation reliability and is for facilitating its lap with the cable metal sleeve and achieving equipotential to shield and protect the sensor.
The transfer function amplitude and sensor electrode width are obtained while the thickness of the sensor insulation pad layer is 6 mm, as shown in Figure 7. The transfer function amplitude remains relatively high while the sensor electrode width is between 40 and 80 mm.
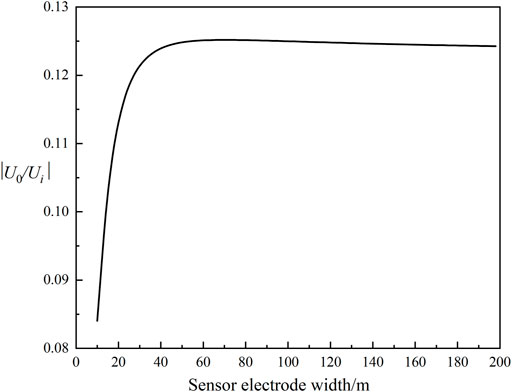
FIGURE 7. Variation curve of transfer function amplitude with electrode width.
The sensor was designed with electrode widths of 40, 50, 60, and 80 mm to further determine the optimal width of the circular electrode of the capacitive coupling sensor. The same square wave signal was injected at one end of the cable to simulate the partial discharge source. The response signals of the sensor were tested under four different electrode widths, with the results shown in Figure 8. The signal works best while the electrode width is 50 mm. So, the sensor electrode width is designed to be 50 mm.
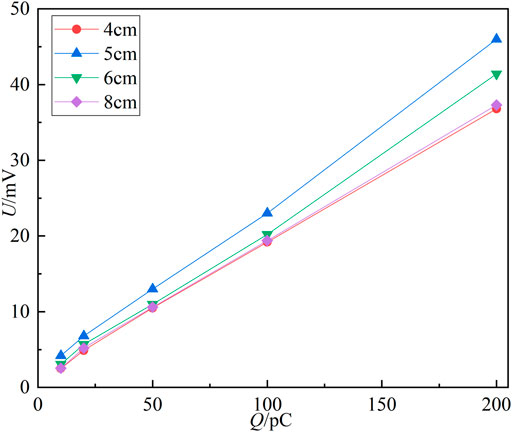
FIGURE 8. Impulse response curves of electrode sensors with different widths.
Study of Sensor Key Performance
Setting of Sensor Bandwidth
Ansoft HFSS software was used to analyze the electric field component distribution of electromagnetic waves with frequency of 100, 200, 300, and 400 MHz in the joint, which was to determine the design range of the sensor detection band.
The higher the signal frequency, the faster the signal decays with transmission distance increasing as can be seen from Figure 9. While the frequency reaches 400 MHz and the distance from the signal source is above 600 mm, the signal will decay to less than 10% of the initial value. Therefore, the sensor bandwidth is set to (1–300) MHz to strike a balance between the signal amplitude and the detection bandwidth.
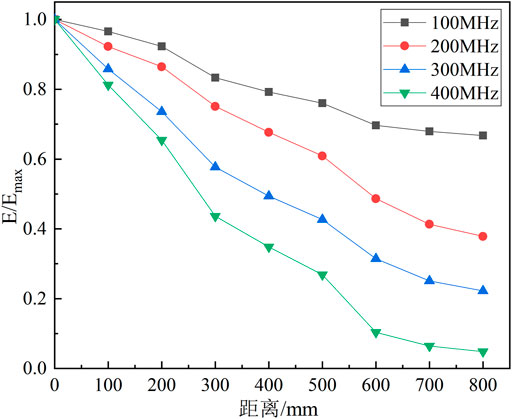
FIGURE 9. Four kinds of frequency variable electromagnetic field in the joint electric field component with distance transmission attenuation change curve.
Analysis of Sensor Frequency Response Characteristics
The values of C2, RS, and Ls in the circuit were set to 10, 50, and 10. Respectively, C1 is increased from 10 to 30. Calculate the frequency response characteristic curve of the built-in capacitive coupling sensor under different coupling capacitances, as shown in Figure 10.
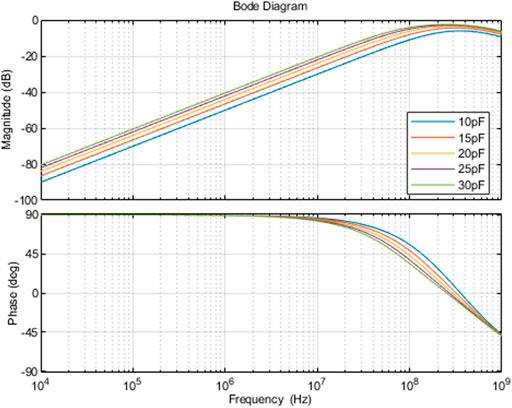
FIGURE 10. Frequency response characteristic curve of the sensor with different coupling capacitance.
C1 has a relatively significant impact on the sensor frequency response. While C1 increases, the sensor frequency response gain also increases. But the increase will be reduced. While the frequency is less than 100 MHz, the effect of C1 on the frequency response of the sensor decreases as the frequency increases while the frequency is greater than 100 MHz. Therefore, C1 should be kept within an appropriate range.
C2 was increased from 5 to 100 pF and other conditions remained the same. The frequency response characteristic curves of the built-in capacitively coupled sensor with different stray capacitance is calculated, as shown in Figure 11.
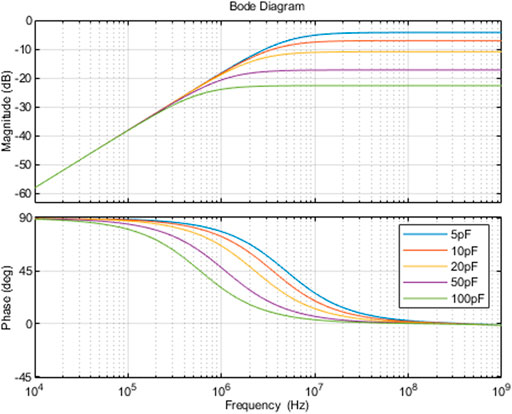
FIGURE 11. Frequency response with different stray capacitance.
The stray capacitance C2 has negligible effect on the sensor frequency response gain while the frequency is less than 300 kHz. However, as the frequency increases, while the frequency is more than 1 MHz, the increase of C2 will greatly reduce the frequency response gain, which will weaken the sensor detection effect.
The stray inductance LS was set to 0, 10, 20, and 50 nH, respectively, and kept other conditions constant. The frequency response characteristics of the built-in capacitively coupled sensor are shown in Figure 12.
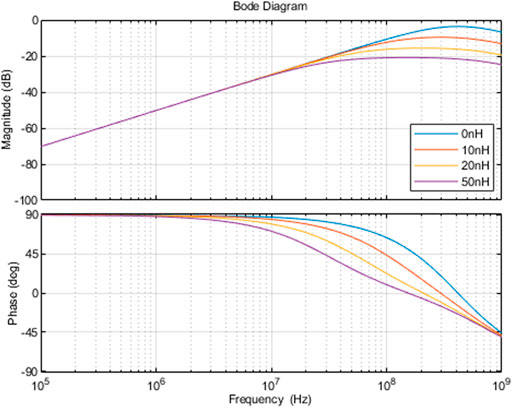
FIGURE 12. Frequency response with different stray inductance.
The effect of stray inductance LS on the frequency response gain of the sensor is small, with the increase of frequency, the influence gradually increases, while the frequency is less than 20 MHz. The increase of Ls significantly reduces the frequency response gain, further weakening the detection ability while the frequency is more than 100 MHz.
Analysis of Sensor Signal Coupling Characteristics
The influence of C1, C2, and Ls circuit parameters on sensor detection effect was analyzed by observing the change of sensor output waveform.
The C1 was gradually increased from 10 to 30 pF, and the values of other parameters remained unchanged. The output waveform corresponding to each capacitance value is shown in Figure 13. The amplitude of the waveform detected by the capacitance sensor increases significantly and the rise time of the waveform increases.
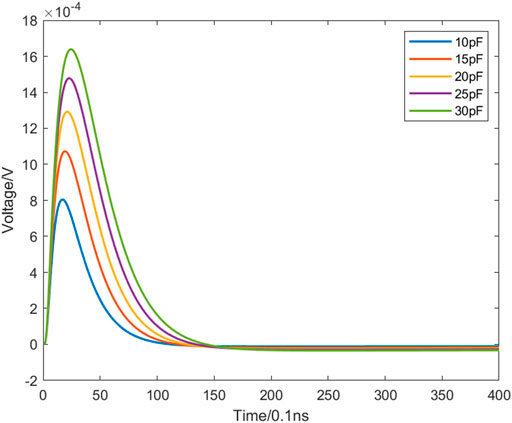
FIGURE 13. Effect of C1 on sensor detection performance.
The C2 was gradually increased from 1 to 50 pF with the values of other parameters unchanged. The detected waveform of the capacitive sensor is shown in Figure 14. As can be seen, the increase in C2 results in a significant decrease in the amplitude of the waveform and an increase in the rise time of the waveform.

FIGURE 14. Effect of C2 on sensor detection performance.
The value of Ls was gradually increased from 5 to 50 nH with the values of other parameters unchanged. The detected waveform of the capacitive sensor is shown in Figure 15.
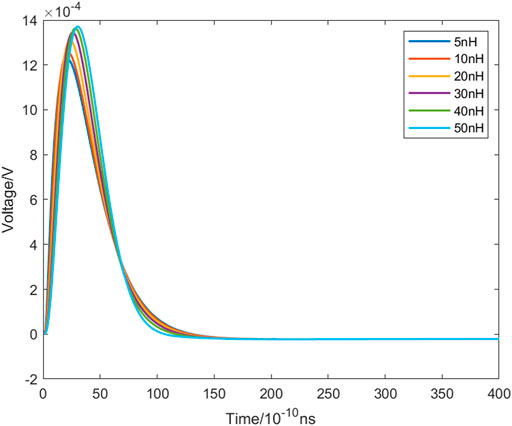
FIGURE 15. Effect of Ls on sensor detection performance.
The value of Ls has a smaller effect on the waveform amplitude detected by the capacitive sensor, after comparing to C2. But as the value of stray inductance increases, the rise time increases and oscillations occur in the wave tail, which can have an impact on the detection accuracy of the sensor.
Electrical Performance Test of High-Voltage Cable Joints Incorporating Capacitively Coupled Sensors
Analysis of Sensor Signal Coupling Characteristics
The frequency sweep test of a 110-kV combined prefabricated straight passing joint with capacitive coupling sensor was carried out to analyze the frequency response characteristics of the sensor. The swept-frequency signal was injected from one end of the cable between the conductor and the metal shield, and the frequency range of the swept signal was set to 1 GHz. The spectrum analysis of the sensor-coupled swept signals was performed by Anglient9320B spectrum analyzer. The frequency response of the sensor is better within 300 MHz.
High frequency pulse signal injection tests were performed on the sensor under laboratory conditions to determine the ability of the sensor to couple signals. The sensor was mounted on the connector, and the signal generator output a square wave signal with a rising edge of 5 ns. A 10-pF capacitor was connected in series at the output, and a charge of 5 pC was injected into the cable end while the amplitude of the pulse square wave was 500 mV, the sensor can effectively couple the analog discharge pulse of 5 pC in the cable by comparing the amplitude of the signal and the baseband.
Thermal Cycling Voltage Test
The cable specimen consisted of a 6-m 110 kV cable with a prefabricated straight passing joint containing a capacitive coupling sensor. One segment of the specimen was bent into a U shape with a diameter of less than 25 (d + D) × 1.05. Heat the specimen by conductor current for at least 8 h and ensure that the conductor temperature exceeded the maximum temperature for normal cable operation for at least 2 h during each heating cycle (the actual temperature was maintained at 95–98°C). Next, the specimen was naturally cooled for at least 16 h until the conductor temperature was cooled to less than 30°C or cooled to within 15 K above ambient temperature, taking the higher of the two, but not higher than 45°C (the actual temperature was controlled at 22–32°C). The above experiments were referred to 12.4.6 in GB/T 18,890.1.
• Heating and cooling cycles 20 times
• Voltage applied to cable specimen 2U0
• The upper limit of AC voltage output 600 kV
• The upper limit of current output 20 A
• The upper limit of analog load current output in FKGB thermal cycle intelligent control system 5000 A
• Analog load current output step ±5 A
• Conductor temperature measurement accuracy ±0.5°C
The cable joint had good electrical performance while fused with the capacitive coupling sensor, and the joint and sensor had stable performance throughout the test, without breakdown phenomenon.
Lightning Surge Voltage Test
CDYH-4800 kV/960 kJ lightning surge voltage tested system; the purpose is to verify the sensor safety detection performance.
• The upper limit of lightning impulse voltage output ±4800 kV
• The upper limit of lightning impulse power 960 kJ
The shock voltages of positive and negative polarity are applied to the specimen during the test. The lightning surge voltage amplitude was 550 kV, with a wavefront time of 5 μs and a half-wave peak time of 54 µs. No damage was found to the connector or the sensor during or after the test.
Conclusion
1) The sensor is installed at the break in the metal sleeve of the cable and the electrode close to the outer semi-conductive layer because the overall semi-conductive layer of the cable can cause severe attenuation to high frequency signal transmission.
2) The frequency band of the sensor is designed at (1–300) MHz, while the frequency of the electromagnetic wave exceeds 300 MHz, the signal in the joint decays rapidly with the propagation distance.
3) The sensor electrode width is designed to be 50 mm, and the insulation layer thickness of 6 mm is achieved by the reliable installation of the sensor, which obtains a good signal coupling effect.
4) The sensor has a good response in the (1–300) MHz band range, and the local discharge signal detection sensitivity reaches 5 pC in the design of the sensor band response and sensitivity tests.
5) The joint and the sensor are unaffected by frequency voltage and lightning shock, and no damage is found in the connector body and the sensor after the field lightning shock tests.
Data Availability Statement
The original contributions presented in the study are included in the article/Supplementary Material. Further inquiries can be directed to the corresponding author.
Author Contributions
CF, BO, YZ, and RX conceived the idea and designed the experiments. CF and RX led the experiments. CF, BO, RX, and YW contributed to data analysis and interpretation. CF, YZ, YW, and YX wrote the paper. All authors read and approved the final manuscript.
Funding
This study received funding from research and application of key technologies of perceptual integration and edge enabling of high voltage cable lines in an urban power grid (Science and Technology Project No. 5500-202111118A-0-0-00 of State Grid Co., Ltd.). The funder was not involved in the study design, collection, analysis, interpretation of data, the writing of this article, or the decision to submit it for publication.
Conflict of Interest
Authors RX, BO and YW are employed by the State Key Laboratory of Power Grid Environmental Protection, China Electric Power Research Institute Co., Ltd., author YZ is employed by Cable branch of State Grid Beijing Electric Power Co., Ltd.
The remaining authors declare that the research was conducted in the absence of any commercial or financial relationships that could be construed as a potential conflict of interest.
Publisher’s Note
All claims expressed in this article are solely those of the authors and do not necessarily represent those of their affiliated organizations, or those of the publisher, the editors, and the reviewers. Any product that may be evaluated in this article, or claim that may be made by its manufacturer, is not guaranteed or endorsed by the publisher.
References
Chen, T. (2017). “Research on Propagation of Partial Discharges in HV XLPE Cable System,” (Beijing: North China Electric Power University). dissertation/master’s thesis.
Fang, Y. (2018). “Method for Detecting Crimp Defects of Cable Joint Based on Temperature Measurement and its Application,” (Chongqing: Chongqing University). dissertation/master’s thesis.
Ge, Z. (2016). “Study on Partial Discharge Sensor of Intermediate Joint of High Voltage XLPE cable,” (Beijing: North China Electric Power University). dissertation/master’s thesis.
He, J., Tian, T., Song, X., Wang, H., Chen, R., and Zhu, X. (2020a). Research on Partial Discharge Identification Method of Switchgear Based on UHF Method. High Voltage Apparatus 56, 11. doi:10.13296/j.1001-1609.hva.2020.11.015
He, N., Ren, Z., Chen, P., Shi, L., Li, H., Wu, C., et al. (2020b). Research on Partial Discharge Characteristics of Typical Defects in XLPE cable. Electr. Technol. 13, 6. doi:10.19768/j.cnki.dgjs.2020.13.041
Jiang, P. (2007). Analysis and Assessment of the Breakdown Fault of Homemade XLPE Power Cables. Electric Wire & Cable 002, 1–5. doi:10.3969/j.issn.1672-6901.2007.02.001
Li, H., Zhou, Z., and Chen, P. (2004). Fault Analysis of 110 kV and above High Voltage XLPE cable System. Electr. Equipment 3 (08), 9–13.
Liang, Y. (2019). “On Online Measurement of the Power Cable’s Partial Discharge,” (Xi'an: Xi'an University of Electronic Science and technology). dissertation/master’s thesis.
Luo, J., Qiu, Y., and Yang, L. (2003). Operation Fault Analysis of CLPE Power Cable above 10kV. High Voltage Eng. 06, 14–16. doi:10.13336/j.1003-6520.hve.2003.06.007
Luo, J., Wang, J., Gao, F., and Fang, J. (2018). Application of Built-In Partial Discharge Sensor in 110 kV cable Joint. Electromechanical Inf. 24, 46–47. doi:10.19514/j.cnki.cn32-1628/tm.2018.24.024
Meng, S., Wang, Y., Xia, R., and Yang, D. (2015). Online Correction of Partial Discharge On-Site Detection for Power Cables Based on Capacitance Coupling Method. High Voltage Eng. 41 (11), 3766–3774. doi:10.13336/j.1003-6520.hve.2015.11.034
Shen, C. (2018). “Design and Development of XLPE Cable Partial Discharge Data Analysis System Based on Feature Map and Recognition Technology,” (Shanghai: Shanghai Jiao Tong University). dissertation/master’s thesis.
Shu, B., Li, Y., Zhao, H., Xu, Y., Qian, Y., and Sheng, G. (2018). Design of a High-Frequency Current Sensor Used for Detection of Cable Partial Discharge. Electr. automation 40 (03), 105–108. doi:10.3969/j.issn.1000-3886.2018.03.031
Tang, J., Deng, Z., Gong, N., Zhang, X., and Wei, G. (2008). Performance Analysis of Inner Sensors Used for Partial Discharge Detection in cable Accessories. J. Chongqing Univ. 11 (07), 760–765. doi:10.11835/j.issn.1000-582x.2008.07.011
Wang, M. (2017). “Research on High Voltage Switchgear Partial Discharge On-Line Monitoring Based on Ultrasonic Sensor,” (Guangzhou: South China University of Technology). dissertation/master’s thesis.
Wang, T., Gu, X., Xu, Y., Xia, R., Shao, Y., and Ma, D. (2017). Research on Calibration Technology of XLPE cable Built-In Sensor for Detecting Partial Discharge. High Voltage Apparatus 53 (06), 129. doi:10.13296/j.1001-1609.hva.2017.06.022
Wang, X., Zhou, K., Xie, M., Huang, Y., Rao, X., and Li, R. (2019). Research on Partial Discharge Source Location for Power Cables Based on Time Reversal Phase Method. Power Syst. Tech. 44 (02), 783–790. doi:10.13335/j.1000-3673.pst.2019.0434
Wu, S., Zheng, S., Zhong, A., Dai, W., and Sohail, S. (2020). Location Method of Multiple Partial Discharges Sources in Substation Space by UHF Method Based on Intelligent Clustering Algorithm. High Voltage Eng. 46 (12), 4309–4318. doi:10.13336/j.1003-6520.hve.20200787
Xie, J., Liu, Y., Liu, L., Liu, L., Tang, G., and Li, X. (2019). A Partial Discharge Signal Denoising Method Based on Adaptive Weighted Framing Fast Sparse Representation. Proc. CSEE 39 (21), 6428–6439. doi:10.13334/j.0258-8013.pcsee.190142
Yang, N., Yang, C., Wu, L., Shen, X., Jia, J., Li, Z., et al. (2021b). Intelligent Data-Driven Decision-Making Method for Dynamic Multi-Sequence: An E-Seq2Seq Based SCUC Expert System. IEEE Trans. Ind. Inf., 1. doi:10.1109/TII.2021.3107406
Yang, N., Yang, C., Xing, C., Ye, D., Jia, J., Chen, D., et al. (2021a). Deep Learning‐based SCUC Decision‐making: An Intelligent Data‐driven Approach with Self‐learning Capabilities. IET Gener. Transm. Distrib., 1–12. doi:10.1049/gtd2.12315
Zhao, Y. (2018). “Partial Discharge Signal Denoising of Synchronous Wavelet Transform Based on Iterative Layered Threshold,” (Wuhan: Wuhan University of Science and Technology). dissertation/master’s thesis.
Keywords: partial discharge detection, capacitive coupling, fusion, sensitivity, frequency band range
Citation: Xia R, Zhao Y, Ouyang B, Wang Y, Fang C and Xu Y (2022) Study of Capacitive Coupling Sensor Fused With High Voltage XLPE Cable Joint. Front. Energy Res. 10:813643. doi: 10.3389/fenrg.2022.813643
Received: 12 November 2021; Accepted: 05 January 2022;
Published: 15 February 2022.
Edited by:
Yahui Zhang, Yanshan University, ChinaCopyright © 2022 Xia, Zhao, Ouyang, Wang, Fang and Xu. This is an open-access article distributed under the terms of the Creative Commons Attribution License (CC BY). The use, distribution or reproduction in other forums is permitted, provided the original author(s) and the copyright owner(s) are credited and that the original publication in this journal is cited, in accordance with accepted academic practice. No use, distribution or reproduction is permitted which does not comply with these terms.
*Correspondence: Chunhua Fang, NDU5NDY4NjZAcXEuY29t