- 1Wuhan University of Technology, Wuhan, China
- 2Wuhan Road Rover Intelligent Technology Co., Ltd., Wuhan, China
- 3Liuzhou Wuling Automobile Industry Co., Ltd., Liuzhou, China
Unlike the solid cargo in the truck, the liquid in the tank truck fluctuates with the movement of the vehicle. Most of the current research study focuses on the transverse shock caused by the sloshing liquid and control of the liquid movement in the lateral direction. However, the movement of the fluid in the longitudinal direction also harms the vehicle dynamic. It is caused by the acceleration or deceleration of the truck. To lower the risk, the T-shaped anti-sloshing baffle is designed based on the current research study. To improve the conflict performance of the anti-sloshing baffle, the approximation model and multi-objective optimization method are initiated. The relationship between the anti-sloshing effect and the structural parameters of the anti-sloshing baffle is established by the Kriging method. The NSGA-II is initiated to minimize the maximum pressure caused by the moving liquid and the increasing mass of the anti-sloshing baffle. The maximum pressure is decreased by 40.97%, and the anti-sloshing baffle mass is decreased by 2.77%. With the optimized anti-sloshing baffle, the maximum pressure, waving damping time, and the baffle mass are decreased; the force on the tank walls and baffles is distributed more evenly, and the safety of the truck is improved.
Introduction
Tank trucks are a primary road transportation method of hazardous liquid materials in the world. The tank truck-involved accidents may cause a hazardous material leak which is more harmful than the accident itself. Compared to the truck carrying the solid cargo, the tank trucks are susceptible to rollover due to their size, height of the gravity center, distribution of weight, and the sloshing of liquid in the tank during transportation (Iranitalab et al., 2020). Thus, solving the sloshing problem can improve the safety of the tank truck. There are some researchers in the earthquake areas focusing on the liquid sloshing problem. The properly designed baffle in the vertical tank can reduce the pressure on the tank caused by the sloshing liquid. A suspended annular baffle hanging from the floating roof of cylindrical oil tanks subjected to the earthquake is validated by a scaled experiment (Hosseini et al., 2017). The effect of elastic baffles is also investigated (Zhang et al., 2020). These methods are effective but difficult to be built in the tank truck.
In the tank truck area, some work has been carried out to minimize the liquid sloshing effect. Zhang, J., et al. initiated a numerical model based on the Newtonian Herschel–Bulkley, Bingham equation, and the volume of the fluid method to study the dynamic behavior of a tank with the baffle in the lateral direction (Zhang et al., 2016). Hasheminejad, S. M., et al. used the linear potential theory and conformal mapping technique to develop rigorous mathematical models for transient sloshing under a lateral excitation (Hasheminejad et al., 2014). The free surface-touching horizontal side baffles, a central surface-piercing, and a bottom-mounted vertical baffle are considered in their work. Xue, M. A., et al. analyzed the pressure on the tank with four baffles with the experimental method (Xue et al., 2017). The vertical baffle with a four-square perforation has the maximum pressure compared to the tank with the immersed bottom-mounted vertical baffle, vertical baffle flushing with a free surface, and perforated vertical baffle. The influence of the four-square perforation needs to be further analyzed. Akyıldız, H., et al. investigated the liquid sloshing in the cylindrical tank with different ring baffle combination by a scaled experimental method (Akyıldız et al., 2013). The best baffle arrangement is determined by comparing the pressure of the four arrangements. Kolaei, A., et al. built an analytical model to analyze the transient lateral slosh force by the linear slosh theory (Kolaei et al., 2014). In their research, the tank with four different cross sections, circular, elliptical, modified-oval, and Reuleaux triangle are compared; the tanks with a lower overall mass center and critical slosh length have better anti-roll stability. Based on the analytical model, the fluid mass moment in a clean-bore tank, top-mounted baffle, and bottom-mounted baffle are compared to the equivalent rigid cargo. The top-mounted baffle shows the best anti-sloshing ability when the partly filled numbers are 0.8 and 0.92, which are higher than 0.5. The bottom-mounted baffle may be more effective than the top-mounted baffle when the partly filled is lower than 0.5. Compared to the CFD (computational fluid dynamic) method, it can save computation time, but it also needs further research to be initiated in the baffle with a complicated cross section (Kolaei et al., 2017). Wang, W., et al. used a semi-analytical scaled boundary finite-element method (SBFEM) to study the effects of the T-shaped baffle in elliptical tanks (Wang et al., 2016). Three T-shaped baffles are taken into consideration, including surface-piercing, bottom-mounted, and their combined form, and Y-shaped baffles are also included. The parameters of the baffles are associated with the anti-sloshing performance. Xue, M. A., et al. used the virtual boundary force (VBF) method to model the internal baffles of a rectangular tank (Xue and Lin, 2011). The result is validated by the experiment; the effects of ring baffles on reducing liquid sloshing are analyzed and discussed. Belakroum, R., et al. provided a method based on an arbitrary Lagrangian–Eulerian (ALE) description of the Navier–Stokes equation (Belakroum et al., 2010). The baffles are mounted on the bottom; the sidewall of a rectangular tank is discussed in their research.
The current research of the tank focuses on lateral excitation, and some new method is used in the analysis of the tank with a simple cross-section baffle. Despite the lateral excitation, the longitudinal movement of the mass center damages also the handling stability (Wan et al., 2019). The CFD method is efficient in this field. Ünal, U. O., et al. carried out the liquid sloshing calculations of rectangular tanks with T-shaped baffles using laminar and turbulent viscous flow solvers (Ünal et al., 2019). The baffle is fully effective in pressure and wave damping when its height is higher than 80% of the liquid level since the tank in this research is fitted with a perforated baffle, which cannot be described by the Q-S model and the pendulum model (Wan et al., 2019). Some commercial platforms are widely used in solving liquid sloshing problems, such as OpenFOAM (Sanapala et al., 2018) and Fluent. The simulation result is validated by the experimental method.
The effect of the ring baffle in the longitudinal direction and the T-shaped baffle in the transverse is proved by the current research study. To investigate the fluid fluctuation process during the acceleration and brake process, the CFD model of the current tank and the tank with a T-shaped baffle in the longitudinal direction is built and analyzed. To improve the anti-sloshing performance and lower the mass of the baffle, the Kriging method and NSGA-II (non-dominated sorted genetic algorithm) are initiated to optimize the parameter of a T-shaped anti-sloshing baffle. According to the comparison of the anti-sloshing performance and the mass of the tank with the current anti-sloshing baffle, the T-shaped baffle before and after optimization and the optimized T-shape baffle have the lowest pressure, force, and mass, which is beneficial to the safety of the tank truck.
Theory
The movement of the fluid can be described by the continuity equation, momentum equation, and energy equation.
Continuity Equation
The continuity equation is also known as the mass equation which is based on the law of conservation of mass. The mass that flows from the fluid unit equals the decreased mass of the fluid unit. The continuity equation can be impressed as follows:
Here,
Momentum Equation
The momentum equation is based on the momentum conservation equation. The change rate of the momentum in the fluid unit is caused by the sum of the external force on the fluid volume. The momentum conservation can be written as follows:
where
Energy equation
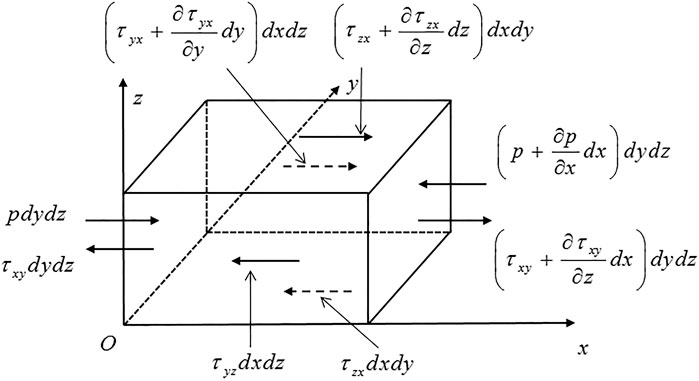
The energy equation is gained based on the law of conservation of energy. The change rate of the energy in the fluid unit equals the sum of power generated by the force on the fluid unit. The change rate of the energy is made up of two parts: the power caused by the codirectional pressure and speed divergence and the dissipated energy caused by viscosity force (Anderson and Wendt, 1995). The force analysis of the flow particle in the
where
Model Establishment
It is difficult to record the movement of the fluid in the tank; therefore, most researchers use scaled transparent tanks to initiate the field test. In Yin Wan’s work, the test result of a scaled tank is taken as a reference to validate the CFD model built by Fluent (Wan, 2018).
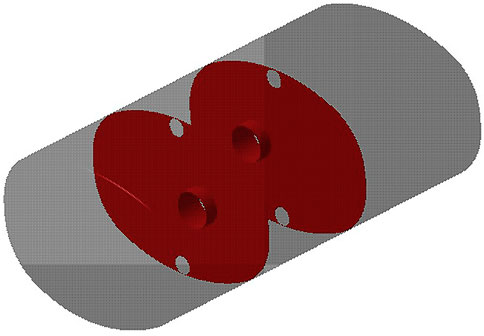
For the tank truck in this case, the tank is made up of two separate chambers, each of them having two anti-sloshing baffles (baffles 1 and 2, from front to rear of the tank truck), as shown in Figure 2. The geometry parameter of the tank is summarized as length, 9,124 mm, width, 2,464 mm, height, 1771 mm, and the radius of the hole, 275 mm.
The layout of the two chambers is the same; therefore, only one chamber is used to establish the CFD model. The boundary of the fluid area is determined based on the tank structure. The established CFD model has 511,125 elements.
The movement of the fluid inside the tank trunk is hard to be determined; therefore, the scaled model with the transparency tank is used in Yin Wan’s work to validate the CFD model (Wan et al., 2019). Considering the analysis process of Yin Wan’s work as a reference, the VOF (volume of fluid) and transient solver type are set in the CFD model. The Reynolds number for this case is bigger than 2,320; thus, the standard
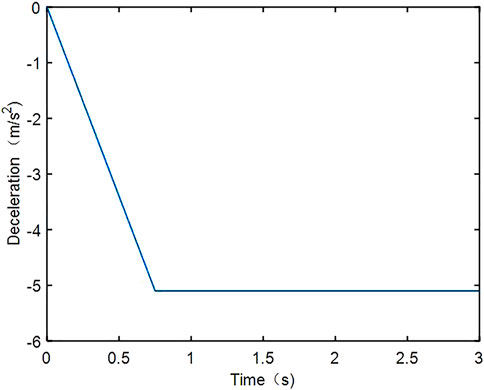
The fluid movement in the longitudinal direction is mainly caused by the acceleration of the truck in this direction. Thus, the acceleration and deceleration processes should be analyzed to determine the boundary condition. For the tank truck, the acceleration
Here,
For the deceleration ability, the truck should satisfy some regulations. Since the tank truck is an N3 vehicle, according to the regulation in ECE R13 (NoRegulation, 2009) and GB 12676-1999 (Liu, 1999) in China, the distance during the brake process from the beginning to end of the brake can be acquired by the following equation.
Here,
According to Equation 9, the calculated deceleration
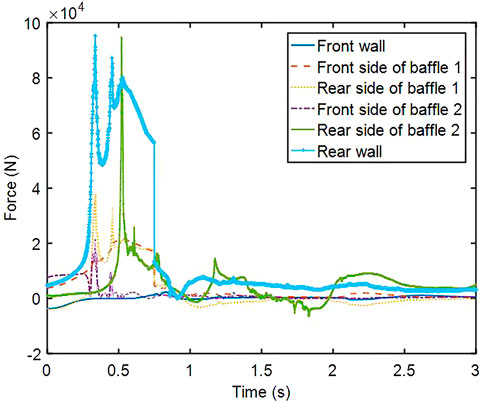
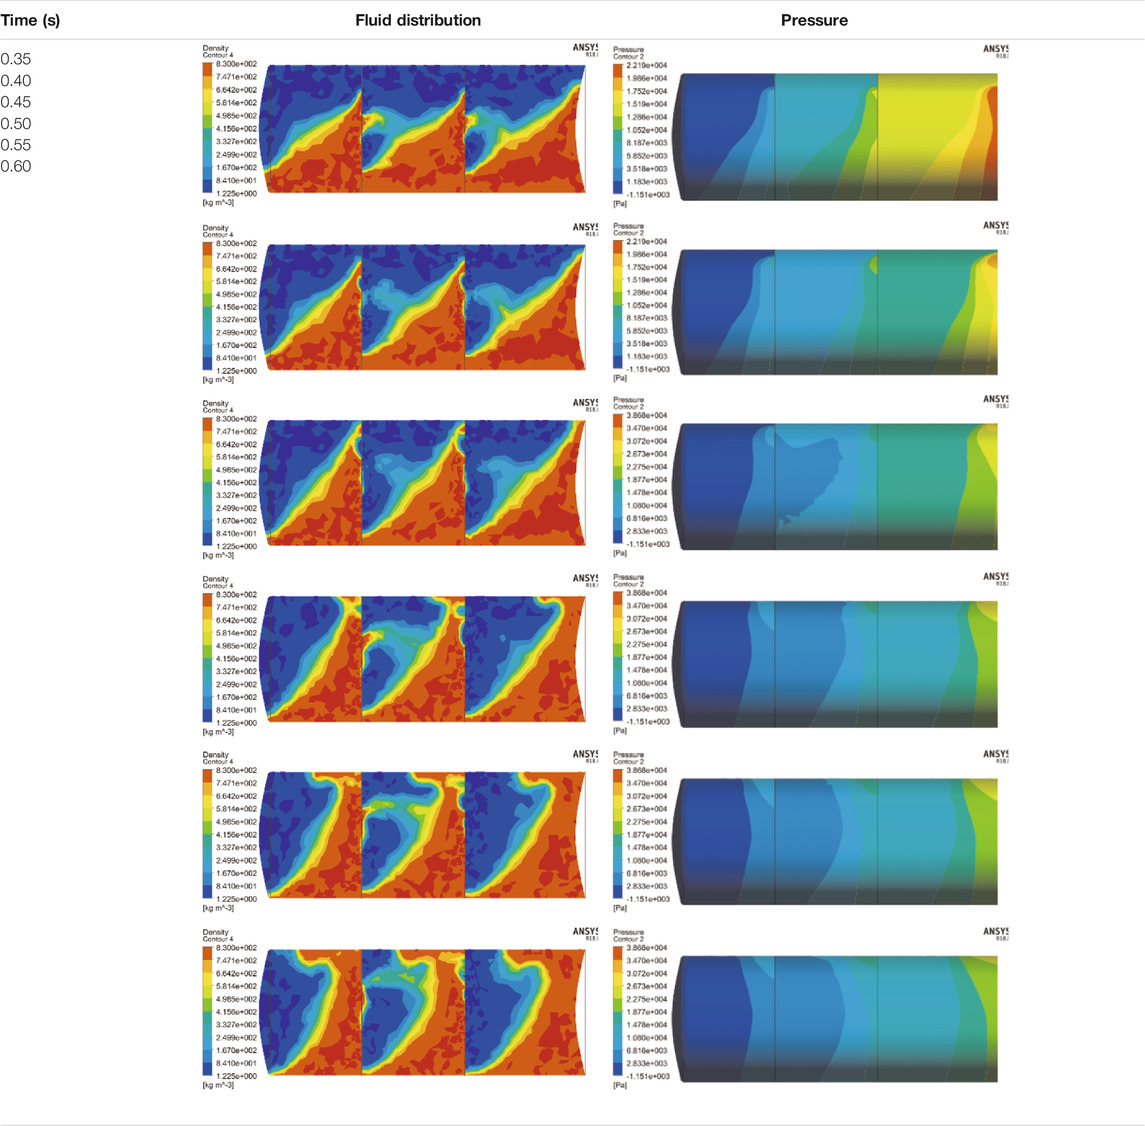
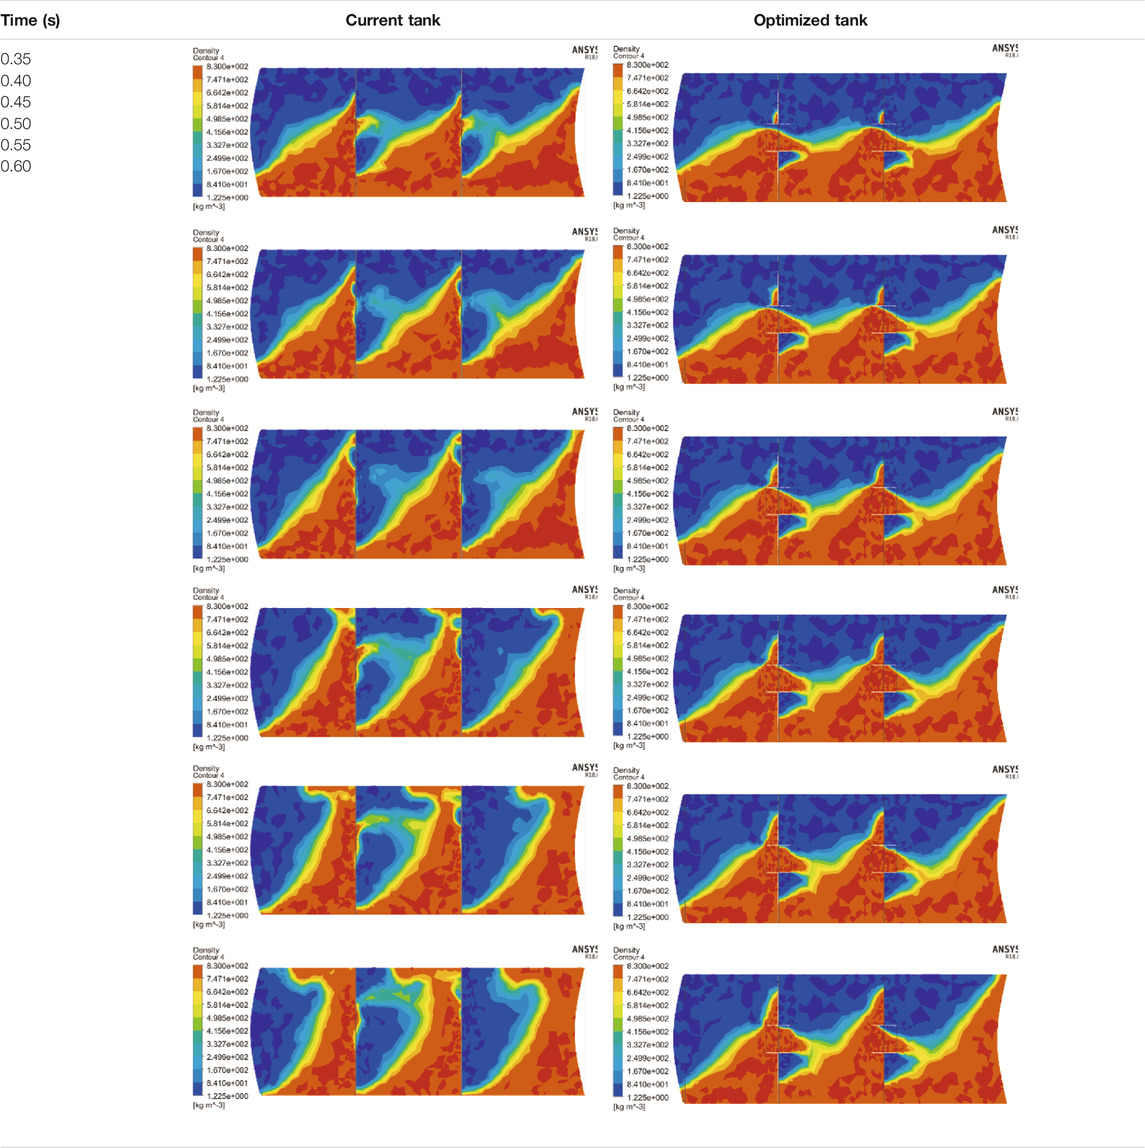
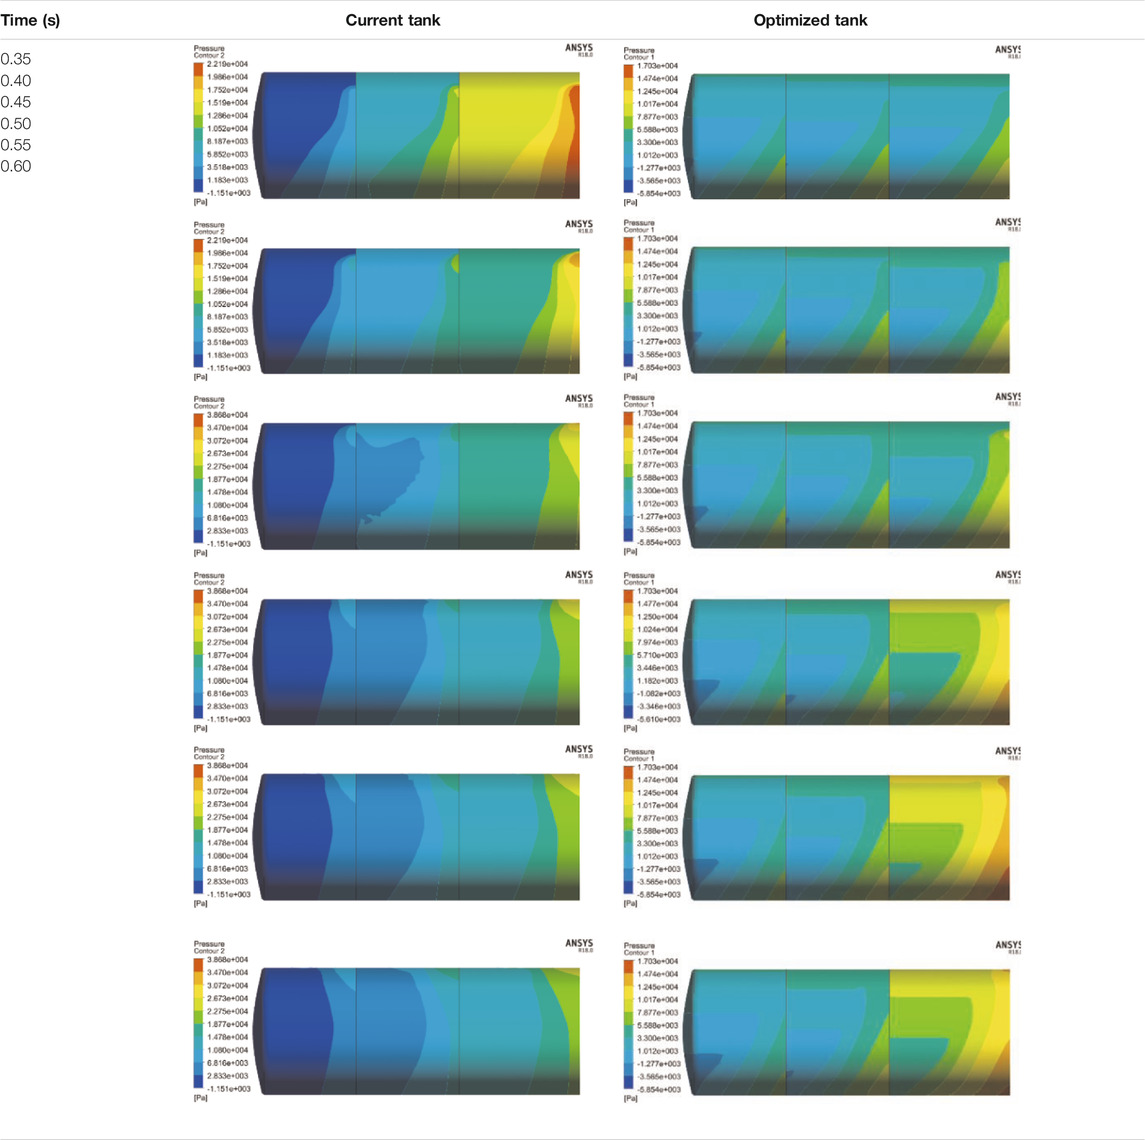
Figure 4 shows the absolute value of the force on the front, the rear wall of the tank, and the baffles. Actually, during the deceleration process, the force on the front wall, the rear side of baffles 1 and 2 have opposite directions of the other walls. During the acceleration and deceleration process, the force on the wall has the opposite direction. Therefore, the direction of the force is ignored during the analysis. During the deceleration process, the rear wall and rear side of baffle 2 have the maximum forces; the maximum forces occur during 0.35–0.6 s. The details of fluid distribution and pressure on the tank are shown in Table 1.
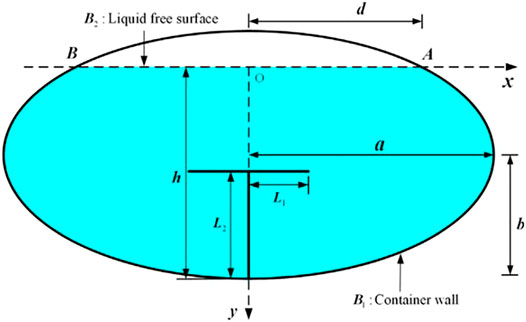
According to the work of Wenyuan Wang et al., the T-shaped baffle (as shown in Figure 5) is set in the tank to lower the movement of the fluid in the transverse direction (Wang et al., 2016). Based on the concept, the design of the baffle in the tank is provided, as shown in Figure 6; the cross section is shown in Figure 7. Normally, the pressure of the tank is taken as the anti-sloshing performance indicator; the lower pressure means the better performance. The improvement of the anti-sloshing capability may increase the weight of the tank. Thus, the pressure and anti-sloshing baffle weight are taken as the objectives while the four geometry parameters in Figure 7 are chosen as the variables to be optimized.
For conflict objectives, multi-objective optimization is usually used to find the optimal parameter solution. In this case, it takes about 12.5 h to calculate the fluid movement in the tank with a workstation equipped with an E5-1620 V4 CPU. It is impossible to initiate each combination during the parameter optimization. Therefore, to optimize the tank parameters more efficiently, the approximation model is necessary to save computation time.
Approximation Model
The approximation model is an approximation of the simulation result; it is widely used to build a simpler model with a lower computational cost. During this method, the internal behavior of the original simulation does not need to be understood; only the input and output are important (Díaz-Manríquez et al., 2016). Normally, three major steps are necessary to build an approximation model. First, some limited sampling points should be chosen, and the corresponding response of these points is calculated by the original model. With these data points, some techniques, such as rational functions, response surface method (Narendran and Karthikeyan, 2020), radial basis functions, Kriging models, polynomial regression, splines, and support vector machines, can be initiated to build the approximation model. At last, the accuracy of the approximation model should be validated before further analysis.
Design of the experiment
During the design of the experiment (DOE) process, the sampling points are selected with the optimal Latin hypercube design (OLHD). The advantage of this method is that it distributes the sampling points evenly by optimal conditions (Baek and Lee, 2020). Compared to the Latin hypercube design, it has improved projection properties and spatial fill properties. According to the OLED, the 60 sample points are distributed evenly without overlapping points. With the distributed variable points, 60 CFD models are built and simulated to gain the corresponding objective value. With the 60 groups’ objective value and variable, the relationship between the objective and variables can be established by the Kriging method.
Kriging model
The typical form of the Kriging model can be expressed as follows (Simpson et al., 2001; Yu et al., 2020):
Here,
In the above equation,
where
The predicted value at the unknown point can be expressed as follows:
where
The estimated variance can be gained by
The maximum likelihood estimation (MLE) of the Kriging model can be expressed as
The optimal fitted Kriging approximation model can be acquired by solving the unconstraint
Model validation
Normally, the coefficient of determination
where
The error analysis in Table 2 shows that the established Kriging model is accurate enough for further analysis.
Multi-Objective Optimization
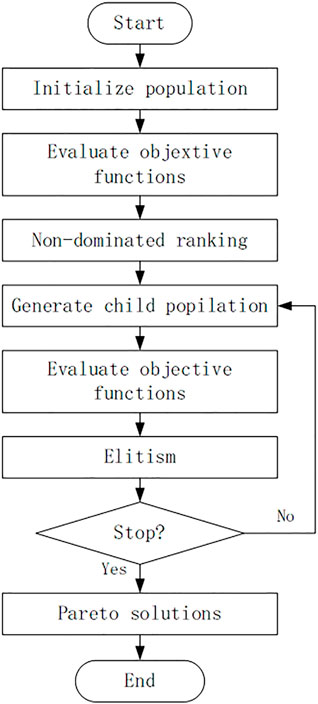
The NSGA-II approach, which is proposed by Deb et al. (Deb et al., 2002), is chosen to settle the multi-objective optimization problem. This method is based on the genetic algorithm with fast non-dominated sorting and crowded distance sorting methods to achieve Pareto solutions. It is widely used in the engineering area due to its advantages (Jiang et al., 2021), (Peng et al., 2021), (Li et al., 2021), (Zhang et al., 2021), (Li et al., 2020). The detail of NSGA-II is introduced in the study by Sedighizadeh et al., (2014). The optimization procedure of NSGA-II is presented in Figure 8.
According to the geometry space in the tank, the range of the variables can be determined, as shown in Table 3.
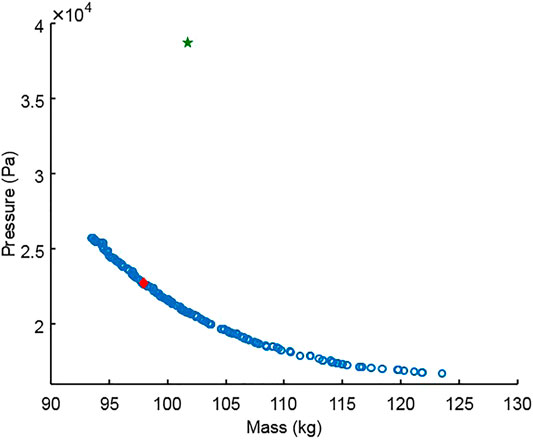
The Pareto front can be gained based on the above input. As shown in Figure 9, the mass of the anti-sloshing baffle and pressure caused by the moving fluid formed a curve with a different variable value. The green star means the initial value of the current anti-sloshing baffle; the red dot is chosen as the optimal result.
Results and Discussion
The corresponding variable values of the optimal results
The comparison shows that the fluid movement after optimization is lower than before optimization, especially during 0.5–0.6 s. The T-shaped baffle can lower the fluid strike caused by truck deceleration. The decreased percentage can be identified by comparing the pressure and force on the tank. The pressure before and after optimization is compared in Table 5. The legend of each picture varies depending on the maximum pressure.
Besides the mass of baffles, maximum pressure, and force, the wave damping time after the shock caused by the acceleration and deceleration is also a vital indicator to judge the anti-sloshing performance of the baffle. The wave damping time means the period between the end of the shock, and the liquid is back to the original state.
The calculated mass of the baffles, maximum pressure, and force of the current tank and the tank with optimized baffles during the braking process are listed in Table 6.
According to the comparison in Table 6, with the optimized parameters, the baffle mass decreased with a percentage of 2.77%. The maximum pressure decreased with a dramatic percentage of 40.97%; the maximum force on the front and rear wall of the tank also decreased. The wave damping time of the oil also gets a reduction of 10.69%. Since the baffles bear with the sloshing liquid, the force on the baffles inside the tank increased. For the current tank, the maximum of the baffles and the front wall is much lower than the optimized tank. However, the work condition of the acceleration process is opposite to the deceleration process, which means, the maximum force on the front wall will be 84.07 kN, when the vehicle accelerates with the same acceleration. Therefore, during the strength design, the thickness of the front and rear walls should be the same, so does the baffles. For the tank with optimized parameters, the distribution of the force on the baffles, front, and rear wall are more even; thus, the thinner wall of the tank may be taken into consideration.
Conclusion
Based on the current analysis method and idea, a T-shaped baffle in the longitudinal direction is designed and optimized to lower the fluid movement in the tank during the brake process.
For the regular baffle, the baffles have a much lower force than the front and rear walls of the tank. Thus, the mass of the tank can be decreased by lowering the thickness of the baffles if only taking the acceleration (the maximum acceleration is lower than the maximum deceleration with the opposite direction) and deceleration work condition into consideration.
Compared to the regular baffle, the effect of the T-shaped baffle can decrease the force and pressure on the tank while the baffle inside the tank bears a bigger strike. The lower force and pressure caused by the moving fluid means the T-shaped anti-sloshing baffle can decrease the fluctuation of the fluid gravity center. Thus, the safety of the tank truck is improved.
Data Availability Statement
The original contributions presented in the study are included in the article/Supplementary Material, further inquiries can be directed to the corresponding author.
Author Contributions
YL was responsible for the manuscript and provided the original idea with BH. LZ and SZ finished the calculation task. BH provided the idea and was responsible for the correspondence.
Funding
This study was funded by the Innovative Research Team Development Program of Ministry of Education of China (IRT_17R83), and the 111 Project (B17034) of China.
Conflict of Interest
LZ was employed by the Company Wuhan Road Rover Intelligent Technology Co., Ltd.
SZ was employed by the Company Liuzhou Wuling Automobile Industry Co., Ltd.
The remaining authors declare that the research was conducted in the absence of any commercial or financial relationships that could be construed as a potential conflict of interest.
Publisher’s Note
All claims expressed in this article are solely those of the authors and do not necessarily represent those of their affiliated organizations, or those of the publisher, the editors, and the reviewers. Any product that may be evaluated in this article, or claim that may be made by its manufacturer, is not guaranteed or endorsed by the publisher.
References
Akyıldız, H., Ünal, N. E., and Aksoy, H. (2013). An Experimental Investigation of the Effects of the Ring Baffles on Liquid Sloshing in a Rigid Cylindrical Tank. Ocean Eng. 59, 190–197.
Anderson, J. D., and Wendt, J. (1995). Computational Fluid Dynamics, 206. New York: McGraw-Hill, 332.
Baek, S.-W., and Lee, S. W. (2020). Design Optimization and Experimental Verification of Permanent Magnet Synchronous Motor Used in Electric Compressors in Electric Vehicles. Appl. Sci. 10 (9), 3235. doi:10.3390/app10093235
Belakroum, R., Kadja, M., Mai, T. H., and Maalouf, C. (2010). An Efficient Passive Technique for Reducing Sloshing in Rectangular Tanks Partially Filled with Liquid. Mech. Res. Commun. 37 (3), 341–346. doi:10.1016/j.mechrescom.2010.02.003
Deb, K., Pratap, A., Agarwal, S., and Meyarivan, T. (2002). A Fast and Elitist Multiobjective Genetic Algorithm: NSGA-II. IEEE Trans. Evol. Computat. 6 (2), 182–197. doi:10.1109/4235.996017
Díaz-Manríquez, A., Toscano, G., Barron-Zambrano, J. H., and Tello-Leal, E. (2016). A Review of Surrogate Assisted Multiobjective Evolutionary Algorithms. Comput. intelligence Neurosci. 2016. doi:10.1155/2016/9420460
Hasheminejad, S. M., Mohammadi, M. M., and Jarrahi, M. (2014). Liquid Sloshing in Partly-Filled Laterally-Excited Circular Tanks Equipped with Baffles. J. Fluids Structures 44, 97–114. doi:10.1016/j.jfluidstructs.2013.09.019
Hosseini, M., Goudarzi, M. A., and Soroor, A. (2017). Reduction of Seismic Sloshing in Floating Roof Liquid Storage Tanks by Using a Suspended Annular Baffle (SAB). J. Fluids Structures 71, 40–55. doi:10.1016/j.jfluidstructs.2017.02.008
Iranitalab, A., Khattak, A., and Bahouth, G. (2020). Statistical Modeling of Cargo Tank Truck Crashes: Rollover and Release of Hazardous Materials. J. Saf. Res. 74, 71–79. doi:10.1016/j.jsr.2020.04.010
Jiang, R., Jin, Z., Liu, D., and Wang, D. (2021). Multi-Objective Lightweight Optimization of Parameterized Suspension Components Based on NSGA-II Algorithm Coupling with Surrogate Model. Machines 9 (6), 107. doi:10.3390/machines9060107
Kolaei, A., Rakheja, S., and Richard, M. J. (2017). Coupled Multimodal Fluid-Vehicle Model for Analysis of Anti-slosh Effectiveness of Longitudinal Baffles in a Partially-Filled Tank Vehicle. J. Fluids Structures 70, 519–536. doi:10.1016/j.jfluidstructs.2017.02.012
Kolaei, A., Rakheja, S., and Richard, M. J. (2014). Effects of Tank Cross-Section on Dynamic Fluid Slosh Loads and Roll Stability of a Partly-Filled Tank Truck. Eur. J. Mech. - B/Fluids 46, 46–58. doi:10.1016/j.euromechflu.2014.01.008
Li, J., Khodayar, M. E., Wang, J., and Zhou, B. (2021). Data-driven Distributionally Robust Co-optimization of P2P Energy Trading and Network Operation for Interconnected Microgrids. IEEE Trans. Smart Grid. doi:10.1109/tsg.2021.3095509
Li, J., Liu, C., Khodayar, M. E., Wang, M.-H., Xu, Z., Zhou, B., et al. (2020). Distributed Online VAR Control for Unbalanced Distribution Networks with Photovoltaic Generation. IEEE Trans. Smart Grid 11 (6), 4760–4772. doi:10.1109/tsg.2020.2999363
Narendran, J., and Karthikeyan, T. (2020). Response Surface Methodology Based on Polyamide Incorporated with Biolubricant for Optimisation of Operating Parameters in Heavy Vehicles. Int. J. Heavy Vehicle Syst. Vol. 27, 97–125.
No, , and Regulation, E. C. E. (2009). Uniform Provisions Concerning the Approval of Vehicles of Gategories M, N and O with Regard to Braking, 13.
Peng, D., Tan, G., Tang, J., and Guo, X. (2021). Design and Optimization of Forced-Air Cooling System for Commercial Vehicle Brake System. SAE Int. J. Commercial Vehicles 15.
Sanapala, V. S., M, R., Velusamy, K., and Patnaik, B. S. V. (2018). Numerical Simulation of Parametric Liquid Sloshing in a Horizontally Baffled Rectangular Container. J. Fluids Structures 76, 229–250. doi:10.1016/j.jfluidstructs.2017.10.001
Sedighizadeh, M., Faramarzi, H., Mahmoodi, M. M., and Sarvi, M. (2014). Hybrid Approach to FACTS Devices Allocation Using Multi-Objective Function with NSPSO and NSGA-II Algorithms in Fuzzy Framework. Int. J. Electr. Power Energ. Syst. 62, 586–598. doi:10.1016/j.ijepes.2014.04.058
Simpson, T. W., Mauery, T. M., Korte, J., and Mistree, F. (2001). Kriging Models for Global Approximation in Simulation-Based Multidisciplinary Design Optimization. AIAA J. 39 (12), 2233–2241. doi:10.2514/3.15017
Ünal, U. O., Bilici, G., and Akyıldız, H. (2019). Liquid Sloshing in a Two-Dimensional Rectangular Tank: A Numerical Investigation with a T-Shaped Baffle. Ocean Eng. 187, 106183. doi:10.1016/j.oceaneng.2019.106183
Wan, Yin. (2018). Study on Vehicle-Liquid Coupling Dynamic Characteristics and Anti-rollover Control Method for Tank Vehicles. China: Jilin University, MA.
Wan, Y., Zhao, W., Zong, C., Zheng, H., and Li, Z. (2019). Modeling and Analysis of the Influences of Various Liquid Sloshing Characteristics on Tank Truck Dynamics. Int. J. heavy vehicle Syst. 26 (3-4), 463–493. doi:10.1504/ijhvs.2019.101468
Wang, W., Guo, Z., Peng, Y., and Zhang, Q. (2016). A Numerical Study of the Effects of the T-Shaped Baffles on Liquid Sloshing in Horizontal Elliptical Tanks. Ocean Eng. 111, 543–568. doi:10.1016/j.oceaneng.2015.11.020
Xue, M.-A., and Lin, P. (2011). Numerical Study of Ring Baffle Effects on Reducing Violent Liquid Sloshing. Comput. Fluids 52, 116–129. doi:10.1016/j.compfluid.2011.09.006
Xue, M.-A., Zheng, J., Lin, P., and Yuan, X. (2017). Experimental Study on Vertical Baffles of Different Configurations in Suppressing Sloshing Pressure. Ocean Eng. 136, 178–189. doi:10.1016/j.oceaneng.2017.03.031
Yu, M., Li, X., and Liang, J. (2020). A Dynamic Surrogate-Assisted Evolutionary Algorithm Framework for Expensive Structural Optimization. Struct. Multidisc Optim 61 (2), 711–729. doi:10.1007/s00158-019-02391-8
Zhang, J., Wu, W., and Hu, J. (2016). A Numerical Study of the Effects of the Longitudinal Baffle on Nickel Ore Slurry Sloshing in a Prismatic Cargo Hold. Mar. Structures 46, 149–166. doi:10.1016/j.marstruc.2016.01.003
Zhang, K., Zhou, B., Or, S. W., Li, C., Chung, C. Y., and Voropai, N. I. (2021). Optimal Coordinated Control of Multi-Renewable-To-Hydrogen Production System for Hydrogen Fueling Stations. IEEE Trans. Industry Appl. doi:10.1109/tia.2021.3093841
Keywords: anti-sloshing baffle, tank truck, multi-objective optimization, NSGA-II, fluid movement
Citation: Lei Y, Zhang L, Zhong S and Huang B (2022) Multi-Objective Optimization of a T-Shaped Anti-Sloshing Baffle Based on NSGA-II. Front. Energy Res. 10:810937. doi: 10.3389/fenrg.2022.810937
Received: 08 November 2021; Accepted: 14 February 2022;
Published: 11 March 2022.
Edited by:
Jian Zhao, Shanghai University of Electric Power, ChinaReviewed by:
Scappaticci Lorenzo, Università degli Studi Guglielmo Marconi, ItalyAntonio Mattia Grande, Politecnico di Milano, Italy
Vasant Annasaheb Matsagar, Indian Institute of Technology Delhi, India
Copyright © 2022 Lei, Zhang, Zhong and Huang. This is an open-access article distributed under the terms of the Creative Commons Attribution License (CC BY). The use, distribution or reproduction in other forums is permitted, provided the original author(s) and the copyright owner(s) are credited and that the original publication in this journal is cited, in accordance with accepted academic practice. No use, distribution or reproduction is permitted which does not comply with these terms.
*Correspondence: Bin Huang, aHVhbmdiaW5Ad2h1dC5lZHUuY24=
 Yu Lei1
 Bin Huang