- 1State Grid Hubei Electric Power Research Institute, Wuhan, China
- 2College of Electrical Engineering and Automation, Fuzhou University, Fuzhou, China
- 3Fujian Province University Engineering Research Center of Smart Distribution Grid Equipment, Fuzhou, China
This paper proposes an improved alternating current (AC) arc model based on the Cassie-Mayr hybrid model and magnetohydrodynamics (MHD) theory. The undetermined parameters of the traditional Cassie-Mayr arc model are mainly obtained by subjective methods such as empirical value, approximate expression, and indirect estimation which are complex, inaccurate, and dependent on experimental data. To overcome these disadvantages, an axisymmetric two-dimensional arc model is established based on the MHD theory, and the undetermined parameter values of the Cassie-Mayr hybrid arc model are obtained based on the results of MHD numerical simulation. The accuracy of the proposed modified Cassie-Mayr model is verified by comparing with experimental data, and the results of the modified Cassie-Mayr model, traditional Mayr model, and Cassie model are discussed. The arc characteristics of serval loads are studied and analyzed based on the modified model.
1 Introduction
In a low voltage AC power transmission system, due to the loose connection of junctions, insulation deterioration, or equipment overload, low voltage arcing may happen. The high temperature in the arcing area and the electrochemical reaction may lead to electrical fire accidents, posing a great threat to safety (Campbell and Dini, 2016). Therefore, it is of great significance to study the dynamic electrical characteristics of AC arcs. At present, the research method for AC fault arcs mainly depends on experiments. However, data of arc fault sites are difficult to measure and the requirements for an experimental environment are strict. Meanwhile, the measurement errors will introduce uncertainty into the results, which will affect the accuracy of the arc characteristics. Therefore, it is of great necessity to establish an accurate and reasonable mathematical model of fault arcs to provide theoretical guidance for detection of fault arcs and the design of arc fault switch protection devices.
The research of arc dynamic models can be divided into two parts. The first part is numerical models based on the internal physical characteristics of arc plasma. Based on computational fluid dynamics theory (CFD), the fluid equations and electromagnetic equations are solved together, and the arc plasma field characteristics are obtained. In a previous study (Wu et al., 2008), based on MHD theory, a 3D arc model was constructed and the effect of different chamber widths to arc motion was investigated. In other studies (Rong et al., 2010; Wu et al., 2011; Rondot et al., 2014; Bo et al., 2018; Liu et al., 2021), 3D arc plasma models of breakers and relays were built and simulated. The arc model based on MHD theory can accurately simulate the physical characteristics of arc evolution. However, MHD theory assumes that the plasma is in local thermodynamic equilibrium (LTE) state, so this model cannot simulate the arc initiation process and the reignition process after the current crosses zero. Moreover, the MHD model requires large computing resources and takes a long time to simulate.
The second part is the mathematical model based on arc external characteristics. This kind of model describes arcs by lumped parameters such as voltage and current, regardless of the physical field inside the arc. The models are mainly represented by arc empirical equations (Nottingham, 1923; Miller and Hildenbrand, 1973; Stokes and Oppenlander, 1991) and black box models. Black box arc models mainly include Cassie, Mayr, and improved models based on them. Previous works (Guardado et al., 2005; Yu et al., 2011) analyzed the Cassie and Mayr models, discussing the suitable stage of them. In other studies (Schavemaker and Sluis, 2002; Chittora et al., 2015), Cassie and Mayr models were used to study the arc voltage and current. Another paper (Ju and Wang, 2016) proposed the Habedank model combining Cassie and Mayr models, and established the arc model in a DC power system. One study (Ullah et al., 2016) proposed the Browne model. The Cassie model was used when the current was high, and the Mayr model was used after the current crossed zero. There are several undetermined parameters in the black box model. Traditional black box models assume these parameters as constant values. It means that the models can only describe the arc qualitatively from a macroscopic angle, but cannot carry out accurate quantitative analysis of the arc. To address the problem, researchers have modified the black box model. In a previous work (Wang et al., 2016), an extended Habedank model is applied to pantograph arcing. The model takes train speed as function variables of dissipated power and other parameters. Another work (Walter and Franck, 2014) believes that the arc dissipation power and time constant depend on arc conductance, and proposed the Schwarz arc model. Other authors (Schavemaker and van der Slui, 2000) proposed the Schavemaker model. The time constant was set as a constant value, while the dissipated power was a function of input power. No matter the type of model used, there is no accurate theoretical calculation method for undetermined parameters at present. It still needs to be determined by experience or experiment.
This paper presents a parameter determination method of a Cassie-Mayr hybrid arc model based on MHD simulation. This model combines the advantages of accurate calculation of an MHD arc plasma model with the applicability to the intermittent arc of the Cassie-Mayr hybrid model. The structure of this paper is as follows. Section 2 introduces the equations of the Cassie-Mayr hybrid model and discusses the effect of the equation parameters to arc simulation results. Section 3 describes the MHD arc model and discusses the characteristics of arc plasma and the Cassie-Mayr equation parameters estimation method based on MHD model results. In Section 4, experimental verification of the simulation model is given, and the results of the Cassie-Mayr model modified by MHD, Mayr model, and Cassie model are compared and discussed. In addition, the arc characteristics of resistive loads, resistive capacitive loads, resistive inductive loads, and kettle loads are analyzed.
2 Cassie-Mayr Hybrid Model
2.1 Mathematical Equations
As two special cases of black box arc models, the general forms of Cassie and Mayr models (Guardado et al., 2005) are shown in Eqs 1, 2:
Cassie model:
Where gc is the arc conductivity of the Cassie model. τc is the time constant of thet Cassie model. Uc is the arc voltage constant of the Cassie model.
Mayr model:
Where gm is the arc conductivity of the Mayr model. τm is the time constant of the Mayr equation. P0 is the power dissipation constant of the Mayr model.
The Cassie model is suitable for the high current stage and the Mayr model is suitable for the low current stage. To overcome these disadvantages, the composite Cassie-Mayr hybrid arc model was proposed by King-Jet Tseng, Yaoming Wang, and Mahinda Vilathgamuwa (King-Jet Tseng et al., 1997). The Cassie-Mayr model combines two mathematical models. Incorporation of both formulas allows us to represent the arc behavior for large current (Cassie portion) as well as for small current (Mayr portion – behavior near the current crossing zero) stages. Such a combination is able to simulate electric arc behavior for different switching conditions.
Where I0 is the conversion current.
In order to avoid the calculation divergence caused by the distortion of the Cassie-Mayr hybrid model in the transition stage between the Cassie and Mayr models, the above equation is multiplied by a transition coefficient σ(i), and the Cassie-Mayr equation is transformed into Eq. 4:
Where gm is the arc conductance of the Mayr equation. gc is the arc conductance of the Cassie equation. σ(i) is the transformation function.
The transition coefficient σ(i) is defined as follows:
When the arc current i is low, the value of σ(i) tends to 1, and the arc conductance is mainly determined by the Cassie arc model. When the arc current i is high, σ(i) is negligible, and the arc conductance is mainly determined by the Mayr model.
2.2 Circuit Model and Discussion of Equation Parameters
The differential forms of the Cassie and Mayr equations in Eqs 3, 4 can be converted to integral forms, as shown in Eq. 6.
The simulation model of the Cassie-Mayr hybrid model is established by Simulink, as shown in Figure 1. The AC power voltage is 220 V, the frequency is 50 Hz, and the load resistance is 22 Ω. The electric arc is equivalent to a resistor, and the Cassie and Mayr arc model is connected in series. The Cassie equation and Mayr equation are calculated in the subsystem “Cassie equation” and “Mayr equation”, respectively. The specific computing modules of the Cassie equation and Mayr equation are shown in Figure 1B,C. Their outputs are the resistance “Rc” for the Cassie arc and resistance “Rm” for the Mayr arc. The branch current is measured by the “current sensor” module, and σ(i) (data in the model) is calculated by the measured current to determine the proportion of the Cassie portion and Mayr portion in the whole arc resistance.
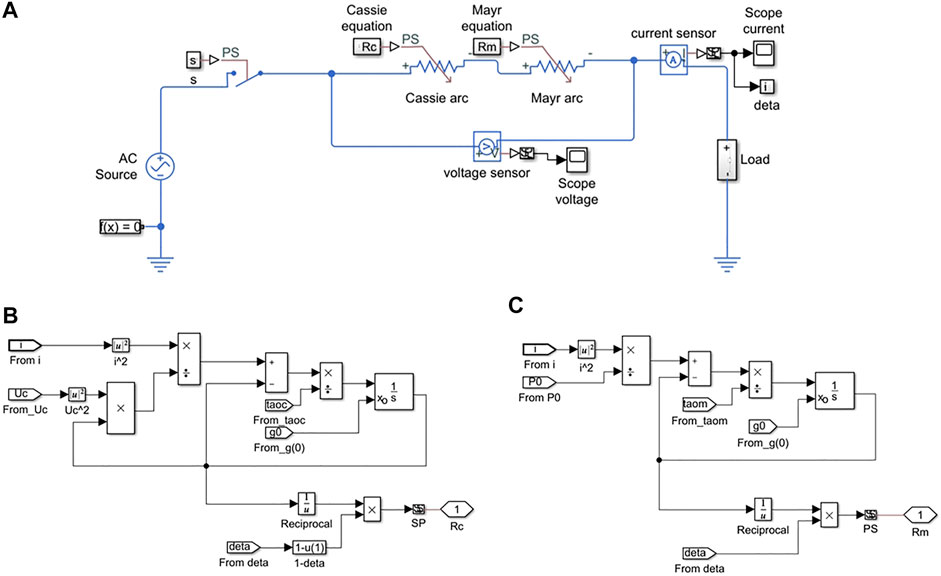
FIGURE 1. Cassie-Mayr Simulink model: (A) circuit model, (B) Cassie equation module, and (C) Mayr equation module.
The equation coefficients τm, τc, Uc, and P0 have great effects on arc characteristics. It is necessary to study the effects of coefficients. Considering that the Cassie-Mayr model switches the Cassie portion and Mayr portion by current, the effect of Cassie and Mayr parameters is analyzed respectively by the Simulink model [the Cassie-Mayr model can be converted to the Cassie or Mayr model by setting the variable “data”, i.e., σ(i), to 0 or 1]. Figures 2, 3 show the arc voltage and current at different parameters.
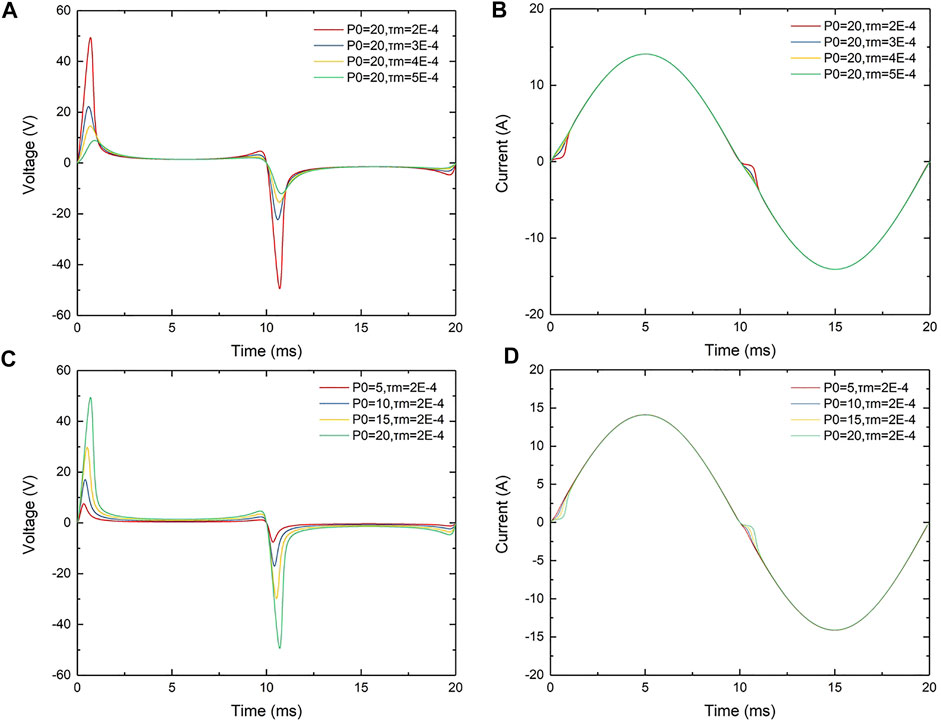
FIGURE 2. Effect of Mayr parameters. (A) Arc voltage of different τm, (B) arc current of different τm, (C) arc voltage of different P0, and (D) arc current of different P0.
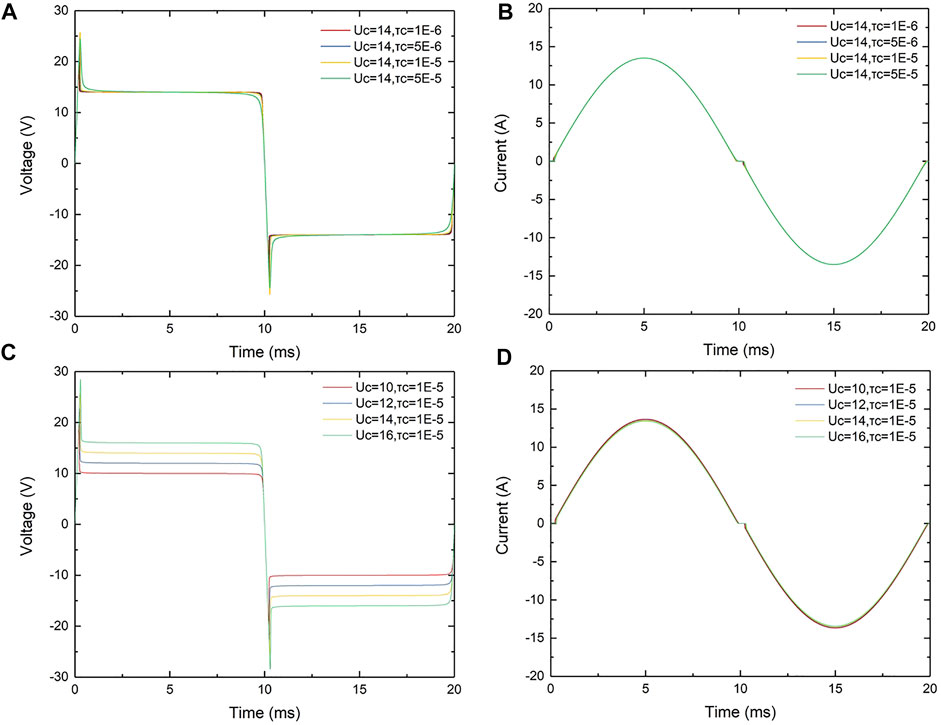
FIGURE 3. Effect of Cassie parameters. (A) Arc voltage of different τc, (B) arc current of different τc, (C) arc voltage of different Uc, and (D) arc current of different Uc.
Mayr model parameters:
Figure 2A,B show arc voltage and current waveforms of different time constants τm for the Mayr arc model (power dissipation P0 is set to 20 W). It can be seen from Figure 2A that with the decrease of time constant τm, the arc initiation time of the Mayr arc model decreases, the arc peak voltage increases obviously, and the steady arc burning time becomes longer. As shown in Figure 2B, with the decrease of time constant τm, the phenomenon of zero current rest becomes more obvious. But in the two time periods of 2.5–7.5 and 12.5–17.5 ms, i.e., the stable arc process, τm has little effect on the arc voltage.
Figure 2C,D show arc voltage and current waveforms of different power dissipation P0 (time constant τm is set to 2 × 10⁻⁴ s). With the increase of P0, the arc initiation time and the arc peak voltage increases obviously. Similar to τm, P0 has little effect on the arc voltage.
In conclusion, Mayr parameters have the most obvious influence on the arc initiation process, and have little influence on the stable arcing process.
Cassie model parameters:
Figure 3A,B show arc voltage and current waveforms of different time constants τc for the Cassie arc model (voltage constant Uc is set to 14 V). Unlike τm in the Mayr model, changing τc does not drastically change the arc peak voltage and arc initiation time. In addition, τc has no effect on stable arc voltage.
Figure 3C,D show arc voltage and current waveforms of different voltage constants Uc (time constant τc is set to 1 × 10⁻⁵ s). The effect of Uc on the steady arc combustion process is obvious. The arc voltage in the stable arc process is basically equal to Uc. In addition, Uc has little effect on arc initiation time.
Through the above analysis, the parameters of the Cassie and Mayr equations have a significant influence on arc voltage and current results. τm and P0 of the Mayr equation have a significant influence on arc initiation and extinguishing characteristics but have little influence on the stable arcing process. For the Cassie-Mayr hybrid model, Mayr parameters in the steady-state arcing process can be ignored. The parameter τc in the Cassie equation has little effect on steady-state arcing voltage, and the arc voltage in steady-state arcing process is basically equal to Uc. Considering that in the Cassie-Mayr model the Cassie equation is adopted in the case of high current (i.e., steady-state arcing process), τc can be set to a very small value, such as 1 × 10⁻⁶ s, to avoid τc affecting the calculation results of the Cassie equation.
3 Equation Parameters Determination Based on MHD Simulation
The Cassie-Mayr equation parameters τm, τc, Uc, and P0 are dependent on the arcing conditions (electrode material, electrode distance, arc quenching medium, etc.). Due to this fact, it is necessary to estimate the parameters. In this chapter, the free combustion arc between the copper electrode and electrode is established based on MHD theory, and the coefficients of the Cassie-Mayr model are determined by the results of the MHD model.
3.1 MHD Equations and Geometric Model
Arcing is a complex phenomenon involving the coupling of air flow and electromagnetic and thermal fields. In order to simplify the model, this paper makes the following assumptions:
1 The arc column of arc plasma is completely ionized and the arc column region satisfies the local thermodynamic equilibrium condition (LTE).
2 The free combustion arc is not affected by external air flow. Therefore, arc plasma is assumed to be in laminar flow. The turbulence effect is not considered.
3 The influence of gravity is not considered.
4 The material transformation and metallic vapor is not considered.
The MHD arc model can be described by Navier-Stokes and electromagnetic field equations, as shown below:
Navier-Stokes equation:
Where ρ is fluid density, t is time, V is fluid velocity, P is pressure, η is the viscosity coefficient, cP is specific heat capacity, T is temperature, k is thermal conductivity, J is current density, σ is electrical conductivity, and qR is radiant heat loss.
Energy conservation equation:
Where φ is potential.
The geometric model consists of two electrodes, as shown in Figure 4A. The fixed electrode is a cylindrical carbon rod; its diameter is 6 mm. The movable electrode is a cylindrical copper rod with a conical end; its diameter is also 6 mm. The arc is located between the two electrodes.
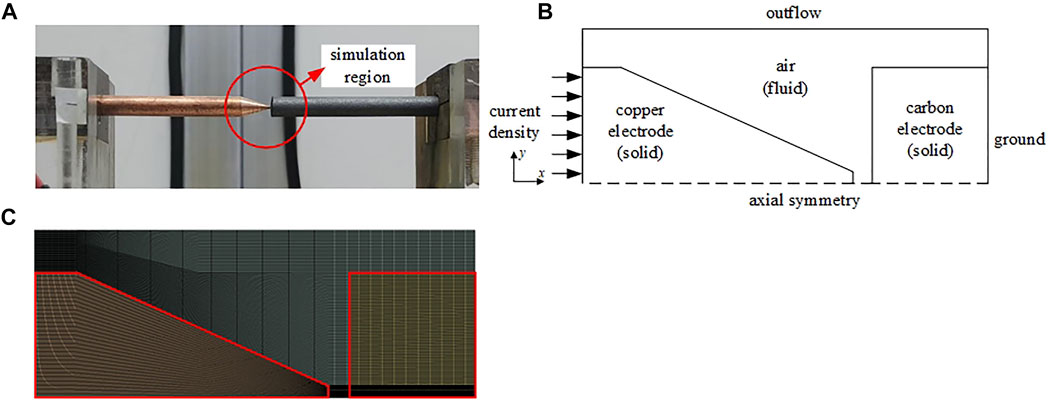
FIGURE 4. Arc plasma MHD model. (A) Geometric model, (B) simulation model boundary, and (C) mesh of MHD model.
The numerical model is established by the CFD software Fluent. Through the secondary development of Fluent by user-defined function (UDF), we add electromagnetic field equations in the process of the CFD solution. The boundaries of the CFD model are shown in Figure 4B. The computational region is divided into solid and fluid regions. The material of the solid regions is copper and carbon, respectively, and the material of the fluid region is air. The simulation object has an axisymmetric structure. In order to improve the computational efficiency, a two-dimensional axisymmetric CFD model is adopted, and the central axis (i.e., x axis) of the computational region is set as the centrosymmetric boundary. The copper rod is set as the cathode and the carbon rod is the anode. The current density boundary is set on the left side of the copper rod, and the zero potential boundary is set on the right side of the carbon rod. The remaining boundary faces are set as outflow boundaries to simulate atmospheric convection under natural conditions. The mesh of the CFD model is shown in Figure 4C the Mesh method includes quadrilaterals and the number of elements is 61,332. The solver is a pressure-based solver and algorithm is a standard SIMPLE algorithm.
3.2 Simulation Results
The calculation results are shown in Figure 5. Figure 5A,B show the arc temperature and current density at 0.2, 0.5, 1, and 1.5 mm electrode gaps, under a 10A current condition. In steady combustion, when the electrode gap is small (0.2 mm), the arc temperature distribution is elliptical. When the electrode gap is large (1.5 mm), the arc temperature presents a “bell-shaped” distribution with the expansion of the arc volume. At the same time, with the increase of electrode gap, the arc center temperature gradually decreases and the arc tends to cool down. It can be seen from Figure 5B that the current density of the arc is large in the region near the electrodes, while the current density decreases in the region far from the electrodes. The current density also decreases with the increase of electrode gap.
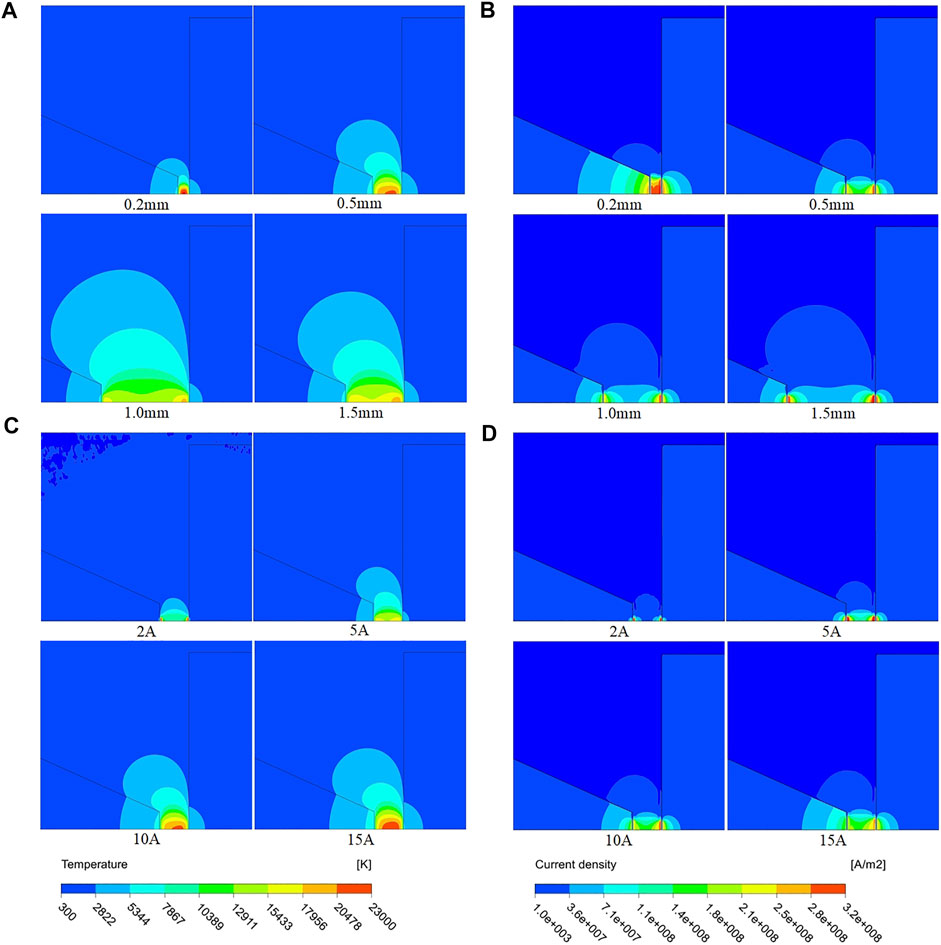
FIGURE 5. Arc temperature and current density under different lengths. (A) Arc temperature under different lengths, (B) arc current density under different length, (C) arc temperature under different currents, and (D) arc current density under different currents.
Figure 5C,D show the arc temperature and current density distribution with four current values of 2, 5, 10, and 15 A under the condition of an arc length of 0.5 mm. As can be seen from Figure 5C, with the increase of current, the overall temperature of the arc increases, and the area of the arc also increases, presenting an expansion trend. As shown in Figure 5D, when the current is small, the area of the arc current density is narrow, and with the increase of the current, the distribution area of the arc current density becomes large.
Figure 6A shows the arc voltage under different electrode gaps and different current conditions. As can be seen from the figure, with the increase of arc current at the same electrode gap, the arc voltage drop presents a downward trend. With the same current, the arc voltage increases with the increase of the electrode gap.
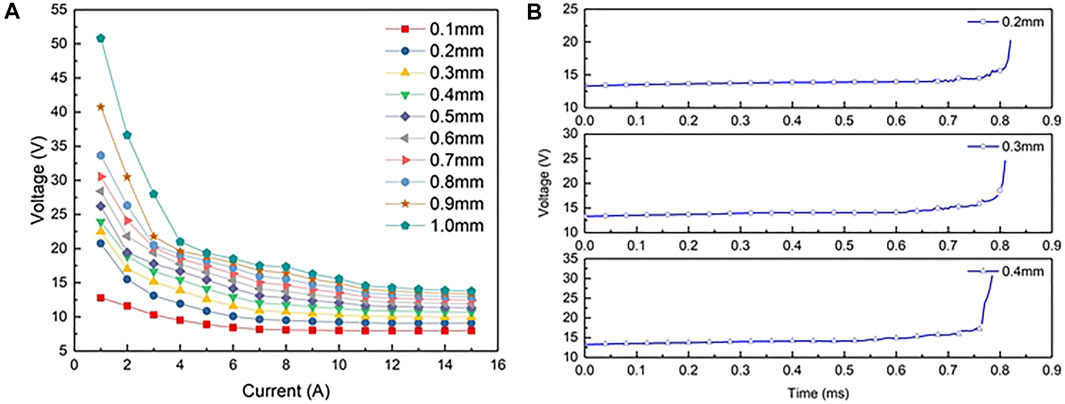
FIGURE 6. MHD simulation results. (A) Arc voltage under different electrode gaps and currents; (B) transient arc voltage under different spacing.
Figure 6B shows the voltage curve at the electrode gap of 0.2, 0.3, and 0.4 mm. When the current crosses zero, the arc voltage rises sharply. The larger the electrode gap (the longer the arc length), the larger the arc surface, the more intense the cooling and dissociation effect of the ambient low temperature air, the faster the voltage rise, and the higher the arc-extinguishing peak voltage.
3.3 Equation Parameters Determination by MHD Results
According to the analysis in Section 2, the Cassie-Mayr hybrid arc model has four undetermined parameters: Mayr time constant τm, Cassie time constant τc, arc voltage constant Uc, and arc power dissipation P0. The four undetermined parameters τm, τc, Uc, and P0 of the Cassie-Mayr hybrid arc model are determined by using the arc model based on magnetohydrodynamics described in Section 3.2.
Time constants τm and τc:
The Cassie-Mayr model uses the Cassie model at the moment of high current and the Mayr model at the moment of low current, that is, the Cassie model comes into play only when the arc goes into steady combustion. Therefore, the influence of Cassie time constant τc on the calculation results can be ignored. As analyzed in Section 2.2, τc is set to 1E-6 s to avoid the influence of τc on the calculation of a steady-state arcing process.
The Mayr arc time constant τm indicates the time required for the arc resistance to increase by e times after the arc current crosses zero, which reflects the thermal inertia of the arc resistance. In the definition of the Mayr arc model, the forms of energy released from the arc gap are heat conduction and radial diffusion. Based on heat transfer theory, the time constant τm of the Mayr arc model can be expressed as Eq. 9 (Islam et al., 2020).
Where σ is electrical conductivity, A is arc channel surface area, ρ is density, cP is specific heat capacity, k is thermal conductivity, T is temperature, and J is the current density. These parameters, σ, ρ, cP, and k, are functions of temperature, and they can be found in previous work (Murphy, 1995).
According to the calculation results of the MHD model in Section 3.2, the average temperature of arc plasma can be extracted, and the time constant τm of the Mayr arc model can be obtained. In this paper, the conversion current I0 is set as 1 A. Under the condition of 1 A current, the average temperature of arc plasma is 7022 K, σ is 413.42 S/m, A is 0.25 mm2, ρ is 0.608 kg/m³, cP is 6499.11 J/(kg·K), and k is 2.41 W/(m·K). The value of τm is 2.32 × 10⁻⁴ s.
Power dissipation P0:
The time series u(t) and i(t) of the voltage and current before the arc current crosses zero at different electrode gaps are calculated by the MHD arc model mentioned in Section 3.2, and then the arc conductance g(t) and the arc conductance derivative dg(t)/dt are deduced.
Equation 2 can be rewritten as Eq. 12.
Arc voltage constant Uc:
Cassie arc voltage constant Uc represents the voltage condition when the arc is burning steadily. According to the calculation results in Section 3.2 (Figure 6), the relationship between arc steady-state voltage and current and arc length Uc = f (i,l) can be determined.
Thus, Eqs 3, 4 can be further transformed into Eq. 13.
4 Experimental Verification and Analysis
4.1 Experimental Device
The experimental device is shown in Figure 7A. This arc-generating device can produce a series of low-voltage AC fault arcs caused by line fracture, wiring terminal loosening, opening of switching appliances, etc. The device consists of a DM432C stepping motor, a screw, a fixed electrode, and a movable electrode. The stepper motor drives the screw to make the movable electrode move in a straight line, and adjusts the distance between the two electrodes. The moving speed of the movable electrode can be adjusted from 0.00125 to 10 mm/s. The upper computer program-issued command controls the stepper motor and separates the movable electrode from the fixed electrode. The contact area of the two electrodes gradually decreases and the current density increases rapidly, and the arc generates between the electrodes. By controlling the appropriate distance of the electrodes, the device can produce a series of intermittent arcs.
The experimental circuit of the device is shown in Figure 7B. The arc-generating device is connected in series in the circuit. The power supply of the experimental circuit is a 220 V AC voltage source. Different types of loads can be switched by the relays, such as KMA, KMB, etc.
4.2 Comparison of Simulated and Measured Results
Measured and calculated waveforms are presented in Figures 8, 9. Figure 8 presents the waveforms of 22 Ω resistive load. Figure 9 presents the waveforms of dimmer load. The conduction angle of the dimmer is 60°. The two figures compare the experimental waveforms with the results of the Cassie-Mayr model modified by MHD, Mayr model, and Cassie model.
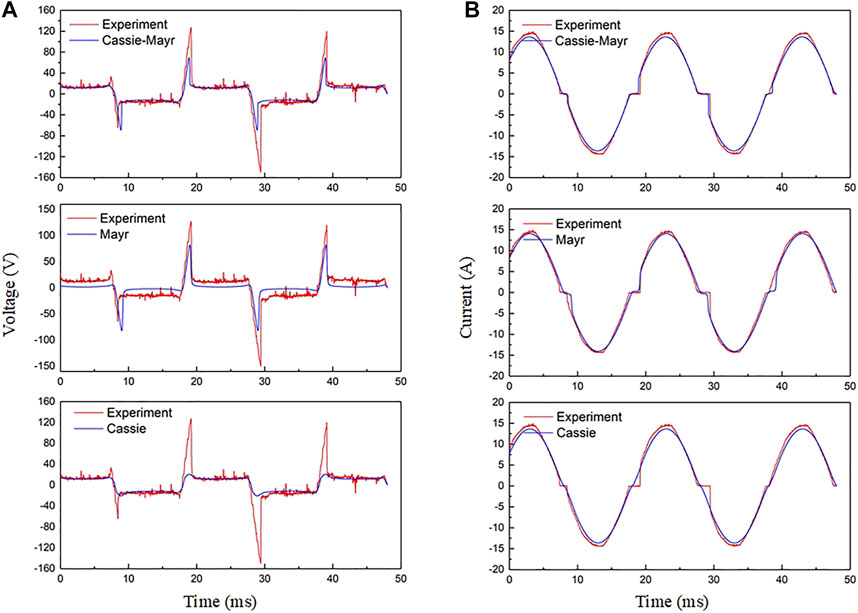
FIGURE 8. Comparison between experiment, Cassie-Mayr, Cassie, and Mayr results of a 22 Ω resistive load. (A) Arc voltage; (B) arc current.
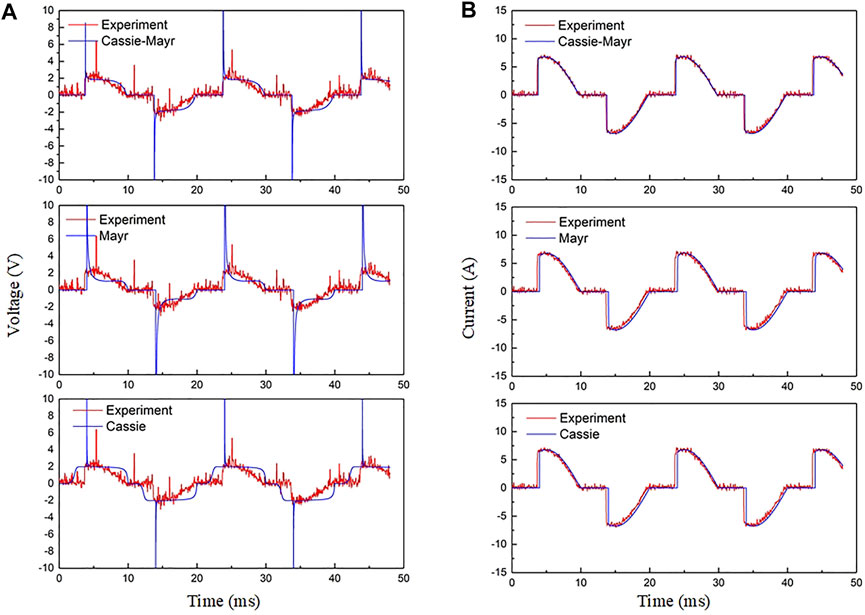
FIGURE 9. Comparison between experiment, Cassie-Mayr, Cassie, and Mayr results of dimmer load. (A) Arc voltage; (B) arc current.
The parameters of the modified Cassie-Mayr model are τm = 2.32 × 10⁻⁴ s, τc = 1 × 10⁻⁶ s, P0 = 29.31 W, and Uc is determined by the data in Figure 6A. While, the parameters of the Mayr model are set to the same levels as the Cassie-Mayr model. τc in the Cassie model is set as 2.41 × 10⁻⁴ s to avoid a too short arc initiation time in the Cassie model calculation. Uc in the Cassie model is set to the same level as that in the Cassie-Mayr model.
As Figure 8 shows, the voltage and current waveforms of the Cassie-Mayr model modified by MHD have a good correlation with the experimental waveforms. The main errors occur in the arc extinguishing and arc initiation processes. The simulated voltage peak is slightly lower than the experimental waveform. The reasons for the errors are 1. there are errors in controlling the distance between the two electrodes in the experimental process. 2. There are some errors in calculating the arc extinguishing process. The calculation of the arc extinguishing process needs further revision. However, the arc voltage waveform of the Mayr model is different from the experimental result. As in the Cassie-Mayr model, the arc extinguishing voltage of the Mayr model is consistent with the trend of experimental results. But the voltage in the steady-state arcing process is much lower than the experimental result. The arc current waveform of the Mayr model is consistent with the experimental waveform. Contrary to Mayr, the voltage waveform of the Cassie model is consistent with the experimental result in the steady-state arcing process. And the voltage peaks of the Cassie model are not obvious. In addition, the “flat shoulder” phenomenon (i.e., the “zero rest” of arc current phenomenon) is present.
In Figure 9, for the dimmer load, the arc voltage and arc current waveforms of the Cassie-Mayr model modified by MHD are consistent with the experimental results. However, the arc voltage curve of the Mayr model is still lower than the experimental result in the steady-state arcing process. While, in the Cassie model, the time of the steady-state arcing process is obviously longer than that in reality.
It can be concluded that, compared with the Mayr model and Cassie model, the Cassie-Mayr model modified by MHD proposed in this paper can more accurately reflect the characteristics of an AC fault arc.
In a previous paper (King-Jet Tseng et al., 1997), the voltage and current of the arc steady-state igniting process were extracted by an experimental method. A variable DC power supply was used to get the voltage and current data. The DC supply voltage was gradually reduced while recording the arc voltage and current until the arc was extinguished. After that, the relationship between the voltage and current of the arc was obtained by a fitting method. On this basis, the Cassie-Mayr model was established.
According to the experimental conditions [section VI in (King-Jet Tseng et al., 1997)], the Cassie-Mayr model modified by MHD was used to re-establish the models to calculate the arc parameters, and the comparison was made with the literature (the experiment of the literature was extracted by GetData, a graphic digitization software). Figure 10A,B show the voltage and current comparison between the experiment and simulation, respectively. The upper graph compares the data obtained by the Cassie-Mayr model modified by MHD with the experiment, and the lower graph compares the data obtained by the simulation in (King-Jet Tseng et al., 1997) with the experiment. As Figure 10A shows, the simulation data of this paper and the previous study have the same trend with experimental data. In terms of details, the voltage data of this paper are relatively flat at the arc igniting state. However, in the literature, there is a bulge at the arc igniting state. The current curve of this paper is more consistent with the experimental data.
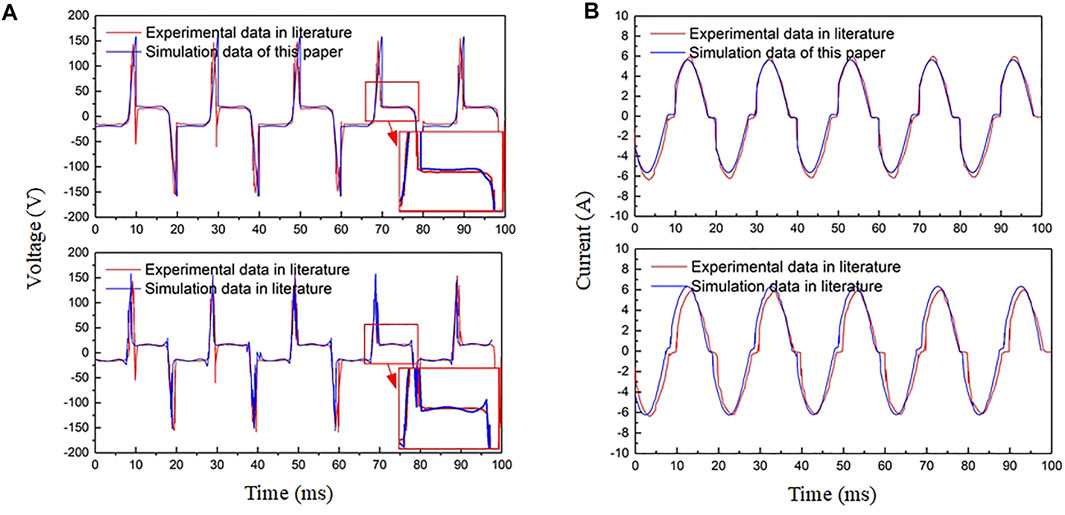
FIGURE 10. Comparison between the method of this paper and a previous study (King-Jet Tseng et al., 1997). (A) Arc voltage; (B) arc current.
Limited by experimental conditions, the experiment can only obtain data under partial conditions. As Figure 8 in the previous report (King-Jet Tseng et al., 1997) shows, the voltage and current data of the arc steady-state igniting process obtained by experiments are limited. Besides, the fitting method will also introduce errors in the simulation. The MHD simulation can simulate the arc igniting process in most cases without the limitation of the experiment, therefore, determining the parameters of the Cassie-Mayr model by MHD simulation can overcome the limitations of the experimental method.
4.3 Analysis
Resistive loads, resistive capacitive loads, and resistive inductive loads are common load types in low-voltage distribution networks. Common resistive loads include kettle loads, and common resistive inductive loads include motor and refrigerator loads, etc. A nonlinear load is also a common type of load in a distribution network. In this section, the arc characteristics of resistive load, resistive inductive load, resistive capacitive load, and nonlinear load, represented by dimmer, are simulated and analyzed.
4.3.1 Resistive Load
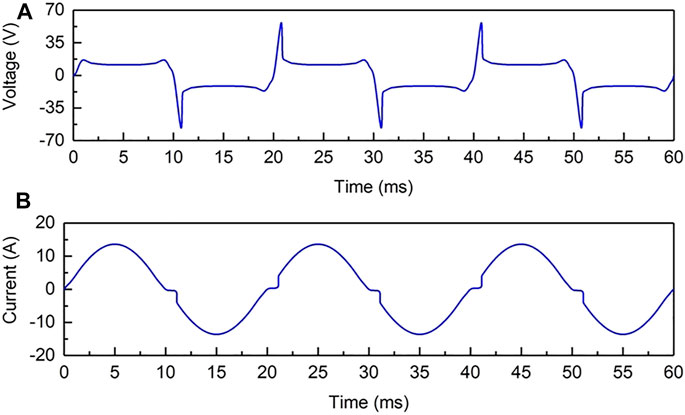
Arc voltage u and current i of resistive load are shown in Figure 11. As the current crosses zero, due to the cooling of the air medium, the arc conductance is almost zero, and the voltage of the arc is equal to the voltage of power. As the arc voltage rises from zero, the current is essentially zero. When the electrode gap breaks down and generates a new arc, the current rises sharply and the voltage reaches the peak, that is, the arc burning peak. Then the voltage drops to steady arc combustion voltage.
4.3.2 Resistive Inductive Load
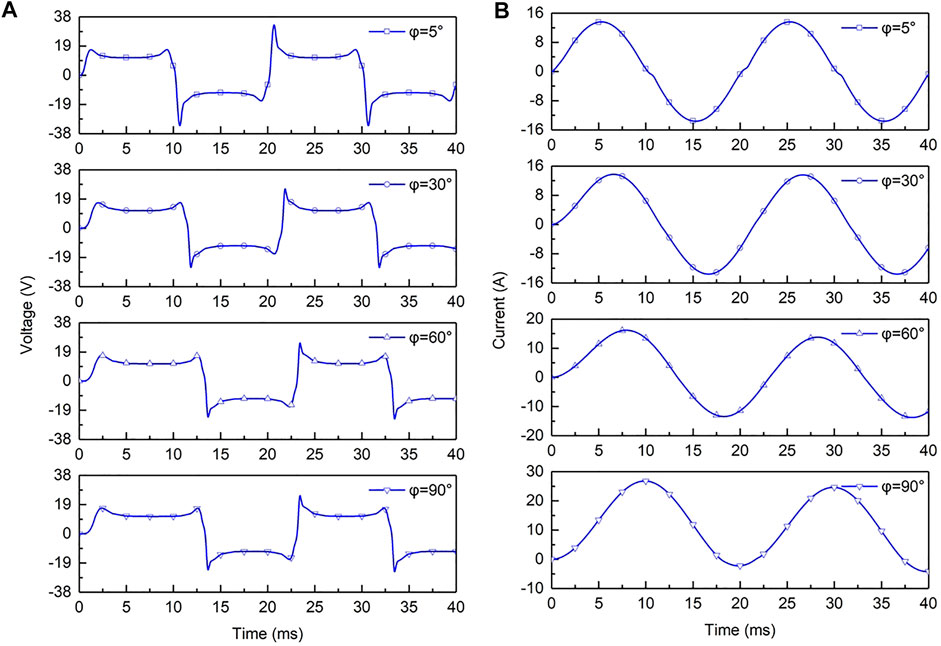
Figure 12A,B respectively show the arc voltage u and current i of resistor-inductance load, and the power factor angles of loads are 5°, 30°, 60°, and 90°. When a fault occurs, due to the transient current component in the circuit loop, the current is not a standard sinusoidal waveform, which leads to the different arc burning time of each half cycle, and the larger the power factor, the more serious the situation. In addition, the voltage peak of the resistor-inductance arc is obviously lower than that of resistive load, and the zero current rest time is shorter than that of resistive load. When the power factor is large, the current does not have the “current zero off” phenomenon. The resistive inductive load arc is more difficult to extinguish than the resistive arc.
4.3.3 Resistive Capacitive Load
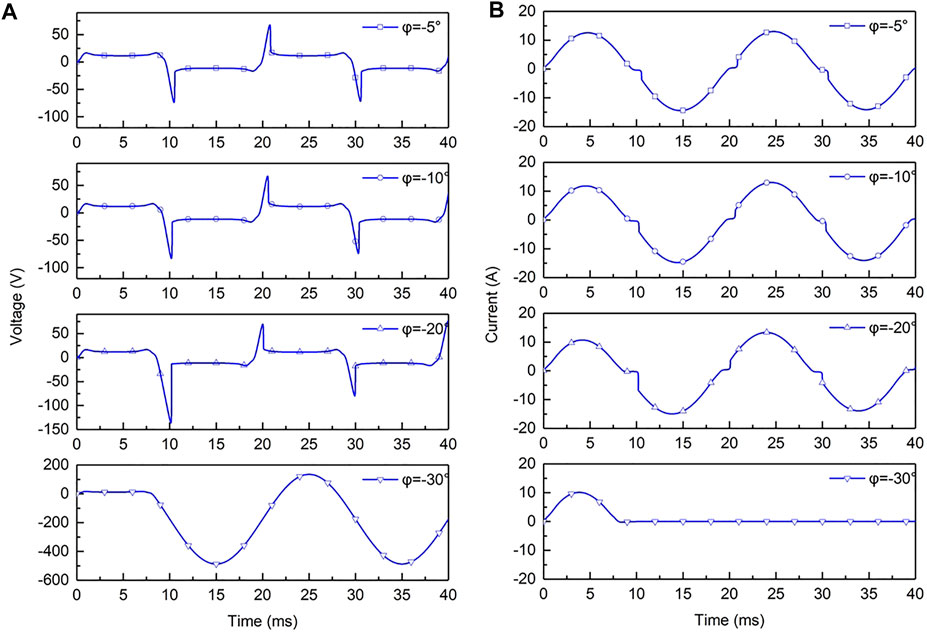
Figure 13A,B show arc voltage u and current i of resistive capacitive load. The power factor angles are −5°, −10°, −20°, and −30°. With the increase of power factor angle, the “flat shoulder” phenomenon of the current becomes more obvious, the current zero rest time increases obviously, and the voltage peak increases obviously. When the power factor angle reaches −30°, the arc cannot be maintained. Compared with resistive load and resistive inductive load, the arc of resistive capacitive load is more likely to be extinguished. It can be seen that the capacitor has a restraining effect on the arc combustion, and the larger the capacitor value in the resistive and capacitive load, the more difficult it is to maintain the arc.
4.3.4 Dimmer Load
Figure 14A,B are the normal work voltage u and current i of the dimmer load at conduction angles of 60°, 90°, 120°, and 150°. Figure 14C,D are the arc voltage u and current i of the dimmer load at conduction angles of 60°, 90°, 120°, and 150°. Dimmer is a kind of nonlinear load that can be tested by controlling the conduction angle of parallel thyristors to adjust the brightness of light. It can be seen from the figure that with the increase of the conduction angle, the arc burning time shortens, the arc combustion peak increases, and the “flat shoulder” phenomenon of the current is even more obvious. When the conduction angle reaches 150°, the arc cannot be reignited. By comparing the fault arc waveforms of the dimmer load with the normal waveforms, it can be found that there is no significant difference between the fault arc current (Figure 14D) and the normal current (Figure 14B) at the conduction angles of 60°, 90°, and 120°. While, the voltage of the fault arc (Figure 14C) is obviously distorted. When the conduction angle is 150°, the current waveform of the fault arc is obviously different from the normal waveform, because the arc does not reignite and the circuit is broken. The normal waveform works normally when the thyristors are turned on.
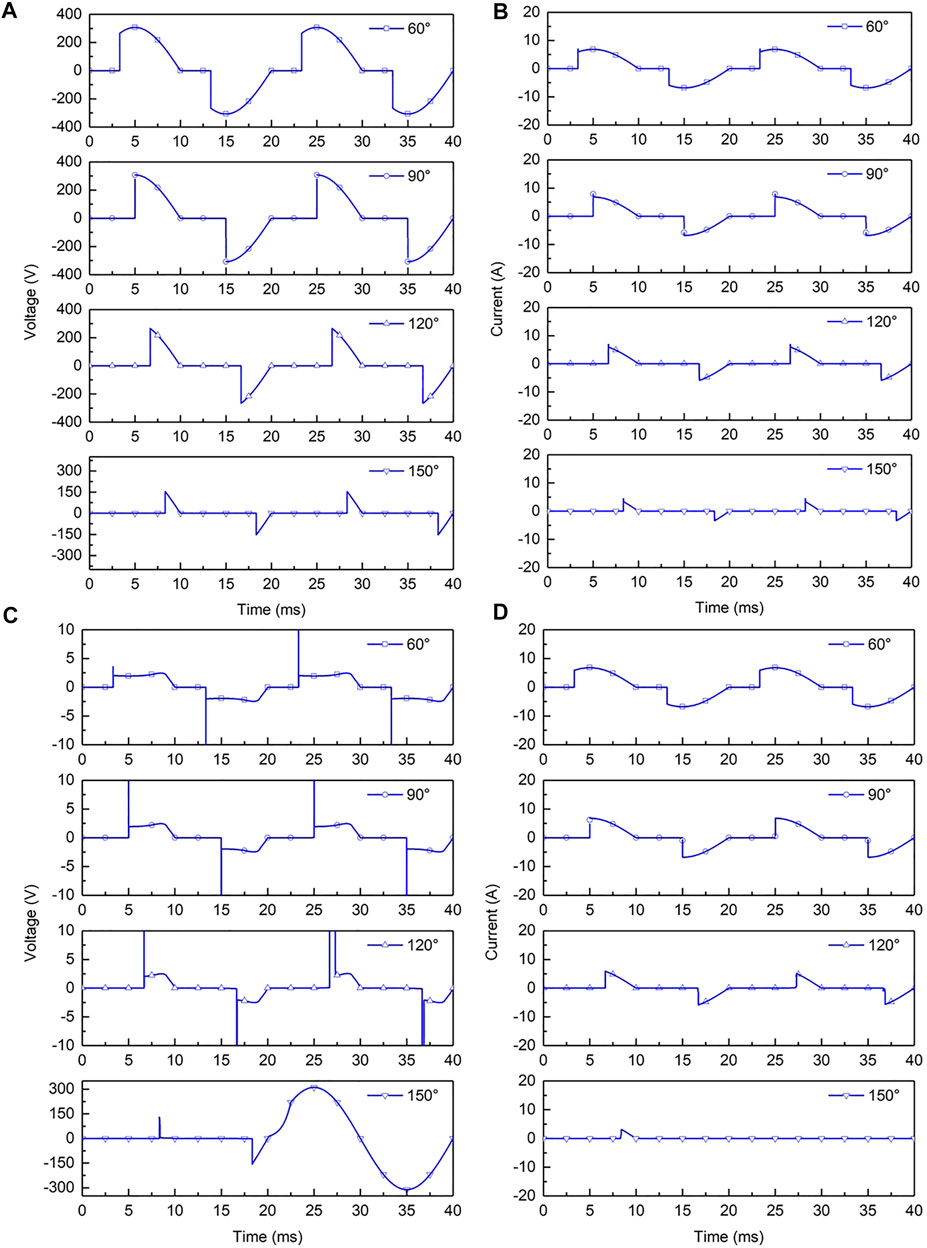
FIGURE 14. Dimmer load (A) normal work voltage, (B) normal work current, (C) arc fault voltage, and (D) arc fault current.
5 Conclusion
In this paper, the Cassie-Mayr hybrid arc model modified by MHD theory is proposed. The circuit simulation model of the Cassie-Mayr model and the multi-physics field model of the MHD arc plasma model are established by Simulink and Fluent, respectively. The undetermined parameters of Cassie-Mayr, τm, τc, Uc, and P0, are determined by the simulation results of the MHD model. Experiments of resistive load and dimmer load were designed to verify the accuracy of the modified Cassie-Mayr model. The experimental results indicate that the modified Cassie-Mayr can simulate the AC fault arc characteristics with reasonable accuracy. In addition, the arc waveforms of resistive loads, resistive capacitive loads, resistive inductive loads, and dimmer loads are simulated by the modified model. The arc characteristics, such as zero-rest characteristics of the arc current and arc maintenance ability, under these loads, are studied.
Data Availability Statement
The raw data supporting the conclusions of this article will be made available by the authors, without undue reservation.
Author Contributions
FY provided overall guidance and supervision for this research work. ZT assisted in conceptualization, writing, review, and editing. YS, LS, and ZY assisted in review and editing.
Funding
This project was supported by the State Grid Hubei Electric Power Company (52153220001V), University Industry University Cooperation Project of Fujian Provincial Department of Science and Technology (No. 2021Y4002), and Fujian Science and Technology Innovation Leading Talent Project (No. 038000387024).
Conflict of Interest
The authors declare that the research was conducted in the absence of any commercial or financial relationships that could be construed as a potential conflict of interest.
Publisher’s Note
All claims expressed in this article are solely those of the authors and do not necessarily represent those of their affiliated organizations, or those of the publisher, the editors and the reviewers. Any product that may be evaluated in this article, or claim that may be made by its manufacturer, is not guaranteed or endorsed by the publisher.
References
Bo, K., Zhou, X., and Zhai, G. (2018). Simulation of Arc Dwelling Behavior during Bridge-type Contacts Opening Process for High-Power Relay. IEEE Trans. Compon., Packag. Manufact. Technol. 8 (6), 975–981. doi:10.1109/TCPMT.2018.2825375
Campbell, R. B., and Dini, D. A. (2016). Occupational Injuries from Electrical Shock and Arc Flash Events. Springer New York1.
Chittora, P., Singh, A., and Singh, M. (2015|). Modeling and Analysis of Power Quality Problems in Electric Arc Furnace,” in Annual IEEE India Conference (INDICON). New Delhi: IEEE, 1–6. doi:10.1109/INDICON.2015.7443638
Guardado, J. L., Maximov, S. G., Melgoza, E., Naredo, J. L., and Moreno, P. (2005). An Improved Arc Model before Current Zero Based on the Combined Mayr and Cassie Arc Models. IEEE Trans. Power Deliv. 20 (1), 138–142. doi:10.1109/TPWRD.2004.837814
Islam, A., Birtwhistle, D., and Saha, T. K. (2020). Simulation of the thermal Current Interruption Process of Air-Break Interrupters for Future Mv Application. Electric Power Syst. Res. 182, 106264. doi:10.1016/j.epsr.2020.106264
Ju, M., and Wang, L. (2016). Arc Fault Modeling and Simulation in DC System Based on Habedank Model,” in Prognostics and System Health Management Conference (PHM-Chengdu). Chengdu: IEEE, 1–4. doi:10.1109/PHM.2016.7819827
King-Jet Tseng, K-J., Vilathgamuwa, Y. D. M., and Mahinda Vilathgamuwa, D. (1997). An Experimentally Verified Hybrid Cassie-Mayr Electric Arc Model for Power Electronics Simulations. IEEE Trans. Power Electron. 12 (3), 429–436. doi:10.1109/63.575670
Liu, X., Huang, X., and Cao, Q. (2021). Simulation and Experimental Analysis of DC Arc Characteristics in Different Gas Conditions. IEEE Trans. Plasma Sci. 49 (3), 1062–1071. doi:10.1109/TPS.2021.3054657
Miller, D., and Hildenbrand, J. (1973). DC Arc Model Including Circuit Constraints. IEEE Trans. Power Apparatus Syst. PAS-92 (6), 1926–1934. PAS-. doi:10.1109/TPAS.1973.293572
Murphy, A. B. (1995). Transport Coefficients of Air, Argon-Air, Nitrogen-Air, and Oxygen-Air Plasmas. Plasma Chem. Plasma Process. 15 (2), 279–307. doi:10.1007/BF01459700
Nottingham, W. B. (1923). A New Equation for the Static Characteristic of the Normal Electric Arc. J. Am. Inst. Electr. Eng. 42 (1), 12–19. doi:10.1109/JoAIEE.1923.6591851
Rondot, L., Chadebec, O., and Meunier, G. (2014). 3-D Magnetostatic Moment Method Dedicated to Arc Interruption Process Modeling. IEEE Trans. Magn. 50 (2), 941–944. doi:10.1109/TMAG.2013.2282989
Rong, M., Yang, F., Wu, Y., Murphy, A. B., Wang, W., and Guo, J. (2010). Simulation of Arc Characteristics in Miniature Circuit Breaker. IEEE Trans. Plasma Sci. 38 (9), 2306–2311. doi:10.1109/TPS.2010.2050703
Schavemaker, P. H., and Sluis, L. (2002). “The Arc Model Blockset,” in Second Iasted International Conference Power & Energy Systems (Crete), 644–648.
Schavemaker, P. H., and van der Slui, L. (2000). An Improved Mayr-type Arc Model Based on Current-Zero Measurements [circuit Breakers]. IEEE Trans. Power Deliv. 15 (2), 580–584. doi:10.1109/61.852988
Stokes, A. D., and Oppenlander, W. T. (1991). Electric Arcs in Open Air. J. Phys. D: Appl. Phys. 24 (1), 26–35. doi:10.1088/0022-3727/24/1/006
Ullah, A., Lie, T. T., Gunawardane, K., and Nair, N. K. C. (2016). Development of Browne's Arc Model for HTS Application,” in 2016 IEEE International Conference on Power System Technology (POWERCON). Wollongong. IEEE, 1–4. doi:10.1109/POWERCON.2016.7753971
Walter, M., and Franck, C. (2014). Improved Method for Direct Black-Box Arc Parameter Determination and Model Validation. IEEE Trans. Power Deliv. 29 (2), 580–588. doi:10.1109/TPWRD.2013.2283278
Wang, Y., Liu, Z., Mu, X., Huang, K., Wang, H., and Gao, S. (2016). An Extended Habedank's Equation-Based EMTP Model of Pantograph Arcing Considering Pantograph-Catenary Interactions and Train Speeds. IEEE Trans. Power Deliv. 31 (3), 1186–1194. doi:10.1109/TPWRD.2015.2500260
Wu, Y., Rong, M., Li, X., Murphy, A. B., Wang, X., Yang, Y., et al. (2008). Numerical Analysis of the Effect of the Chamber Width and Outlet Area on the Motion of an Air Arc Plasma. IEEE Trans. Plasma Sci. 36 (5), 2831–2837. doi:10.1109/TPS.2008.2004040
Wu, Y., Rong, M., Yang, F., Ma, R., Murphy, A. B., Liu, Z., et al. (2011). Numerical Study of Arc Behavior in Miniature Circuit Breaker. IEEE Trans. Plasma Sci. 39 (11), 2858–2859. doi:10.1109/TPS.2011.2159275
Yu, R., Fu, Z., Wang, Q., Sun, S., Chen, H., Xu, Q., et al. (2011). “Modeling and Simulation Analysis of Single Phase Arc Grounding Fault Based on MATLAB,” in Proceedings of 2011 International Conference on Electronic & Mechanical Engineering and Information Technology (Harbin. IEEE), 4607–4610. doi:10.1109/EMEIT.2011.6024001
Keywords: plasma, Cassie-Mayr, magnetohydrodynamics, AC arc model, simulink
Citation: Yang F, Tang Z, Shen Y, Su L and Yang Z (2022) Parameter Determination Method of Cassie-Mayr Hybrid Arc Model Based on Magnetohydrodynamics Plasma Theory. Front. Energy Res. 10:808289. doi: 10.3389/fenrg.2022.808289
Received: 03 November 2021; Accepted: 22 February 2022;
Published: 08 April 2022.
Edited by:
Quanwen Pan, Zhejiang University City College, ChinaReviewed by:
Kenneth E. Okedu, National University of Science and Technology, OmanYuchen Luo, Amazon, United States
Copyright © 2022 Yang, Tang, Shen, Su and Yang. This is an open-access article distributed under the terms of the Creative Commons Attribution License (CC BY). The use, distribution or reproduction in other forums is permitted, provided the original author(s) and the copyright owner(s) are credited and that the original publication in this journal is cited, in accordance with accepted academic practice. No use, distribution or reproduction is permitted which does not comply with these terms.
*Correspondence: Zhaohui Tang, MzUzNDUzNzk4QHFxLmNvbQ==
 Fan Yang1
 Zhaohui Tang
