Abstract
Biochar derived from pyrolysis or gasification has been gaining significant attention in the recent years due to its potential wide applications for the development of negative emissions technologies. A new concept was developed for biochar and power co-generation system using a combination of biomass pyrolysis (BP) unit, solid oxide fuel cells (SOFCs), and a combined heat and power (CHP) system. A set of detailed experimental data of pyrolysis product yields was established in Aspen Plus to model the BP process. The impacts of various operating parameters including current density (), fuel utilization factor (), pyrolysis gas reforming temperature (), and biochar split ratio () on the SOFC and overall system performances in terms of energy and exergy analyses were evaluated. The simulation results indicated that increasing the , , and can favorably improve the performances of the BP-SOFC-CHP system. As a whole, the overall electrical, energy and exergy efficiencies of the BP-SOFC-CHP system were in the range of 8–14%, 76–78%, and 71–74%, respectively. From the viewpoint of energy balance, burning the reformed pyrolysis gas can supply enough energy demand for the process to achieve a stand-alone BP-SOFC-CHP plant. In case of a stand-alone system, the overall electrical, energy and exergy efficiencies were 5.4, 63.9 and 57.8%, respectively, with a biochar yield of 31.6%.
1 Introduction
Negative emissions technologies (NETs) have been gaining attention in the recent years, as it can be helpful in reducing CO2 emissions from power plants and industrial sectors to the atmosphere and mitigating climate change. Bioenergy with carbon capture and storage (CCS) technology currently plays a significant role in achieving a negative balance of carbon in the atmosphere (Fuss and Johnsson, 2021). In general, bioenergy conversion technologies can be simply classified into physical, thermal, chemical and biological methods (Ayodele et al., 2019). Among them, the thermal conversion technology such as torrefaction, pyrolysis, gasification of biomass has been widely considered for the purpose of producing syngas, heat, and power (Din and Zainal, 2016; Dechapanya et al., 2020). In addition to the utilization of biomass for energy and electricity production, the by-product biochar has gained considerable attention and is found suitable for various applications as illustrated in Figure 1.
FIGURE 1

A schematic illustration of various applications of biochar.
Typically, biochar is produced from a slow pyrolysis process of biomass, which is generally heated in an inert atmosphere maintained below 500°C with a slow heating rate (<10°C min−1) (Yaashikaa et al., 2019; Uroic Štefanko and Leszczynska, 2020). This solid product (biochar) is characterized by its high stability, high porosity, high carbon content, high surface area, and high adsorption properties (Lee et al., 2017; Yaashikaa et al., 2019). Besides its potential application in the environmental and agricultural fields such as carbon sequestration, wastewater treatment process, and soil amendment, biochar can also be utilized as a catalyst for tar reforming during the biomass pyrolysis and gasification processes as well as in biorefineries (Lee et al., 2017; Yaashikaa et al., 2019; Uroic Štefanko and Leszczynska, 2020).
Another prospective and attractive approach to generate eco-friendly and efficient energy is to apply solid oxide fuel cells (SOFCs) technology to the NETs (Thattai et al., 2017). In contrast to the conventional coal-fired power plants or integrated coal gasification combined cycle (IGCC) systems, an integration of various chemical processes or hybrid energy systems with SOFCs for clean electricity production plays a vital role in the energy market and is now attracting significant attention, as it has a number of advantages (Aravind et al., 2009; Liu et al., 2011; Din and Zainal, 2016; Thattai et al., 2017): 1) SOFCs are low-emission, flexible, and modular devices; 2) high fuel flexibility: hydrogen, syngas, biogas, ammonia, etc.; 3) the high operating temperature of SOFCs makes the integration of high temperature chemical systems such as biomass gasification (BG), calcium looping technology, and chemical looping combustion viable; 4) system efficiencies as high as 50–60% or more if combined with gas turbines (GT) using exhaust heat from SOFC; and 5) a wide variety of applications ranging from combined heat and power (CHP) systems to larger power plants. On account of these advantages, the combination of different energy systems with SOFCs is highly promising as an energy-efficient and environment friendly process for decentralized power generation and co-generation.
Reviewing recent works concerning the applications of SOFC technology, there are numerous studies in the literature on the process integration of BG and SOFC system. For instance, Aravind et al. (2009) evaluated the performance of small-scale gasifier-SOFC-GT systems (100 kW) through thermodynamic calculations in terms of energy and exergy efficiencies using Cycle Tempo. They pointed out that an overall electrical efficiency of 54% was achieved. Liu et al. (2011) investigated an integrated biosyngas fueled gasifier-SOFC-CHP system (5 kW) and found that the CHP energy and exergy efficiencies were in the range of 57–66% and 23.9–28.1%, respectively. Baldinelli et al. (2016) conducted the coupling of a pilot downdraft gasifier with a commercial SOFC system and concluded that wood syngas was feasible for SOFCs since no carbon deposition was found on the NiYSZ-anode cell. Thattai et al. (2017) compared the performance of an integrated gasification fuel cell (IGFC) system with full oxy-fuel CO2 capture with a co-gasification of biomass and coal power plant without CO2 capture, and concluded that the energy and exergy efficiencies of the former were 10.8 and 9.8%, respectively, better than those of the latter. In addition, the IGFC system offers a very low specific CO2 emission as compared to the traditional co-gasification power plant. Detchusananard et al. (2019) simulated the integration of the sorption enhanced steam biomass gasification (SEG) with SOFC and a CHP system and they highlighted that a maximum exergy efficiency of 61.2% can be achieved.
In contrast to the BG-SOFC system, a number of studies have been carried out on integrated SOFC with other chemical process in a hybrid system. A literature summary of various energy systems integrated with an SOFC is presented in Table 1. For example, Ozcan and Dincer (2014) studied a chemical looping hydrogen production connected with a SOFC-GT system for trigeneration of power, heat, and hydrogen, and they indicated that the overall energy and exergy efficiencies of such a system were 56.9 and 45.1%, respectively. Chiodo et al. (2015) adopted the Aspen Plus simulator to investigate the feasibility of integrating a biogas reformer with an SOFC. They reported that their proposed system offers high SOFC efficiency (DC) up to 61.76% based on biogas steam reforming at an operating temperature of 800°C. Mehrpooya et al. (2020) designed a biodiesel production power plant integrated with a glycerol steam reforming process and an SOFC using Aspen Hysys. They concluded that the overall electrical and thermal efficiencies were 28.1 and 85.2% respectively. Mojaver et al. (2020a) investigated the optimum operating conditions of SOFCs via various optimization approaches (Taguchi/AHP/TOPSIS) to maximize the electrical efficiency. Meanwhile, they also evaluated an SOFC-supercritical CO2 Brayton- organic Rankine cycle-based power plant and pointed out that the electrical exergy efficiency was 43% after carrying out multi-objective optimization (Mojaver et al., 2020b). These earlier studies prove that SOFC technology is promising in applications to power plants and several industrial processes.
TABLE 1
| Proposed energy systems with SOFCs | System efficiency | Literature |
|---|---|---|
| IGCC-SOFC- oxy-fuel combustion CO2 capture system | 47.96%a,d | Thattai et al. (2017) |
| 43.68%b | ||
| Biomass gasification-SOFC system | 20.5–47.5%b | Liu et al. (2011) |
| 23.9–51.6%b (CHP) | ||
| Calciner (calcination process) integrated with a SOFC system | 43.7–47.7%a,d | Hanak et al. (2017) |
| Supercritical water gasification (SCWG)-SOFC system | 50–70a,b,d | Recalde et al. (2019) |
| Sorption Enhanced steam biomass gasification with a SOFC-GT system | 61.2%b | Detchusananard et al. (2019) |
| Chemical looping hydrogen generation integrated with a SOFC-GT system | 56.9%a,c | Ozcan and Dincer, (2014) |
| 45.05%b | ||
| Biogas reforming process integrated with a SOFC system | 37–62%a,d (SOFC DC) | Chiodo et al. (2015) |
| Biodiesel production followed by glycerol reforming integrated with a SOFC power plant | 85.16%a,d | Mehrpooya et al. (2020) |
| 25.09%a,d (SOFC) | ||
| Chemical looping combustion in natural gas power plants integrated with SOFCs | 63–70%a,d | Spallina et al. (2018) |
| SOFC-GT-supercritical organic Rankine cycle integrated power system | 66.27%a,d | Zhang et al. (2017) |
| 88.43%a,d (CHP) |
State-of-art of the researches on various energy systems integrated with SOFCs.
Energy efficiency.
Exergy efficiency.
HHV, basis.
LHV, basis.
Based on the foregoing review of the literature, it shows that integrated BG-SOFC systems have been investigated extensively both in experiments and simulations, and few examined the use of integrating SOFCs with biogas reforming or chemical looping processes. However, an examination of the recent studies reveal that no research has been done to evaluate an integrated system incorporating biomass pyrolysis (BP) with a SOFC-CHP system for the NETs. Such sort of integrated system seems to be sustainable in nature and hence appropriate for energy and environment focused applications. For the aforementioned reasons, the present study aims to develop a BP-SOFC-CHP system for co-generation of biochar and power using Aspen Plus simulator, and then to examine the influence of operating parameters such as current density and fuel utilization factor () on the SOFC and overall system (BP-SOFC-CHP) performances in terms of energy () and exergy () efficiencies as well as biochar production. The BP is developed and established based on experimental data (Chen et al., 2016; Manyà et al., 2018) and a pyrolysis volatiles reforming unit is simultaneously considered and installed behind the BP to investigate the effect of reforming temperature () and biochar split ratio () on the overall system performance in detail. Finally, a stand-alone design for the BP-SOFC-CHP system is proposed, which can provide new and useful insight into the development of NETs.
2 Process design and simulation
2.1 System description
In this study, a simulation model of the co-generation of biochar and power plant is developed in Aspen Plus V8.8. In the simulation, the Peng-Robinson Boston Mathias (PR-BM) equation of state is used as the thermodynamic property (Chiodo et al., 2015). Figure 2 shows the entire process flow diagram for the co-generation of biochar and power system. The overall system is mainly composed of a biomass pyrolysis (BP) reactor, a pyrolysis volatiles reformer, a solid oxide fuel cell (SOFC) system, a combined heat and power (CHP) system, and three steam turbine systems. The key sub-systems in the BP-SOFC-CHP system, such as the BP process, the pyrolysis volatiles reforming, and the SOFC are presented in detail below. On the other hand, the detailed operating conditions of all sub-systems are presented in Table 2.
FIGURE 2
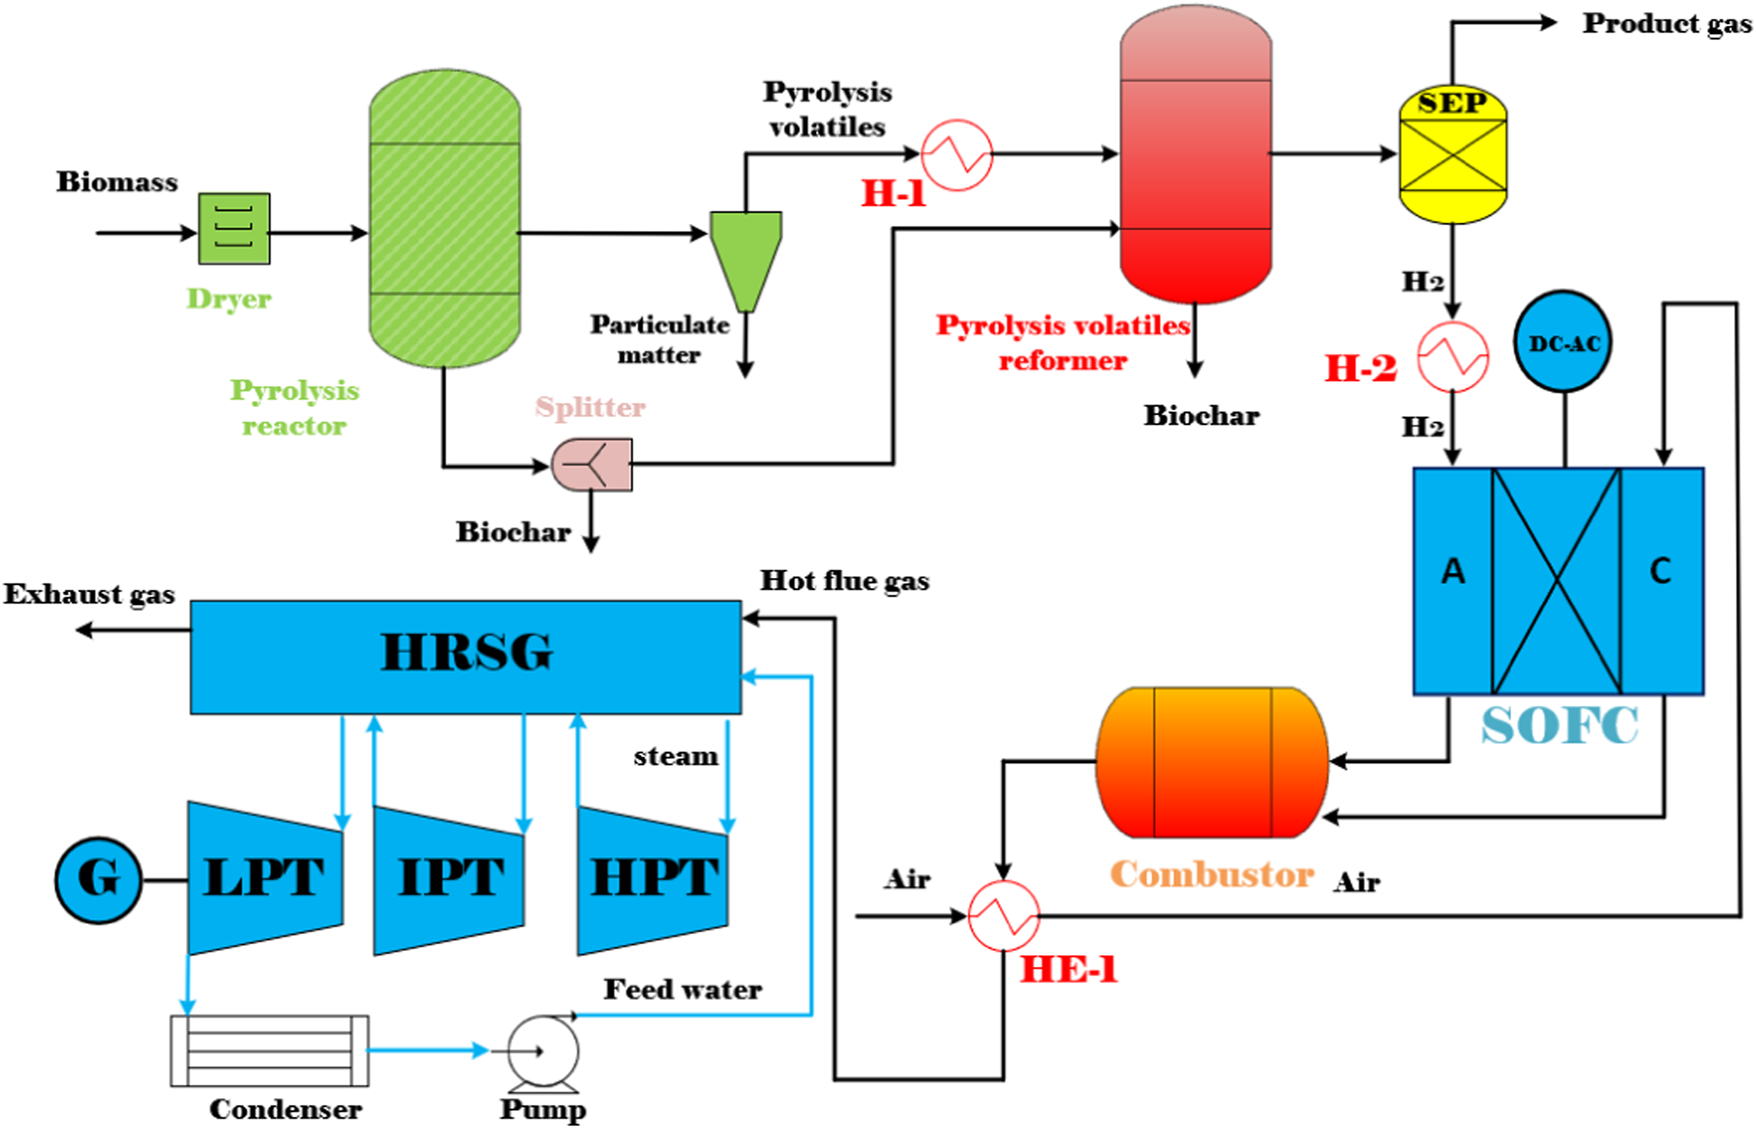
Process flow diagram of the BP-SOFC-CHP system.
TABLE 2
| Process sub-systems | Parameters | Value | Literature |
|---|---|---|---|
| Pyrolysis | Temperature (°C) | 500 | Manyà et al. (2018) |
| Pressure (MPa) | 0.55 | ||
| Biomass inlet flow rate (kg s−1) | 0.53–2.11 | ||
| Volatiles yield (wt%) | 30.6 | ||
| Liquid yield (wt%) | 37.9 | ||
| ` | Biochar yield | 31.5 | |
| Pyrolysis volatiles reforming | Temperature (°C) | 600–850 | Xu et al. (2015) |
| Pressure (atm) | 1 | ||
| SOFC | Temperature (°C) | 900 | - |
| Pressure (atm) | 1 | ||
| Fuel utilization factor () | 0.6–0.9 | ||
| Current density (A/m2) | 1,000–4,000 | ||
| DC/AC converter efficiency (%) | 0.95 | ||
| Active area (m2) | 1,000 | ||
| HRSG and steam turbine cycle | HPT pressure (atm) | 80 | - |
| IPT pressure (atm) | 30 | ||
| LPT pressure (atm) | 5 | ||
| Isentropic efficiency (%) | 92 | ||
| Mechanical and generator efficiency (%) | 98 | ||
| Approach point and pinch point (°C) | 10 |
Operating conditions used in the simulation.
2.2 Biomass pyrolysis and pyrolysis volatiles reforming processes
In the biomass pyrolysis process (BP), slow pyrolysis of corn stover is considered for the purpose of producing biochar. The chemical and physical properties of corn stover are listed in Table 3. Moreover, the model is established according to the following key assumptions in the development of the BP-SOFC-CHP system: 1) the process is carried out in steady state; 2) the feedstock is at normal conditions (i.e., 25°C and 1 atm); 3) the solid and gaseous phases are in a state of thermodynamic equilibrium; 4) char is assumed as graphitic carbon. Based on the chemical and physical properties of corn stover, the biomass fuels and ash are established and defined as non-conventional components in Aspen Plus. The HCOALGEN model is chosen to estimate the heat of combustion, heat of formation, and heat capacity of biomass fuels. The DCOALIGT model is selected to calculate the density of biomass fuels. When corn stover is fed into the BP-CHP-SOFC system, the first step is the heating and drying to reduce its moisture content. The resulting dried corn stover is then fed to the pyrolysis reactor in which the slow pyrolysis is performed at 500°C and 0.55 MPa. The RYield reactor is used to model the product yields of pyrolysis volatiles, pyrolysis liquid, and biochar based on the experimental system used by Chen et al. (2016) and Manyà et al. (2018). Based on their studies, experimental data such as the product yields and compositions are available, and this can be taken as valid inputs for developing the model in Aspen Plus. The yields of the major products are thus calculated based on the experimental results by a calculator block which is controlled by the FORTRAN statement in accordance with the component characteristics of the feedstock. The main product yields from corn stover slow pyrolysis are presented in Table 2. During corn stover slow pyrolysis at 500°C, approximately 30.6% of the pyrolysis volatiles are released from the feed, while the pyrolysis liquid (including water and organic compounds) and biochar yields are 37.9 and 31.5% respectively. The main components of pyrolysis liquid from corn stover slow pyrolysis are established based on the experimental results of Chen et al. (2016). In terms of GC/MS analysis, furfural accounted for most of the yields of products in the organic phase, followed by, oxiranemethanol acetate, D-allose, Furfuryl alcohol, Phenol, Metacetamol, Butyrolactone, 4-Methoxy-1,2-benzenediol and other components. The pyrolysis gas coming out of the reactor is heated and sent to the volatiles reformer to produce hydrogen-rich gas, while the biochar is taken out from the bottom of the pyrolysis reactor. For the base case system, the biochar split ratio is assigned as zero and hence the entire biochar produced is taken out from the reactor at regular intervals. In contrast to the base case, a splitter unit is used to control the biochar spilt ratio. According to this ratio, a part of the produced biochar will be conveyed to the pyrolysis volatiles reformer to produce more hydrogen. The pyrolysis volatiles reforming is simulated by using an RGibbs reactor which models the major chemical reactions based on the chemical and phase equilibrium calculations by minimizing the Gibbs free energy. The Gibbs free energy minimization equilibrium model (RGibbs) has been widely considered a suitable approach to predict thermodynamic behavior of the gas-char reforming process (AlNouss et al., 2020; Rosha et al., 2022). Six different reforming temperatures of 600, 650, 700, 750, 800, and 850°C are taken into account to find the suitable operating condition for the BP-SOFC-CHP system, and the major chemical reactions occurring in the reformer are summarized in Table 4. Meanwhile, to identify the maximum thermodynamic efficiencies of the system, for simplicity, an ideal separator unit is installed after the reformer to separate hydrogen from the reformed gas, and this hydrogen is heated and fed to the SOFC system.
TABLE 3
| Biomass | Corn stover |
|---|---|
| Proximate analysis (wt%, dry basis) | |
| Volatile matter | 86.60 |
| Fixed carbon | 10.7 |
| Ash | 2.7 |
| Elemental analysis (wt%, dry ash free) | |
| C | 44.4 |
| H | 5.6 |
| N | 0.43 |
| O (by difference) | 49.12 |
| S | 0.45 |
| Lower heating value (MJ kg−1) | 16.74 |
Proximate and elemental analyses of the biomass used in the simulation (Manyà et al., 2018).
TABLE 4
| Reaction name | Chemical reaction | Reaction number |
|---|---|---|
| Reforming of pyrolysis volatiles | R1 | |
| Dry reforming | R2 | |
| R3 | ||
| Steam reforming | R4 | |
| R5 | ||
| R6 | ||
| R7 | ||
| R8 | ||
| Water gas shift reaction | R9 | |
| Carbon formation | R10 | |
| R11 | ||
| R12 | ||
| R13 | ||
| R14 | ||
| Carbon gasification | R15 | |
| Boudouard reaction | R16 | |
| Hydrogasification | R17 |
A list of main chemical reactions occurring during the pyrolysis volatiles reforming unit (Liu et al., 2013; Xu et al., 2015; Arregi et al., 2017).
2.3 Solid oxide fuel cell system
The SOFC model is also established in the Aspen Plus environment. The detailed process flowsheet and the relevant input parameters (geometry, material properties, etc.) are modeled based on the study of Doherty et al. (2010). The following key assumptions are considered in the present SOFC model (Doherty et al., 2010; Taufiq et al., 2015): 1) the entire system is steady-state and zero-dimensional; 2) any pressure drop in the system is neglected; 3) chemical reactions reach the thermodynamic equilibrium at a given reaction temperature; 4) the half-cell reactions are replaced by the overall oxidation of hydrogen, since the process of ions crossing over through the electrolyte cannot be simulated in Aspen Plus. An RGibss reactor based on Gibbs free energy minimization is utilized to model the chemical reactions occurring at the anode, while a separator is used to model oxygen required by the electrochemical reactions (Doherty et al., 2010). To calculate the required amount of oxygen () to react with hydrogen at the anode, a design specification block is performed in the cathode unit by implementing the following equations in Aspen Plus.where is the fuel utilization factor, is the molar flow rate of hydrogen reacted at the anode (mol h−1), is the equivalent hydrogen (mol h−1), is the cell current (A), is the air utilization factor, is the molar flow rate of oxygen reacted at the cathode (mol h−1), and is the molar flow rate of oxygen fed into the cathode (mol h−1). In actual case, an equivalent amount of ambient air can be fed to the cathode, as pure O2 is not an economically feasible option.
The Nernst potential, and the operational cell voltage considering the losses due to ohmic, activation, and concentration polarizations are calculated based on Doherty et al. (2010). After the cell voltage () is obtained, the SOFC power output is calculated as:where is the cell current (A), is the cell voltage (V), and is the inverter efficiency (%).
The anode outlet gas of SOFC subsequently enters into the combustor where the oxidation of unreacted hydrogen takes place to release heat. An RStoic reactor which is a stoichiometry-based reactor with specified extents of reaction is utilized to model the combustion reaction. Next, the hot exhaust gas from the combustor flows through a heat exchanger (HE-1) in order to preheat the cathode air and then is sent to a combined heat and power system (CHP), including a heat recovery steam generator (HRSG) and a number of steam turbine (ST) cycles to generate additional electricity.
2.3.1 Validation of the solid oxide fuel cell
The validation of the SOFC model is performed by comparing the current predictions to the results of Doherty et al. (2010). In their work, a syngas composition characteristic of 34% H2, 16% CO, 7.4% CH4, 15.8% CO2, 25.7% H2O, and 1.1% N2, produced after gas cleaning from the Güssing DFB gasifier with an operating temperature of 850°C and a steam/fuel ratio of 0.75 (Doherty et al., 2010), is used as an inlet fuel of the SOFC for generating a DC power of 120 kW. The operating temperature, pressure, and active area of the SOFC were 910°C, 1.09 bar, and 96.1 m2, respectively. The fuel utilization and air utilization factors were fixed at 0.85, and 0.167, respectively. As shown in Table 5, the simulation results are in good agreement with the data presented in the literature. Therefore, it is concluded that the SOFC model used in the present study is reliable.
TABLE 5
| Gas composition | Anode outlet | Referencesa | Cathode outlet | Referencesa |
|---|---|---|---|---|
| (mol%) | Present model | Present model | ||
| H2 | 6.26% | 6.2% | 0% | 0% |
| CO | 4.15% | 4.2% | 0% | 0% |
| CO2 | 30.0% | 30.0% | 0% | 0% |
| CH4 | 0% | 0% | 0% | 0% |
| N2 | 0.95% | 0.9% | 81.86% | 81.9% |
| H2O | 58.64% | 58.7% | 18.14% | 18.1% |
| SOFC performance | Voltage (mV) | Referencesa | Current density (mA/m2) | Referencesa |
| Present model | Present model | |||
| 663.7 | 662 | 188.2 | 188.7 |
A comparison of simulation results for SOFC model.
The results were validated against Doherty et al. (2010).
3 Thermodynamic analysis
In order to investigate the effect of various operating parameters such as and on the SOFC performance and overall BP-SOFC-CHP system performance, various important efficiency indexes are taken into account to evaluate and are defined in detail below.
3.1 Energy efficiency ()
The SOFC energy efficiency () can be calculated as follows:where is the thermal input of hydrogen (MW) and is the SOFC power output (MW).
With regard to the overall efficiency of BP-SOFC-CHP system, it can be determined by using the following equations. Basically, the main energy content of the products which can be recovered from the BP-SOFC-CHP system are product gas, biochar and sensible heat. The gross power output from the BP-SOFC-CHP system equals to the sum of electric power of the SOFC and CHP. The energy content of the product gas can be expressed by its lower heating value (LHV, MJ kg−1) (Emun et al., 2010):where x stands for the mass fraction of gas species in the product gas, and , , are the lower heating value of the gas species, H2, CO, and CH4 in the product gas (MJ kg−1), respectively.
On the other hand, the energy content of biochar is calculated based on the LHV of biochar (27 MJ kg−1) (Rafiq et al., 2016). Hence, the system energy efficiency for main products () is defined as the ratio of energy output of the BP-SOFC-CHP system to the energy input, whereas the overall electrical energy efficiency () is the ratio of net power generation to energy input. They are defined as follows:where , are the thermal output of product gas and biochar from the BP-SOFC-CHP system (MW), respectively. is the gross power output of SOFC () (MW) and steam turbines () (MW), is the sum of auxiliary power (MW).
3.2 Exergy efficiency ()
The overall exergy balance between the inlet and outlet flows can be expressed as (Saidur et al., 2012; Zhang et al., 2012; Ozcan and Dincer, 2014):where and are the exergy rates of the input and output streams, respectively. is the input exergy rate of biomass (MW), is the exergy rate of heat transfer (MW), is the output exergy rate of the product gas (MW), is the exergy rate of biochar (MW), is the exergy rate of work (MW), and is the exergy destruction rate (MW).
Basically, the total exergy of the material streams includes physical exergy and chemical exergy, which can be written as follows:where is the total exergy of the material streams (MW), and and are the physical and chemical exergy of the material streams (MW), respectively.
In the foregoing equation, the for each species in the product gas can be defined bywhere and are the specific enthalpy (kJ kmol−1) and entropy (kJ kmol−1 K−1) of the gas species at a given state, while and are the specific enthalpy and entropy of the gas species at the environment state = 25°C and = 1 atm, respectively.
The for each species in the gas mixture can be described as follows:where is the mole flow rate of species in the product gas (kmol s−1), is the standard chemical exergy of species in the product gas, and R is the universal gas constant (kJ kmol−1 K−1).
Meanwhile, the standard chemical exergy of species in the product gas and carbon can be obtained from the studies of Zhang et al. (2012), Saidur et al. (2012), and Ozcan and Dincer (2014). The exergy of heat streams is expressed as follows:where is the operating temperature for the system (K), and is the heat transfer flow rate of the system (MW).
For biomass, the specific chemical exergy can be obtained by (Cohce et al., 2010):where is the mass flow rate of biomass fed into the BP-SOFC-CHP system (kg s−1), is the lower heating value of the biomass (MJ kg−1), and , , , are the mass fraction of carbon, hydrogen, oxygen, and nitrogen respectively.
As a consequence, the SOFC exergy efficiency () can be defined as follows:where represents the exergy rate of hydrogen (MW) and is the SOFC power output (MW).
Meanwhile, from the aforementioned equations, the exergy efficiency of the products (), which is defined as the ratio of exergy output of products to the total exergy input and electrical exergy efficiency (), which is the ratio of net power generation to exergy input, in the BP-SOFC-CHP system are defined by (Saidur et al., 2012; Zhang et al., 2012):
4 Results and discussion
In the following discussion, a base case of the performance of overall BP-SOFC-CHP system in terms of energy () and exergy () analyses is first studied. Sensitivity analysis with respect to four main operating parameters, including current density, fuel utilization factor (), reforming temperatures (), and biochar split ratio () on the BP-SOFC-CHP system performance are then examined. The effort is targeted to find the optimal operating conditions of this new system for co-generation of biochar and electricity. Finally, in order to cover the heat demand of the overall process, a stand-alone BP-SOFC-CHP system is further evaluated.
4.1 A base case study of the biomass pyrolysis-solid oxide fuel cell-combined heat and power system
The energy and exergy flow diagrams of the BP-SOFC-CHP system for the base case are shown in Figures 3A,B, respectively. In this base case, the pyrolysis volatiles reforming temperature () is kept constant at 650°C. The total mass flow rate of biomass fed into the system is determined based on the required current density of SOFC. At a current density of 2500 A m−2 and a fuel utilization factor () of 0.85, it is calculated that 1.32 kg s−1 of biomass is to be fed into the BP-SOFC-CHP system. Under the prescribed operating conditions, the result for biochar production rate from the BP-SOFC-CHP system is about 0.46 kg s−1.
FIGURE 3
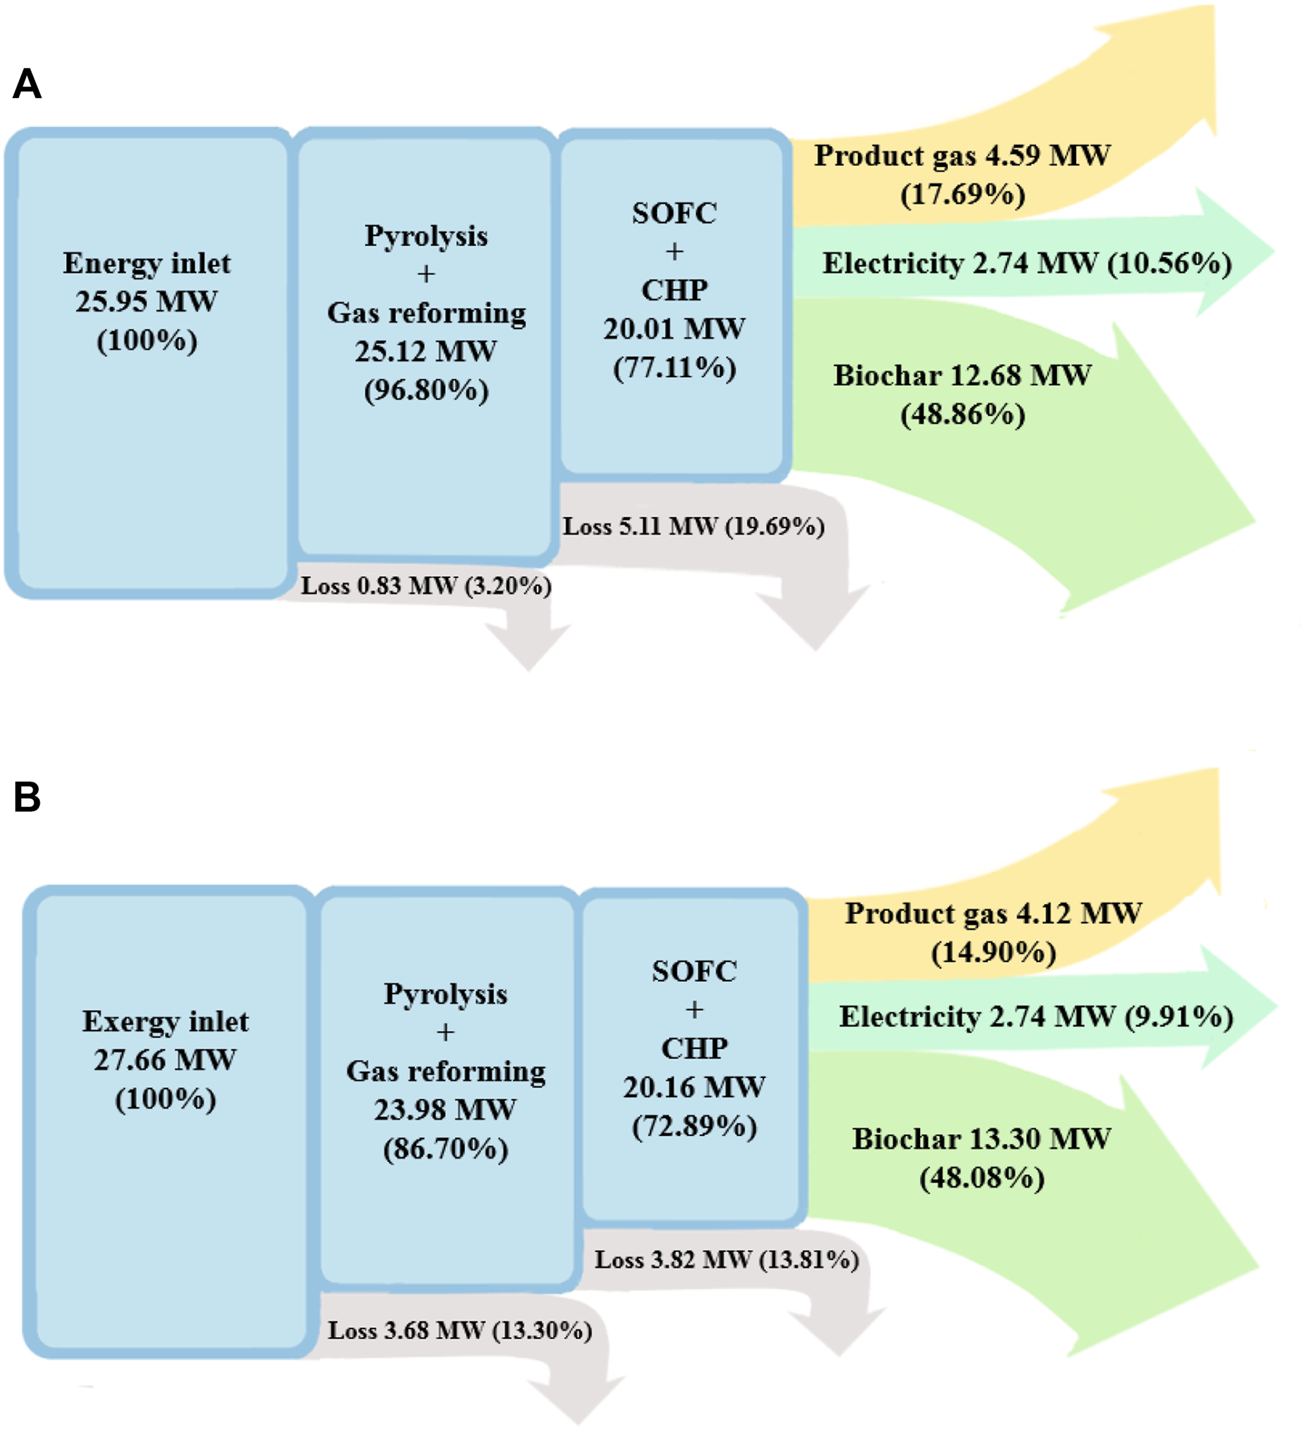
Sankey diagram of the BP-SOFC-CHP system: (A) energy, and (B) exergy.
The inlet energy flow, which is the sum of the chemical energy content of the biomass fuel, heat of reaction, and energy requirement of the process, to the BP-SOFC-CHP system is 25.95 MW and most of the useful energy output of products are obtained from biochar and pyrolysis gas, which are 12.68 and 4.59 MW respectively, corresponding to 48.9 and 17.7% of the energy input (i.e., = 66.6%). On the other hand, it is noteworthy that the energy required to heat the biomass to the operating temperature of pyrolysis (i.e., 500°C) and for biomass pyrolysis reaction are around 0.98 MJ kg−1 and 1.01 MJ kg−1 respectively. Similar results have been reported in Yang et al. (2013) and Weldekidan et al. (2019), where they estimated the heat required for biomass pyrolysis by using TGA-DSC experiment. Their results concluded that the energy demand for heating the rice husk and chicken litter to the pyrolysis temperature of 500°C were 0.8 MJ kg−1 and 1.2 MJ kg−1 respectively, while the heat energy consumed for pyrolysis process of five different biomass samples was in the range of 1.1–1.6 MJ kg−1 at pyrolysis temperature between 500 and 550°C. Accordingly, it is clear that the simulated results are consistent with those measured from the experimental works and the present model is good enough to carry out an energy balance of the BP-SOFC-CHP system. The net power generation, which is the sum of SOFC and the CHP system, is 2.74 MW. Therefore, 10.6% () of the energy input is converted to net electricity for the BP-SOFC-CHP system. From the above data, the overall energy efficiency ( of the BP-SOFC-CHP system for the base case is 77.1%. With regard to the exergy flow diagram of the BP-SOFC-CHP system for the base case (Figure 3B), the inlet exergy flow to the overall system is about 27.66 MW. The exergy efficiency of pyrolysis gas and biochar is 14.9 and 48.1% respectively, accounting for of 63.0%, while an electrical exergy efficiency () of about 9.9% is achieved. The highest exergy destruction and loss take place at the SOFC and CHP system, followed by the BP unit, contributing around 13.8 and 13.3% of the total exergy input respectively. Consequently, the overall exergy efficiency () of the BP-SOFC-CHP system for the base case is 72.9%.
4.2 Sensitivity analysis
In order to develop a better understanding of a novel BP-SOFC-CHP system two important SOFC operating parameters, current density () and fuel utilization factor (), that influence the overall system energy, exergy, and electrical efficiencies are first investigated. Subsequently, particular emphasis is placed on studying the impacts of the reforming temperature () and biochar split ratio () on the overall BP-SOFC-CHP system’s performance to find the optimal operating conditions.
4.2.1 Effect of current density ()
Sensitivity analysis of the effect of current density on the BP-SOFC-CHP system is shown in Figure 4, where and are kept constant at 0.85 and 650 °C respectively, throughout the sensitivity analysis. As can be seen, when increasing the current density from 1,000 to 4000 A m−2, SOFC power output increases from 0.79 to 2.70 MW, but cell voltage drops from 0.83 to 0.71 V (Figure 4A). This is attributed to the fact that SOFC operation at higher current density results in higher voltage losses caused by the ohmic, activation, and concentration polarizations that are directly proportional to current density (Doherty et al., 2010). As shown in Figures 4A,B significant decreasing trend of and are observed with increasing current density. The decrease of and is mainly because the increased the amount of fuel input flow and the decreased cell voltage as current density rises. The values of and are in the range of 45.8–53.5% and 44.5–52.0%, respectively. On the other hand, the total input power and total power output (SOFC and CHP) increase linearly along with the current density (Figure 4C). The former is in the range of 10.36–41.54 MW, while the latter is 1.16–4.06 MW. It can be thus seen that the electrical efficiency is reduced from 11.2 to 9.8% for and 10.5 to 9.2% for respectively, when the current density is raised from 1,000 to 4000 A m−2 (Figure 4C). Figure 4D shows the distributions of , and biochar production rate of the BP-SOFC-CHP system along with the current density. The values of the and drop as the current density increases. Overall, the values of and of the BP-SOFC-CHP system vary in the range of 76.4–77.8% and 72.2–73.5%, respectively. On examining the distributions of biochar production rate (Figure 4D), it is seen that biochar production ranges from 0.18 to 0.73 kg s−1 within the investigated ranges of current density.
FIGURE 4
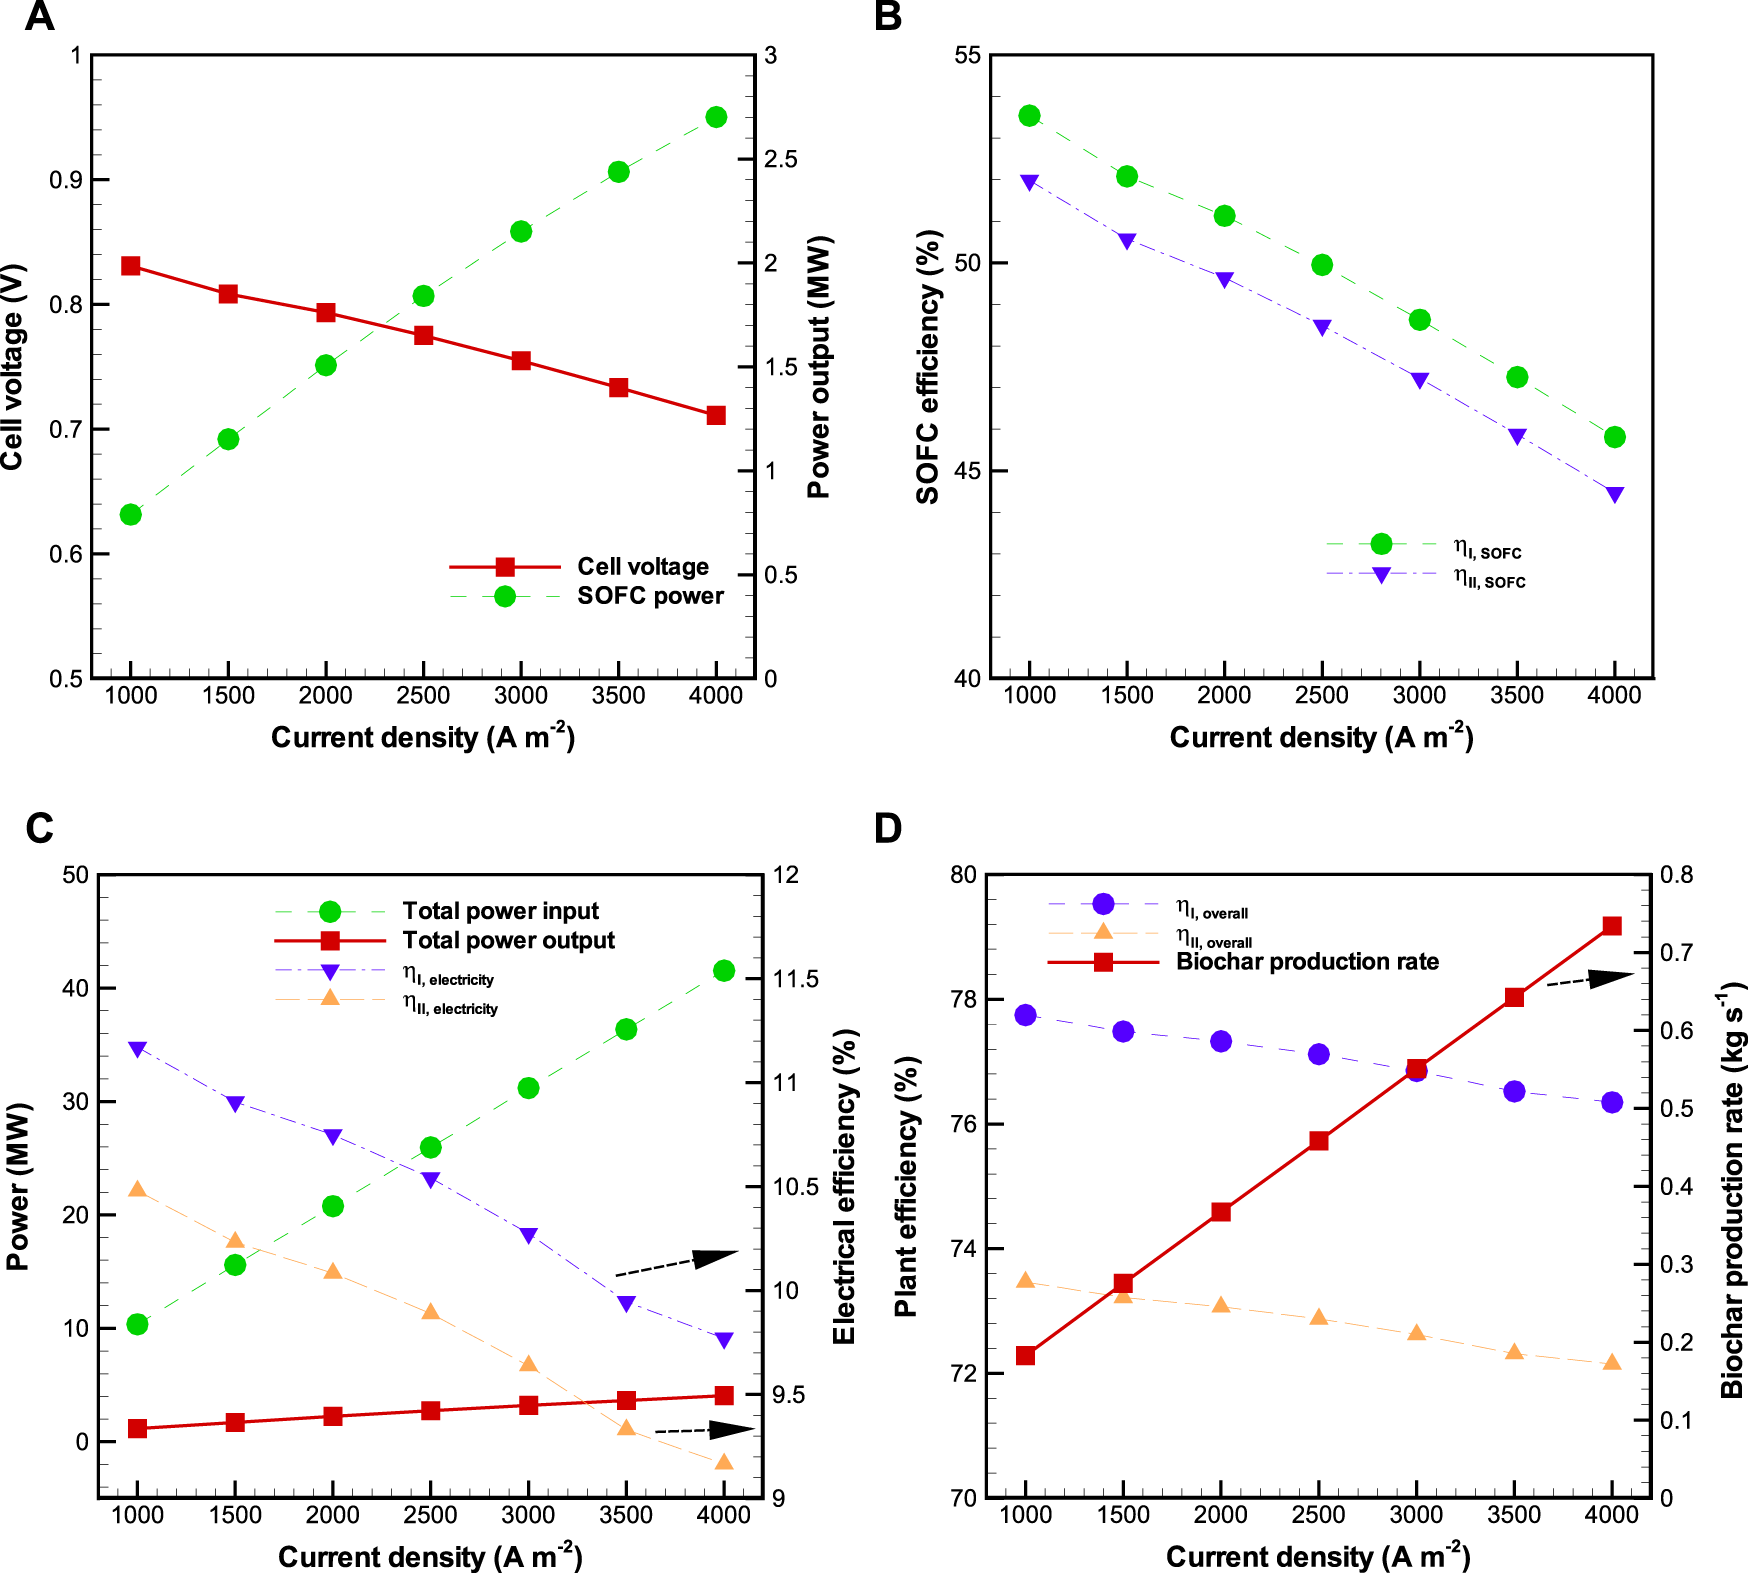
Effects of current density () on the BP-SOFC-CHP system: (A) SOFC cell voltage and power output, (B) SOFC efficiency, (C) total power input and output and electrical efficiency, and (D) overall system efficiency and biochar production rate.
4.2.2 Effect of fuel utilization factor ()
The second sensitivity analysis is carried out by varying the utilization factor (). is one of the most significant operating parameters for SOFC and has impacts on the performance of the entire system. During the sensitivity analysis, a constant SOFC power output (AC) of 2 MW is assumed to be generated (i.e., biomass input flow rate, cell voltage, and current density are calculated to achieve 2 MW). Figure 5 illustrates the influence of on the performance of BP-SOFC-CHP system, where is kept constant (650°C) in all cases. It can be observed that the current density is increased from about 2586 A m−2 to 2801 A m−2 with an increase of from 0.6 to 0.9, resulting in a decrease in the cell voltage from 0.81 to 0.75 V. This is attributed to the fact that more consumption of H2 by the SOFC at higher values of is observed, and thus higher polarizations losses are caused with higher current density (Figure 5A). Raising from 0.6 to 0.9 increases the from 37.0 to 51.3% and from 35.9 to 49.8% (Figure 5B). Figure 5C depicts that the total power input and output of the BP-SOFC-CHP system decreased from 32.59 to 23.57 MW and 3.46 to 2.92 MW respectively within the investigated ranges of . A higher means less H2 is left unreacted from the SOFC (i.e. less H2 is sent to the combustor), resulting in less thermal energy of flue gas for the CHP unit. Similarly, more consumption of H2 by the SOFC at higher requires less biomass input supplied to the BP-SOFC-CHP system in order to achieve the desired SOFC power output (2 MW AC). As a whole, with varying , the values of and of the BP-SOFC-CHP system are in the range of 9.0–10.5% and 8.5–9.9% respectively. The effect of on the overall system efficiency and biochar production are shown in Figure 5D. It is not surprising that the values of and are increased with increasing because of lower biomass input flow rate (Figure 5C). As a whole, the overall system efficiency is in the range of 75.6–77.1% for and 71.5–72.9% for , while the biochar production ranges from 0.49 to 0.68 kg s−1within the investigated ranges of .
FIGURE 5
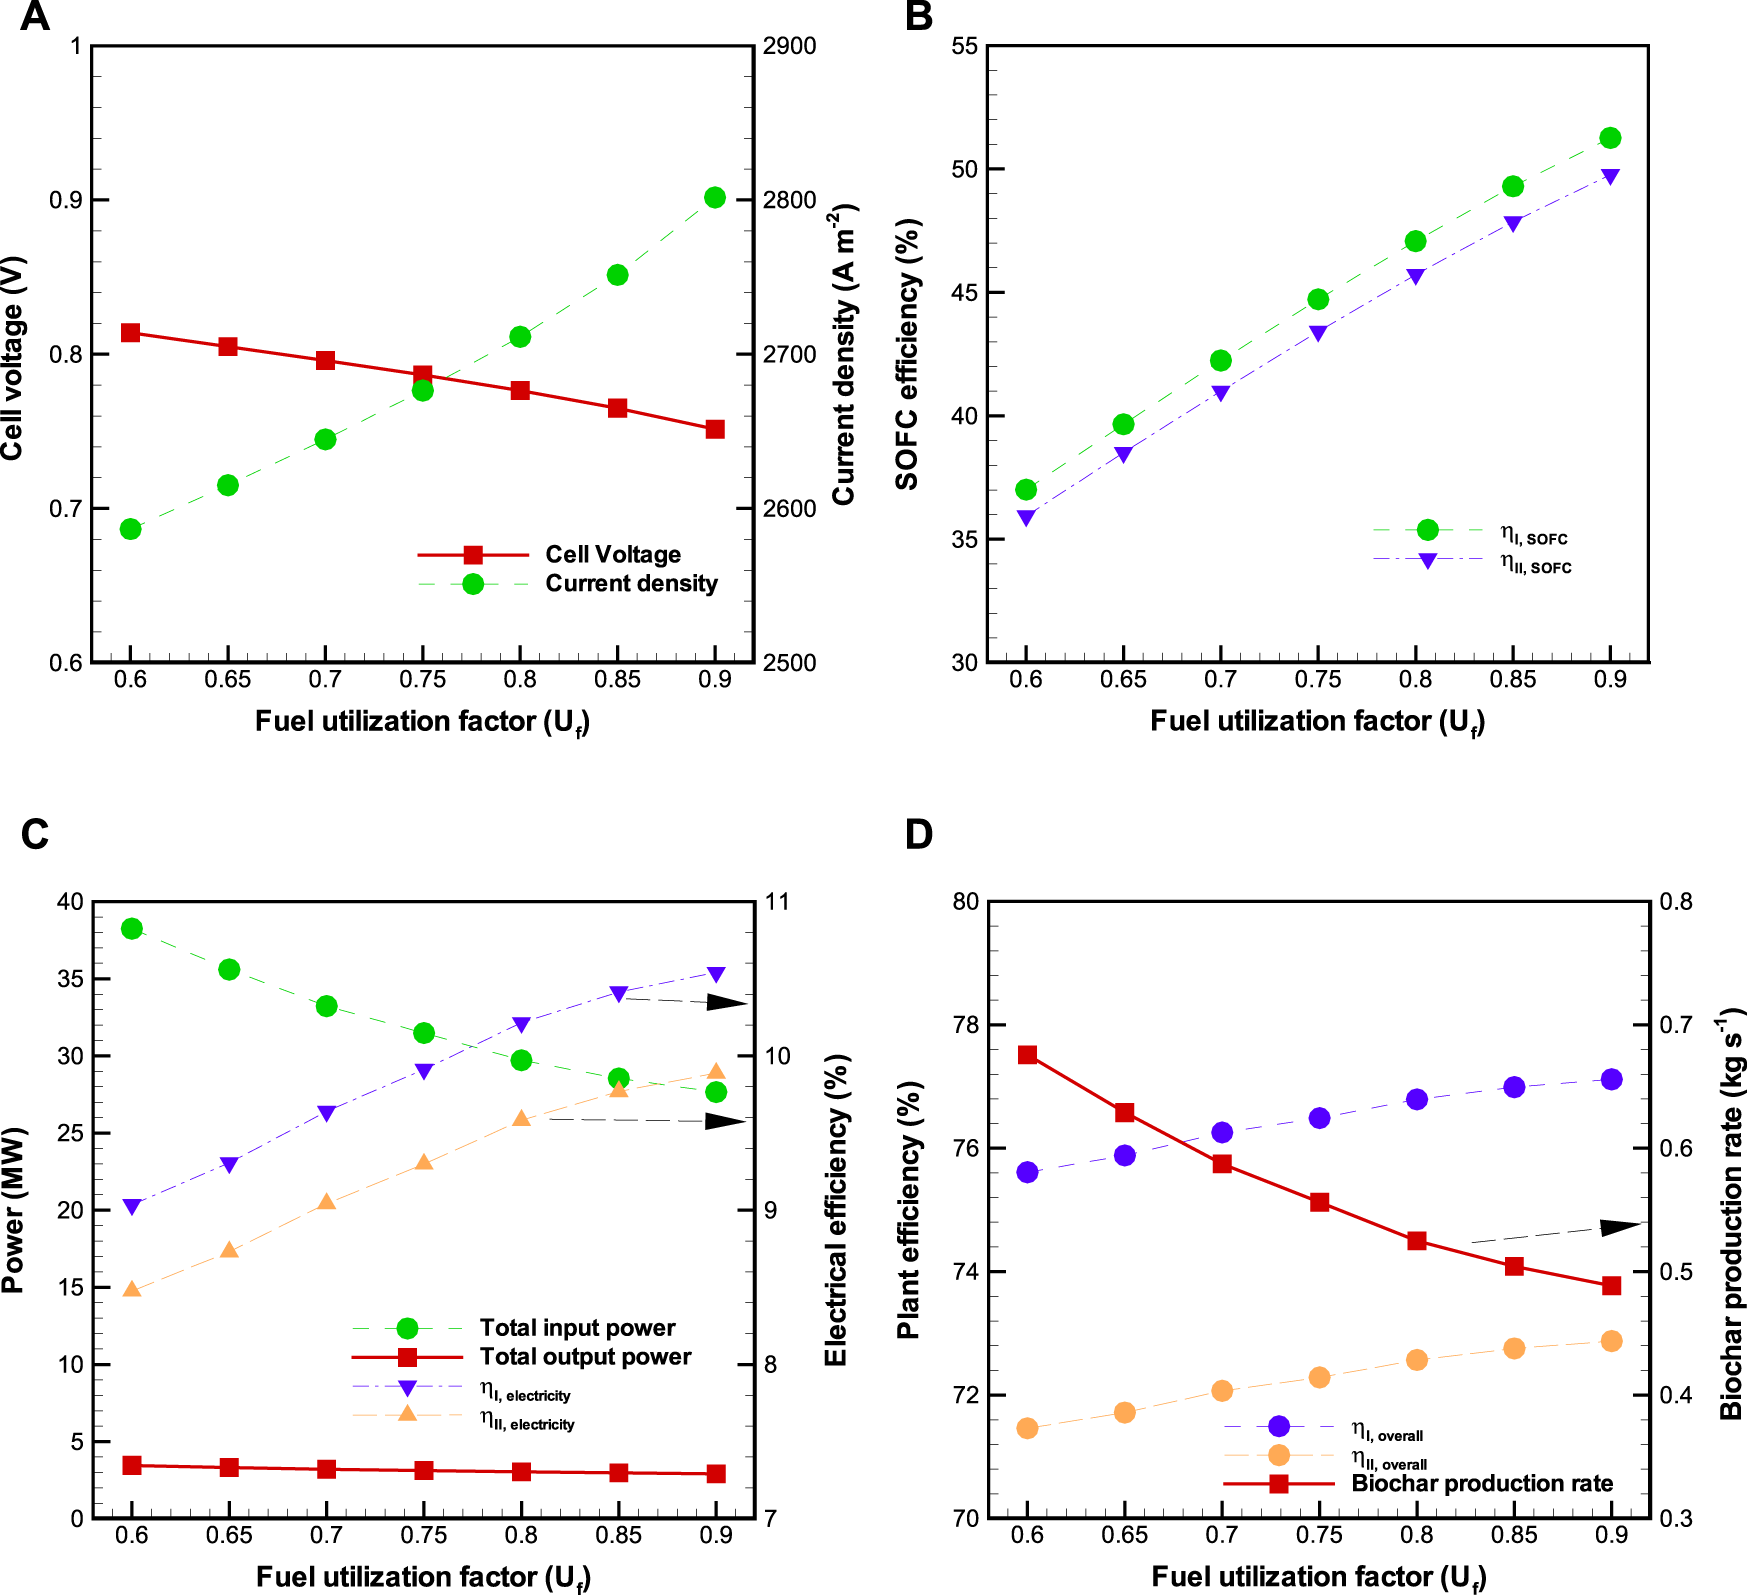
Effects of fuel utilization factor () on the BP-SOFC-CHP system: (A) SOFC cell voltage and current density, (B) SOFC efficiency, (C) total power input and output and electrical efficiency, and (D) overall system efficiency and biochar production rate.
4.2.3 Effect of reforming temperature ()
By virtue of the fact that is an important parameter affecting the performance of pyrolysis volatiles reforming unit, the effect of on the concentrations of product gas at the reformer exit is first discussed. The appropriate operating temperature for pyrolysis volatiles reforming unit is in the range of 600–850°C (Xu et al., 2015; Wang et al., 2017), hence the aforementioned range of serves as the basis of the present work.
Figure 6A displays the profiles of concentrations of H2, CO, CH4, and CO2 in the product gas as well as carbon production rate as a function of , while Table 4 presents the major chemical reactions occurring in the pyrolysis volatiles reforming reactor. It can be seen that as the is increased from 600 to 850°C, the concentrations of H2 and CO in the product gas increase from 34.0 to 42.3% and 14.4 to 43.5% respectively, whereas those of CO2 and CH4 in the product gas decline from 24.6 to 6.8% and 5.1 to 0.1% respectively. Basically, increasing is favorable to products in endothermic reactions. This is thus attributed to the fact that an increase in is conducive to the production of H2 and CO as a consequence of the endothermic dry reforming reactions (R2-R3) and steam methane reactions (R4-R8). However, the profile of concentration of H2 first grows substantially and then remains almost constant with further increase in . For example, the percentage of H2 increase from around 34.0% at 600°C to 42.0% at 750°C, and then it keeps almost constant at around 42.0% when the is higher than 750°C. Similar observations are also reported in the study of Xu et al. (2015), which concluded that from the viewpoint of H2 and CO productivity, the reformer temperature should be operated between 700 and 750°C.
FIGURE 6
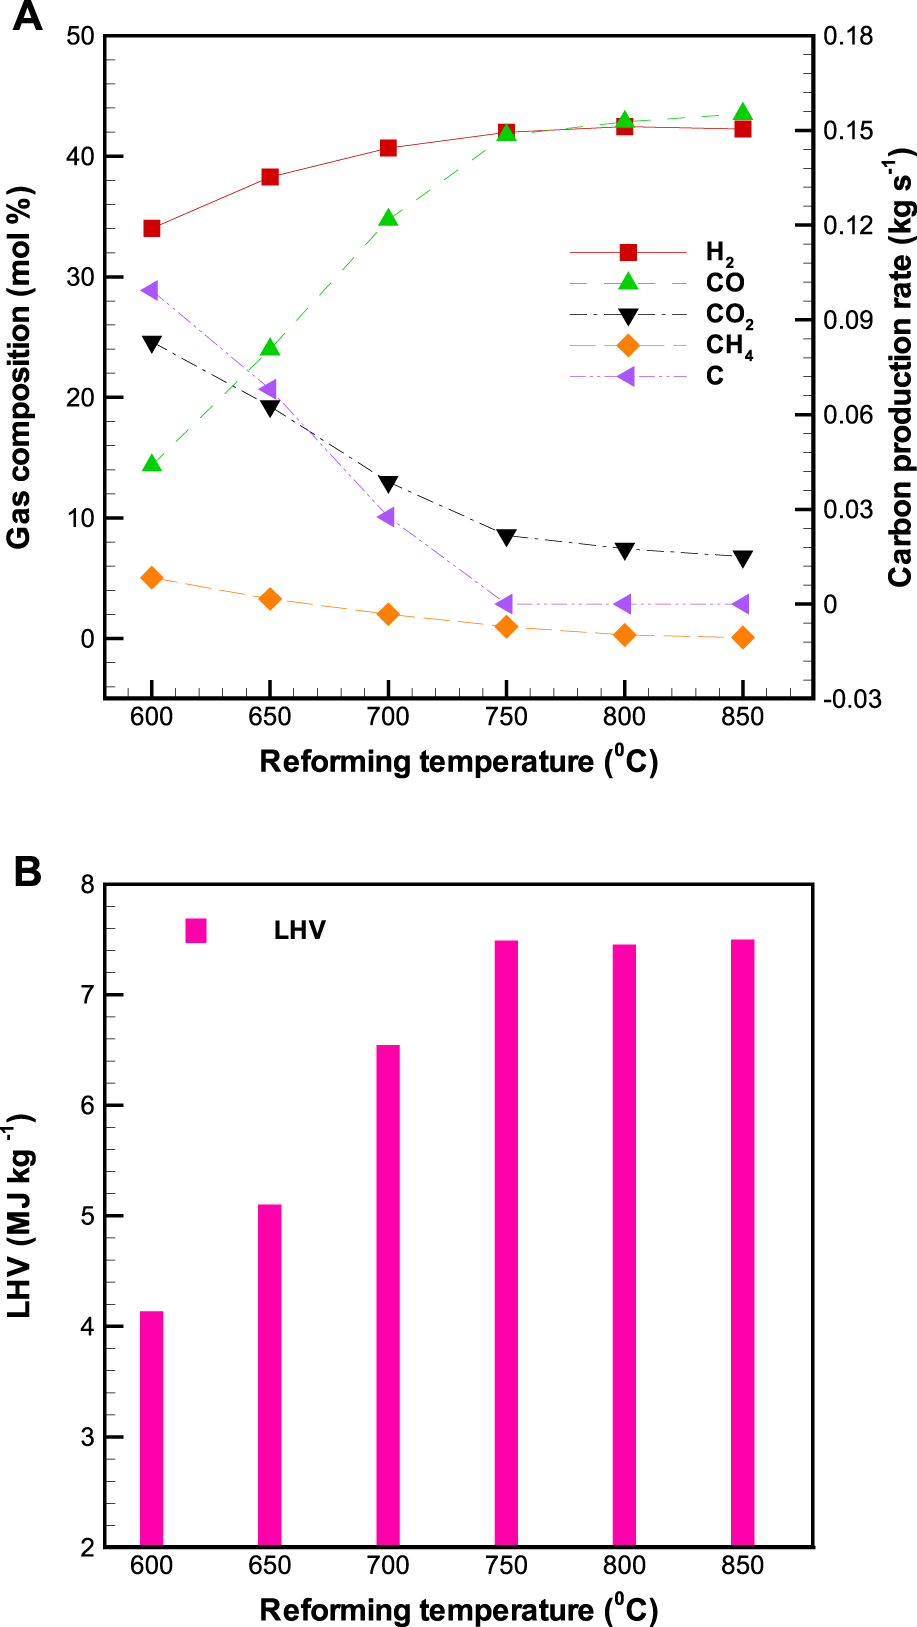
Effects of reforming temperature () on the outlet (A) gas composition, and (B) lower heating value of the product gas in the reformer.
With attention paid to carbon formation in the reformer (Figure 6A), it is clear that the carbon production rate declines drastically with increasing . For instance, when the increases from 600 to 700°C, the value of carbon production rate drops from 0.099 kg s−1 to 0.028 kg s−1. Notably, it should be pointed out that once the is as high as 750°C, no more carbon formation is observed. It has been known that methane cracking (R10), tar and hydrocarbon decomposition (R13-R14), reverse Boudouard (R11), and reverse carbon gasification reactions (R12) are major chemical reactions that contribute to carbon formation (Table 4). Among them, R10, R13, and R14 are characterized by endothermic reactions, whereas R11 and R12 are characterized by exothermic reactions. Hence, both R11 and R12 may be considered as the dominating reactions for carbon formation in the investigated range of . Similar results have been observed in the thermodynamic equilibrium calculations (using Factsage) study of Liu et al. (2013). The LHV of the product gas from the BP-SOFC-CHP system is shown in Figure 6B. It depends strongly on the from 600 to 750°C. Beyond 750°C, there is no effect on temperature as the product gas concentration is almost same. As a whole, the LHV of the product gas is in the range of 4.14–7.49 MJ kg−1.
The influence of altered on the performance of BP-SOFC-CHP system is plotted in Figures 7A–D, where the biomass input rate and of SOFC are fixed at 1.32 kg s−1, and 0.85 respectively. As seen in Figure 7A, the cell voltage slightly declines with increasing , whereas the current density raises with increase in . The reason is that increasing the from 600 to 750°C facilitates H2 production rate at the reformer exit, implying that more H2 fuel is fed to the SOFC. This also indicates that the higher the H2 fuel flow rate, the higher current density that is obtained (Figure 7A), and thereby lowers the cell voltage as a result of higher polarization losses which are closely dependent on current density. Similar observations were also reported by Lee and Strand (2009), Zhao et al. (2015), and Hou et al. (2018) while evaluating the influence of fuel flow rate on the performance of SOFC. However, it should be noted that the values of current density and cell voltage remain almost constant when the is higher than 750°C, resulting from constant H2 production rate produced in the reformer (Figure 6A). Figure 7B reveals the variation on SOFC efficiency along with the . As expected, the increase in leads to the reduction of SOFC efficiency until the reaches 750°C, as a result of higher voltages losses and the increased fuel input flow for the higher current density. The value of varies in the range of 47.7–51.1%, while that of is 46.3–49.6%. Figure 7C indicates that as the is increased from 600 to 850°C, the total power input, total power output (SOFC + CHP), , and are increased by 2.04 MW, 1.26 MW, 4.0%, and 4.0%, respectively. Nevertheless, in examining the profile of overall system efficiency (Figure 7D), it is worth noting that the overall system efficiency is slightly affected by the within the ranges investigated in this work. As a whole, the values of and are in the range of 77.1–77.6% and 72.7–73.3% respectively. With regard to biochar production rate, it decreases up to 750°C and then keeps constant with further increase in . This arises from the fact that biochar is mainly produced from the pyrolysis reactor when the is higher than 750°C.
FIGURE 7
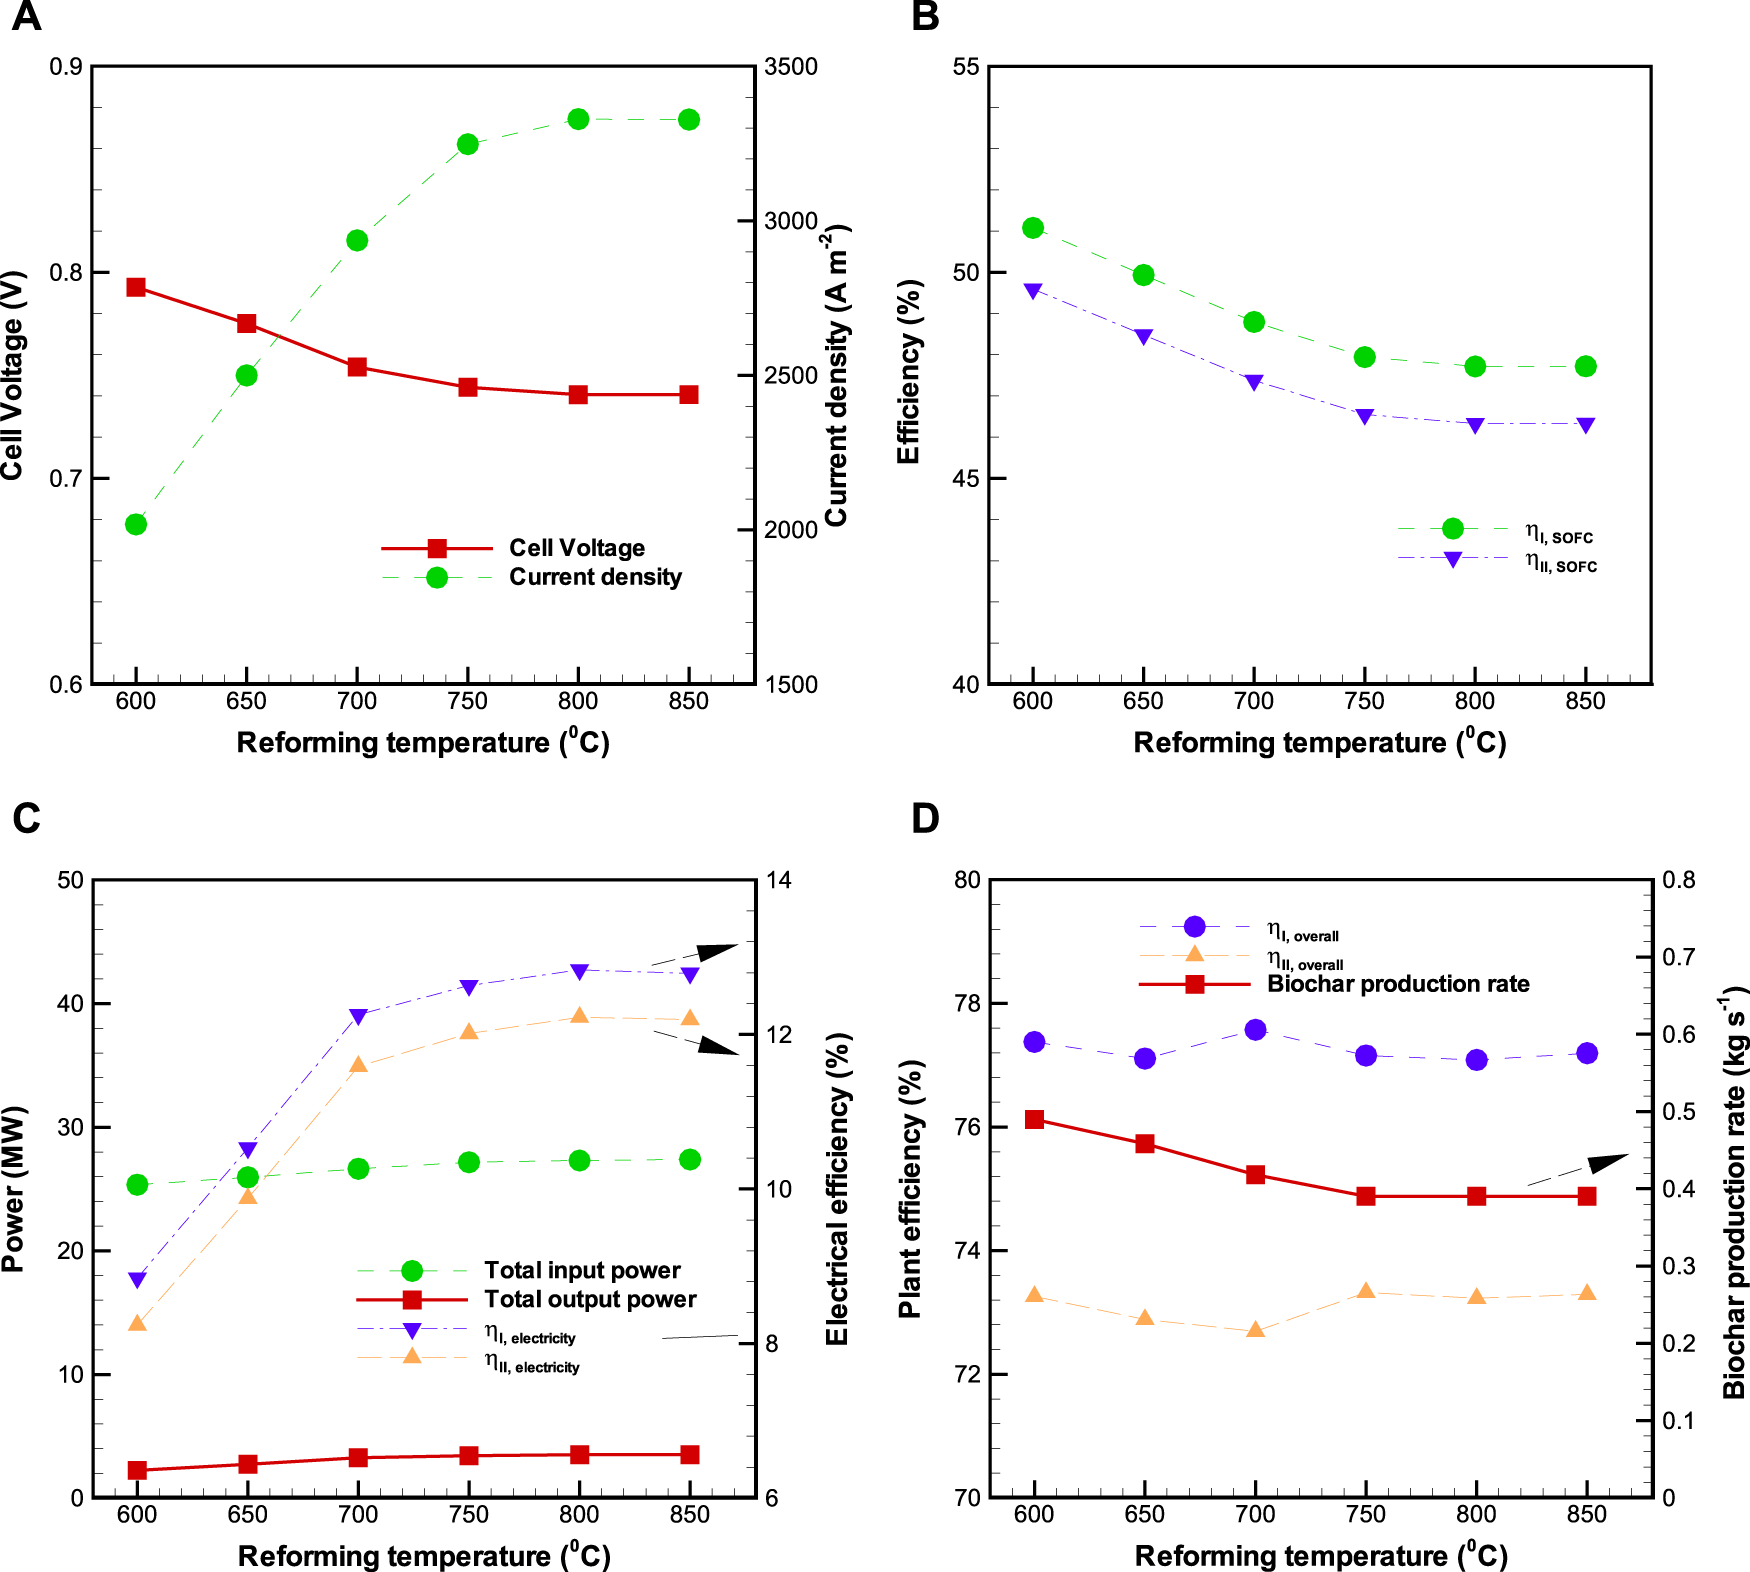
Effects of reforming temperature () on the BP-SOFC-CHP system: (A) SOFC cell voltage and current density, (B) SOFC efficiency, (C) total power input and output and electrical efficiency, and (D) overall system efficiency and biochar production rate.
4.2.4 Effect of biochar split ratio ()
The effect of biochar split ratio on the performance of BP-SOFC-CHP system is plotted in Figure 8, where biomass input rate, , and are kept at 1.32 kg s−1, 0.85, and 850°C, respectively. In this study, a splitter is used to separate out a portion of biochar from the pyrolysis reactor to the reformer. The amount of biochar sent to the reformer is determined by a biochar split ratio (), which is defined as the ratio of mass flow rate of biochar sent to pyrolysis volatiles reformer divided by the total mass flow rate of biochar produced in the pyrolysis reactor. As shown in Figure 8A, with the increase of from 0 to 20%, the SOFC voltage is decreased from 0.74 to 0.72 V, while the current density is increased from around 3327 A m−2 to 3680 A m−2. Increasing the lead to more H2 production in the pyrolysis volatiles reformer due to the carbon gasification (R15), thereby resulting in more H2 fuel flow at the anode of SOFC. However, it is found that the values of SOFC voltage and current density are independent of once the is greater than 20%. This is because no carbon gasification reaction occurs in the pyrolysis volatiles reformer due to insufficient steam concentration. Meanwhile, the increased lowers the and by 1.0 and 1.0%, respectively (Figure 8B). Overall, and can be improved by 0.7 and 0.8%, respectively (Figure 8C), by varying the from 0 to 20%, thus causing that the overall system energy () and exergy () efficiencies are marginally enhanced by 0.4 and 0.8%, respectively (Figure 8D), but the biochar production rate is decreased from 0.39 to 0.33 kg s−1 on account of less biochar generated in the pyrolysis reactor. The results through various parametric sensitivity analyses are helpful for the design of a flexible and efficient system for co-generation of biochar and power production, from an economic point of view.
FIGURE 8
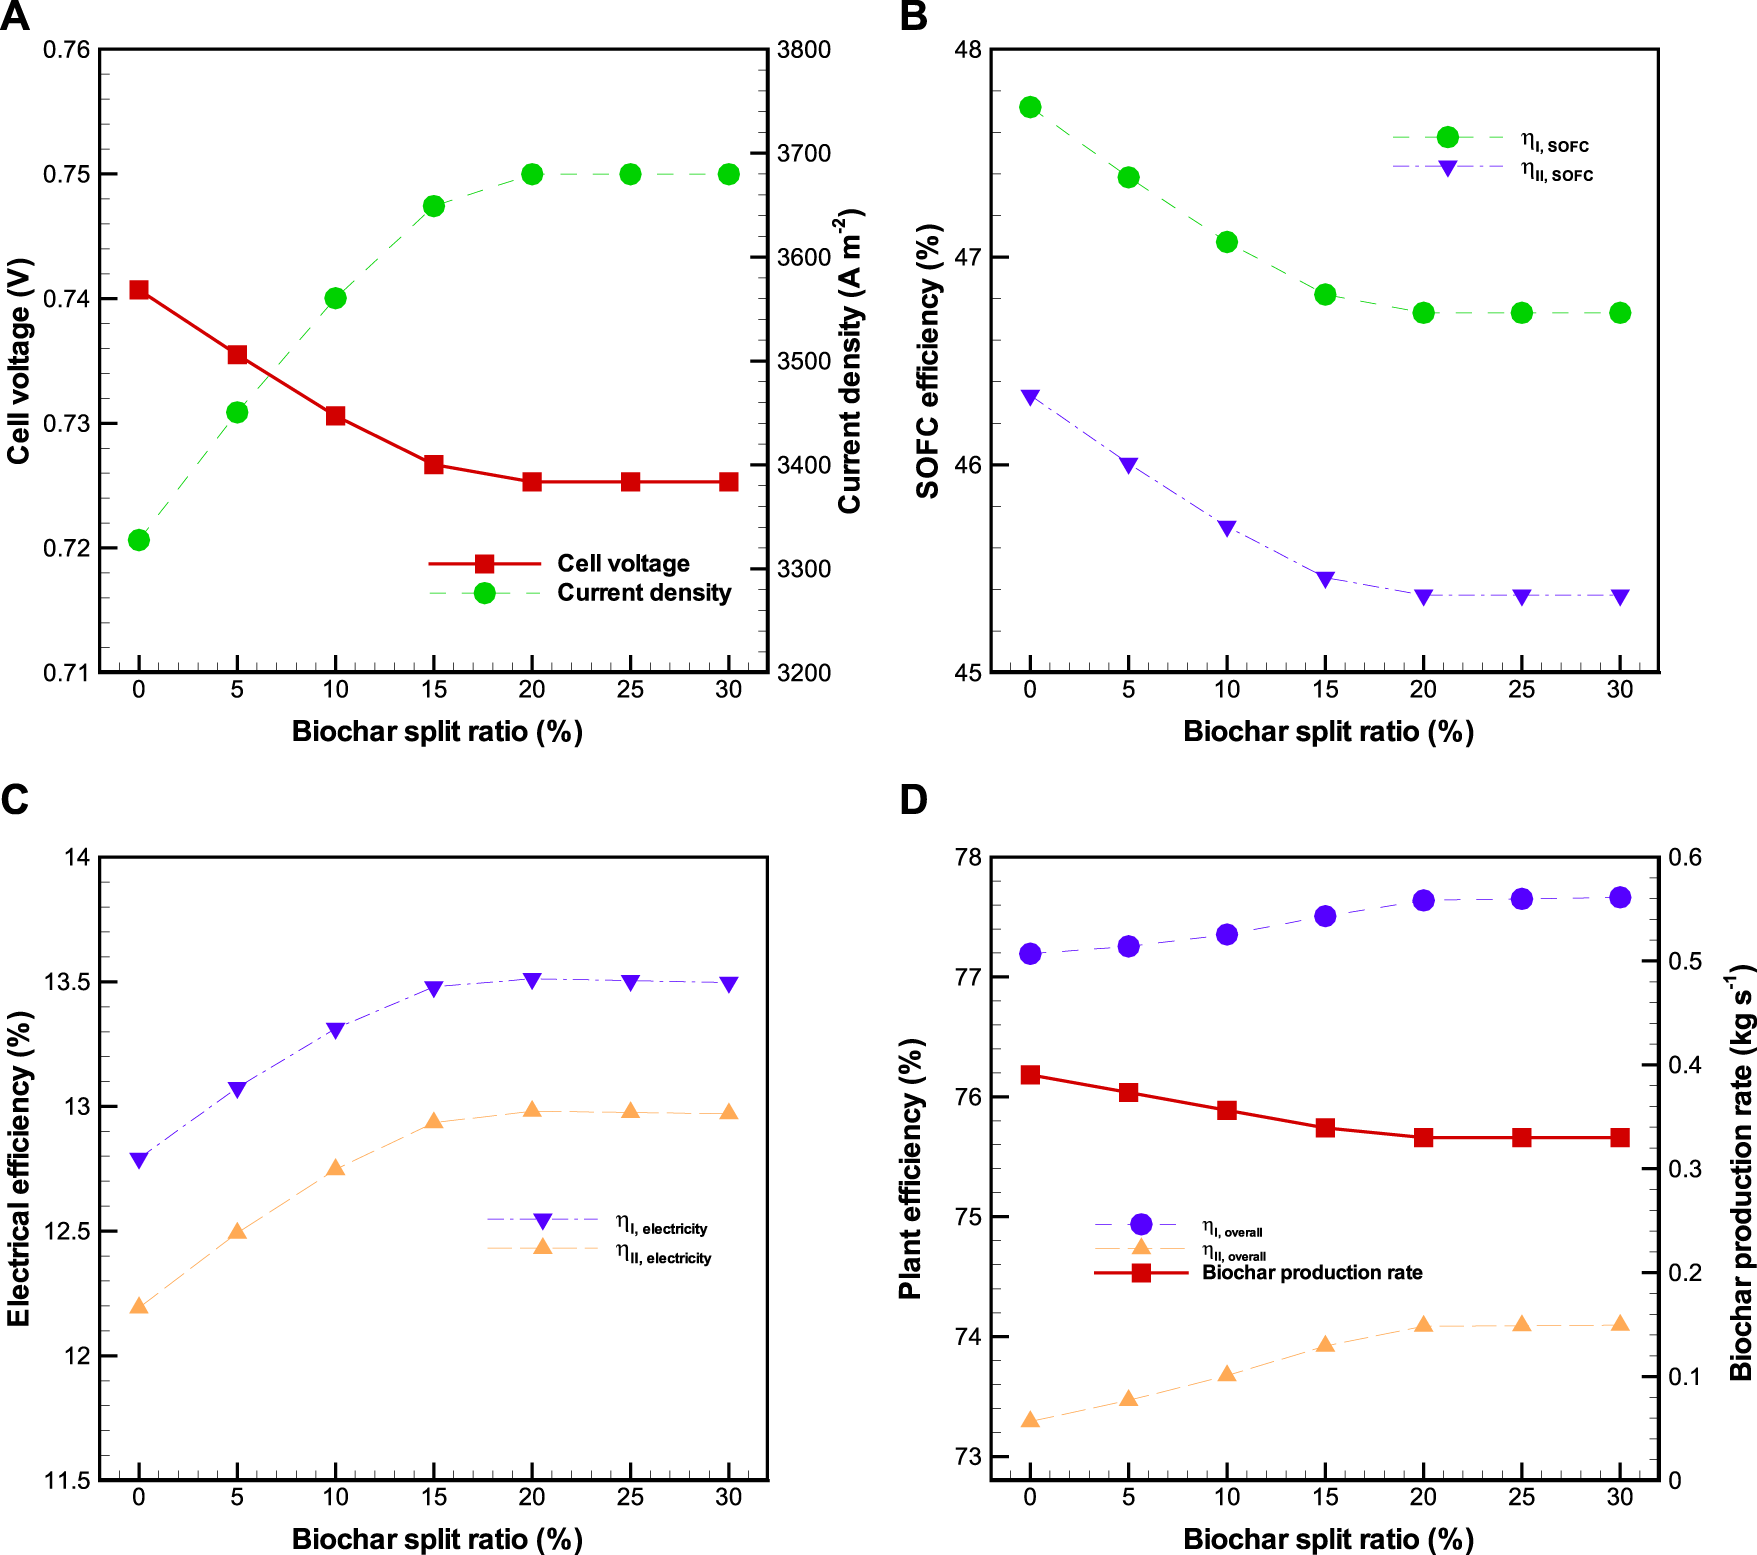
Effects of biochar split ratio () on the BP-SOFC-CHP system: (A) SOFC cell voltage and current density, (B) SOFC efficiency, (C) electrical efficiency, and (D) overall system efficiency and biochar production rate.
4.3 A stand-alone design of the biomass pyrolysis-solid oxide fuel cell-combined heat and power system
In view of the endothermic reactions during biomass pyrolysis and the pyrolysis volatiles reforming processes, a stand-alone design of the BP-SOFC-CHP system for co-generation of biochar and power is eventually proposed. In order to achieve a self-sustainable process, pyrolysis gas which contained the second-highest energy content in the overall system is sent to a combustor to generate heat for the drying, heating, pyrolysis, and reforming processes. Figure 9 demonstrates the layout of the stand-alone design of the BP-SOFC-CHP system in terms of mass and energy balance, where , , and are 0.85, 700°C and 0% respectively, and the mass flow rate of biomass is 1.32 kg s−1. In addition, this stand-alone design assumes that a hydrogen recovery rate of 85% with a purity of 99.9 mol% can be obtained from the pyrolysis gas by employing a separator unit. The off-gas (includes a portion of unrecovered hydrogen) from the separator is fed to the combustor in which an RStoic reactor is used to simulate the combustion process. Under the prescribed operating conditions, as shown in Figure 9, the total energy demand of the BP-SOFC-CHP system is approximately 4.5 MW, which includes the energy requirements of about 0.47 MW (), 1.33 MW (), 1.01 MW (), 1.71 MW () for drying, pyrolysis, reforming, and process heating respectively. From the viewpoint of energy balance, it is apparent that the energy required for the overall BP-SOFC-CHP system at a pyrolysis temperature of 500°C can be completely supplied by burning the pyrolysis gas with 120% excess air. In the studies of Abrego et al. (2018) and Cong et al. (2018), they also reported that burning the fuel gases from the biomass pyrolysis could supply enough heat energy to sustain the system in the pyrolysis temperature range of 500–650°C. Accordingly, considering the system power output and recoverable heat, the values of , and of the stand-alone BP-SOFC-CHP system are 5.4, 63.9 and 57.8% respectively, with a biochar yield of 31.6%. It should be noted that the thermodynamic efficiency of the system is based on a hydrogen recovery rate of 85%. The energy penalty for a feasible hydrogen separation technology such as membranes and pressure swing adsorption has not been considered in the present system. This is required to be integrated into the system (He, 2021) and will be considered in the future works.
FIGURE 9
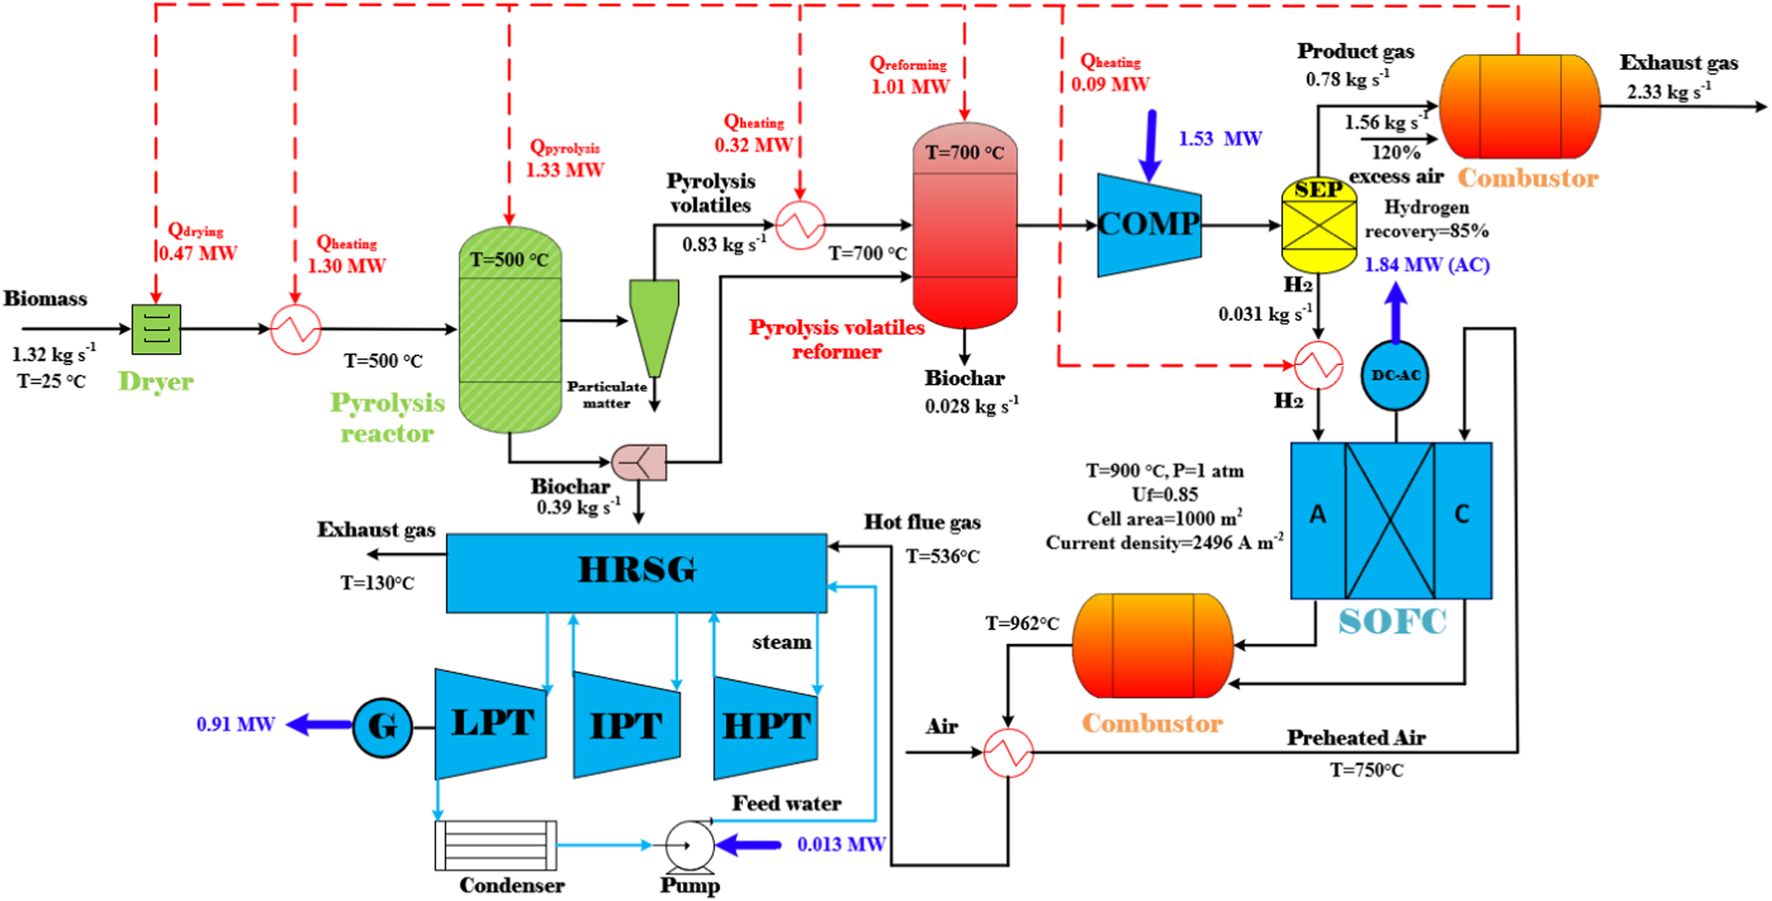
The stand-alone design of the BP-SOFC-CHP system for the co-generation of biochar and electricity.
5 Conclusions and future work
A novel integrated BP-SOFC-CHP system for the co-generation of biochar and power is developed and its performance is examined through a thermodynamic analysis. Parametric analysis carried out on the BP-SOFC-CHP system has highlighted the following conclusions:
1) Based on variation in operating parameters including current density (), fuel utilization factor (), reforming temperature (), biochar split ratio (), the system efficiency calculations performed reveal that the overall electrical (), energy () and exergy () efficiencies of the BP-SOFC-CHP system are in the range of 8–13%, 76–78% and 71–74% respectively, with a biochar yield of around 34%.
2) Varying from 1,000 to 4000 A m−2 results in a decrease of 1.4 and 1.3% in the and respectively, while the biochar yield varied between 34.5 and 34.7%. This is due to the increased biomass input flow rate, leading to an increase in total input power, as rises.
3) Varying from 0.6 to 0.9 leads to an increase of 1.5 and 1.4% in the and respectively, while the biochar yield is around 34.7%. This is attributed to the less biomass input required for the BP-SOFC-CHP system to achieve the desired SOFC power output, as rises.
4) Additional carbon formation from the pyrolysis volatiles reforming unit is observed when the is in the range of 600–750°C. As a whole, under fixed biomass fuel input of 1.32 kg s−1 and of 0.85, increasing the has little impact on the and .
5) Based on biomass fuel input of 1.32 kg s−1, of 0.85, and of 850°C, increasing the from 0 to 20% is able to increase the and due to the intensified carbon gasification reaction in the pyrolysis volatiles reformer under high reforming temperature conditions. However, the performance of BP-SOFC-CHP system will not be further improved once the is greater than 20% because of insufficient steam concentration.
6) According to energy balance, with a hydrogen recovery rate of 85% from the hydrogen separation unit, it is possible to operate a stand-alone BP-SOFC-CHP system by burning the pyrolysis gas. Such a self-sustainable design of the BP-SOFC-CHP system can yield the , , and of 5.4, 63.9 and 57.8% respectively, with a biochar yield of 31.6%.
Based on the above simulation results in view of thermodynamic evaluations, it is concluded that the developed BP-SOFC-CHP system not only offers high system energy efficiency (64%), but also generates a biochar yield of at least 30%, which can be further utilized in various fields. Such a novel integrated system is therefore helpful for developing the negative emissions technologies in the near future. However, to further investigate the technical feasibility of the proposed system, the following remarks should be explored in future work: 1) evaluate and identify a suitable hydrogen separation technology and integrate it with this system, and 2) an in-depth techno-economic analysis and a life cycle analysis from the economic and environmental perspective should be carried out.
Statements
Data availability statement
The original contributions presented in the study are included in the article/supplementary material, further inquiries can be directed to the corresponding author.
Author contributions
P-CK and BI: investigation, conceptualization, writing—original draft, writing—review and editing FO: writing—review and editing P-CK, TW, and PA: conceptualization, writing—review and editing, supervision.
Funding
The authors also acknowledge the financial support of Ministry of National Education, Turkey and Japan Society for the Promotion of Science under Grant No. JP-22F21041.
Acknowledgments
The authors would like to thank Chaitanya Joglekar, Energy and Sustainability Research Institute Groningen, University of Groningen, the Netherlands for his extensive support in reviewing the manuscript and fruitful discussions in our research work.
Conflict of interest
The authors declare that the research was conducted in the absence of any commercial or financial relationships that could be construed as a potential conflict of interest.
Publisher’s note
All claims expressed in this article are solely those of the authors and do not necessarily represent those of their affiliated organizations, or those of the publisher, the editors and the reviewers. Any product that may be evaluated in this article, or claim that may be made by its manufacturer, is not guaranteed or endorsed by the publisher.
References
1
Abrego J. Plaza D. Luno F. Atienza-Martinez M. Gea G. (2018). Pyrolysis of cashew nutshells: Characterization of products and energy balance. Energy158, 72–80. 10.1016/j.energy.2018.06.011
2
AlNouss A. Parthasarathy P. Shahbaz M. Al-Ansari T. Mackey H. McKay G. (2020). Techno-economic and sensitivity analysis of coconut coir pith-biomass gasification using ASPEN PLUS. Appl. Energy261, 114350. 10.1016/j.apenergy.2019.114350
3
Aravind P. V. Woudstra T. Woudstra N. Spliethoff H. (2009). Thermodynamic evaluation of small-scale systems with biomass gasifiers, solid oxide fuel cells with Ni/GDC anodes and gas turbines. J. Power Sources190, 461–475. 10.1016/j.jpowsour.2009.01.017
4
Arregi A. Amutio M. Lopez G. Artetxe M. Alvarez J. Bilbao J. et al (2017). Hydrogen-rich gas production by continuous pyrolysis and in-line catalytic reforming of pine wood waste and HDPE mixtures. Energy Convers. Manag.136, 192–201. 10.1016/j.enconman.2017.01.008
5
Ayodele B. V. Mustapa S. I. Tuan Abdullah T. A. R. B. Salleh S. F. (2019). A mini-review on hydrogen-rich syngas production by thermo-catalytic and bioconversion of biomass and its environmental implications. Front. Energy Res.7, 118. 10.3389/fenrg.2019.00118
6
Baldinelli A. Cinti G. Desideri U. Fantozzi F. (2016). Biomass integrated gasifier-fuel cells: Experimental investigation on wood syngas tars impact on NiYSZ-anode Solid Oxide Fuel Cells. Energy Convers. Manag.128, 361–370. 10.1016/j.enconman.2016.09.048
7
Chen T. Liu R. Scott N. R. (2016). Characterization of energy carriers obtained from the pyrolysis of white ash, switchgrass and corn stover-Biochar, syngas and bio-oil. Fuel Process. Technol.142, 124–134. 10.1016/j.fuproc.2015.09.034
8
Chiodo V. Galvagno A. Lanzini A. Papurello D. Urbani F. Santarelli M. et al (2015). Biogas reforming process investigation for SOFC application. Energy Convers. Manag.98, 252–258. 10.1016/j.enconman.2015.03.113
9
Cohce M. K. Dincer I. Rosen M. A. (2010). Thermodynamic analysis of hydrogen production from biomass gasification. Int. J. Hydrogen Energy35, 4970–4980. 10.1016/j.ijhydene.2009.08.066
10
Cong H. Masek O. Zhao L. Yao Z. Meng H. Hu E. et al (2018). Slow pyrolysis performance and energy balance of corn stover in continuous pyrolysis-based poly-generation systems. Energy fuels.32, 3743–3750. 10.1021/acs.energyfuels.7b03175
11
Dechapanya W. Rattanahirun S. Khamwichit A. (2020). Syngas production from palm kernel shells with enhanced tar removal using biochar from agricultural residues. Front. Energy Res.8, 157. 10.3389/fenrg.2020.00157
12
Detchusananard T. Sharma S. Marechal F. Arpornwichanop A. (2019). Multi-objective optimization of sorption enhanced steam biomass gasification with solid oxide fuel cell. Energy Convers. Manag.182, 412–429. 10.1016/j.enconman.2018.12.047
13
Din Z. U. Zainal Z. A. (2016). Biomass integrated gasification–SOFC systems: Technology overview. Renew. Sustain. Energy Rev.53, 1356–1376. 10.1016/j.rser.2015.09.013
14
Doherty W. Reynolds A. Kennedy D. (2010). Computer simulation of a biomass gasification-solid oxide fuel cell power system using Aspen Plus. Energy35, 4545–4555. 10.1016/j.energy.2010.04.051
15
Emun F. Gadalla M. Majozi T. Boer D. (2010). Integrated gasification combined cycle (IGCC) process simulation and optimization. Comput. Chem. Eng.34, 331–338. 10.1016/j.compchemeng.2009.04.007
16
Fuss S. Johnsson F. (2021). The BECCS implementation gap-A Swedish case study. Front. Energy Res.8, 553400. 10.3389/fenrg.2020.553400
17
Hanak D. P. Jenkins B. G. Kruger T. Manovic V. (2017). High-efficiency negative-carbon emission power generation from integrated solid-oxide fuel cell and calciner. Appl. Energy205, 1189–1201. 10.1016/j.apenergy.2017.08.090
18
He X. (2021). A novel hybrid digestion-gasification process integrated with membranes for efficient conversion of biomass to bio-alcohols. Green Energy & Environ.6, 15–21. 10.1016/j.gee.2020.04.003
19
Hou Q. Zhao H. Yang X. (2018). Thermodynamic performance study of the integrated MR-SOFC-CCHP system. Energy150, 434–450. 10.1016/j.energy.2018.02.105
20
Lee J. Kim K. H. Kwon E. E. (2017). Biochar as a catalyst. Renew. Sustain. Energy Rev.77, 70–79. 10.1016/j.rser.2017.04.002
21
Lee K., H. Strand R. K. (2009). SOFC cogeneration system for building applications, part 1: Development of SOFC system-level model and the parametric study. Renew. Energy34, 2831–2838. 10.1016/j.renene.2009.04.010
22
Liu M. Aravind P. V. Woudstra T. Cobas V. R. M. Verkooijen A. H. M. (2011). Development of an integrated gasifier-solid oxide fuel cell test system: A detailed system study. J. Power Sources196, 7277–7289. 10.1016/j.jpowsour.2011.02.065
23
Liu M. Kleij A. van der. Verkooijen A. H. M. Aravind P. V. (2013). An experimental study of the interaction between tar and SOFCs with Ni/GDC anodes. Appl. Energy108, 149–157. 10.1016/j.apenergy.2013.03.020
24
Manyà J. J. Azuara M. Manso J. A. (2018). Biochar production through slow pyrolysis of different biomass materials: Seeking the best operating conditions. Biomass Bioenergy117, 115–123. 10.1016/j.biombioe.2018.07.019
25
Mehrpooya M. Ghorbani B. Abedi H. (2020). Biodiesel production integrated with glycerol steam reforming process, solid oxide fuel cell (SOFC) power plant. Energy Convers. Manag.206, 112467. 10.1016/j.enconman.2020.112467
26
Mojaver P. Abbasalizadeh M. Khalilarya S. Chitsaz A. (2020b). Co-generation of electricity and heating using a SOFC-ScCO2 Brayton cycle-ORC integrated plant: Investigation and multi-objective optimization. Int. J. Hydrogen Energy35, 4970–4980.
27
Mojaver P. Khalilarya S. Chitsaz A. Assadi M. (2020a). Multi-objective optimization of a power generation system based SOFC using Taguchi/AHP/TOPSIS triple method. Sustain. Energy Technol. Assessments38, 100674. 10.1016/j.seta.2020.100674
28
Ozcan H. Dincer I. (2014). Thermodynamic analysis of a combined chemical looping-based trigeneration system. Energy Convers. Manag.85, 477–487. 10.1016/j.enconman.2014.06.011
29
Rafiq M. K. Bachmann R. T. Rafiq M. T. Shang Z. Joseph S. Joseph R. (2016). Influence of pyrolysis temperature on physico-chemical properties of corn stover (Zea mays L.) biochar and feasibility for carbon capture and energy balance. PLoS One11, e0156894. 10.1371/journal.pone.0156894
30
Recalde M. Woudstra T. Aravind P. V. (2019). Gasifier, solid oxide fuel cell integrated systems for energy production from wet biomass. Front. Energy Res.7, 129. 10.3389/fenrg.2019.00129
31
Rosha P. Kumar S. Ibrahim H. (2022). Sensitivity analysis of biomass pyrolysis for renewable fuel production using Aspen Plus. Energy247, 123545. 10.1016/j.energy.2022.123545
32
Saidur R. BoroumandJazi G. Mekhilef S. Mohammed H. A. (2012). A review on exergy analysis of biomass based fuels. Renew. Sustain. Energy Rev.16, 1217–1222. 10.1016/j.rser.2011.07.076
33
Spallina V. Nocerino P. Romano M. C. Annaland M. V. S. Campanari S. Gallucci F. (2018). Integration of solid oxide fuel cell (SOFC) and chemical looping combustion (CLC) for ultra-high efficiency power generation and CO2 production. Int. J. Greenh. Gas Control71, 9–19. 10.1016/j.ijggc.2018.02.005
34
Taufiq B. N. Kikuchi Y. Ishimoto T. Honda K. Koyama M. (2015). Conceptual design of light integrated gasification fuel cell based on thermodynamic process simulation. Appl. Energy147, 486–499. 10.1016/j.apenergy.2015.03.012
35
Thattai A. T. Oldenbroek V. Schoenmakers L. Woudstra T. Aravind P. V. (2017). Towards retrofitting integrated gasification combined cycle (IGCC) power plants with solid oxide fuel cells (SOFC) and CO2 capture-A thermodynamic case study. Appl. Therm. Eng.114, 170–185. 10.1016/j.applthermaleng.2016.11.167
36
Uroic Štefanko A. Leszczynska D. (2020). Impact of biomass source and pyrolysis parameters on physicochemical properties of biochar manufactured for innovative applications. Front. Energy Res.8, 138. 10.3389/fenrg.2020.00138
37
Wang N. Chen D. Arena U. He P. (2017). Hot char-catalytic reforming of volatiles from MSW pyrolysis. Appl. Energy191, 111–124. 10.1016/j.apenergy.2017.01.051
38
Weldekidan H. Strezov V. He J. Kumar R. Asumadu-Sarkodie S. Doyi I. N. Y. et al (2019). Energy conversion efficiency of pyrolysis of chicken litter and rice husk biomass. Energy fuels.33, 6509–6514. 10.1021/acs.energyfuels.9b01264
39
Xu X. Jiang E. Wang M. Xu Y. (2015). Dry and steam reforming of biomass pyrolysis gas for rich hydrogen gas. Biomass Bioenergy78, 6–16. 10.1016/j.biombioe.2015.03.015
40
Yaashikaa P. R. Kumar P. S. Varjani S. J. Saravanan A. (2019). Advances in production and application of biochar from lignocellulosic feedstocks for remediation of environmental pollutants. Bioresour. Technol.292, 122030. 10.1016/j.biortech.2019.122030
41
Yang H. Kudo S. Kuo H. P. Norinaga K. Mori A. Masek O. et al (2013). Estimation of enthalpy of bio-oil vapor and heat required for pyrolysis of biomass. Energy fuels.27, 2675–2686. 10.1021/ef400199z
42
Zhang S. Liu H. Liu M. Sakaue E. Li N. Zhao Y. (2017). An efficient integration strategy for a SOFC-GT-SORC combined system with performance simulation and parametric optimization. Appl. Therm. Eng.121, 314–324. 10.1016/j.applthermaleng.2017.04.066
43
Zhang Y. Li B. Li H. Zhang B. (2012). Exergy analysis of biomass utilization via steam gasification and partial oxidation. Thermochim. Acta538, 21–28. 10.1016/j.tca.2012.03.013
44
Zhao H. Jiang T. Hou H. (2015). Performance analysis of the SOFC-CCHP system based on H2O/Li-Br absorption refrigeration cycle fueled by coke oven gas. Energy91, 983–993. 10.1016/j.energy.2015.08.087
Summary
Keywords
biochar, SOFC, biomass pyrolysis, process integration, thermodynamic analysis, negative emissions technologies
Citation
Kuo P-C, Illathukandy B, Özdemir F, Woudstra T and Aravind PV (2022) Thermodynamic analysis of a novel integrated biomass pyrolysis-solid oxide fuel cells-combined heat and power system for co-generation of biochar and power. Front. Energy Res. 10:731191. doi: 10.3389/fenrg.2022.731191
Received
26 June 2021
Accepted
18 July 2022
Published
13 September 2022
Volume
10 - 2022
Edited by
Amornchai Arpornwichanop, Chulalongkorn University, Thailand
Reviewed by
Xuezhong He, Guangdong Technion-Israel Institute of Technology (GTIIT), China
Parisa Mojaver, Urmia University, Iran
Updates
Copyright
© 2022 Kuo, Illathukandy, Özdemir, Woudstra and Aravind.
This is an open-access article distributed under the terms of the Creative Commons Attribution License (CC BY). The use, distribution or reproduction in other forums is permitted, provided the original author(s) and the copyright owner(s) are credited and that the original publication in this journal is cited, in accordance with accepted academic practice. No use, distribution or reproduction is permitted which does not comply with these terms.
*Correspondence: Po-Chih Kuo, pckuo225@gmail.com
This article was submitted to Carbon Capture, Utilization and Storage, a section of the journal Frontiers in Energy Research
Disclaimer
All claims expressed in this article are solely those of the authors and do not necessarily represent those of their affiliated organizations, or those of the publisher, the editors and the reviewers. Any product that may be evaluated in this article or claim that may be made by its manufacturer is not guaranteed or endorsed by the publisher.