 Yangyang Tan1
 Honggang Fan
- 1Jiangxi Port and Waterway Construction Investment Group Co., Ltd., Jian, China
- 2China Water Resources Pearl River Planning Surveying and Designing Co., Ltd., Guangzhou, China
- 3Shanghai Chongming District Miao Town Water Affairs Management Office, Shanghai, China
- 4State Key Laboratory of Hydroscience and Engineering, Department of Energy and Power Engineering, Tsinghua University, Beijing, China
- 5Jiangxi Jiepai Navigation and electricity Hub Management Office, Yingtan, China
Deep learning technique is an effective mean of processing complex data that has emerged in recent years, which has been applied to fault diagnosis of a wide range of equipment. In the present study, three types of deep learning techniques, namely, stacked autoencoder (SAE) network, long short term memory (LSTM) network, and convolutional neural network (CNN) are applied to fault diagnosis of a mixed-flow pump under cavitation conditions. Vibration signals of the mixed-flowed pump are collected from experiment measurements, and then employed as input datasets for deep learning networks. The operation status is clarified into normal, minor cavitation, and severe cavitation conditions according to visualized bubble density. The techniques of FFT and dropout algorithms are also applied to improve diagnosis accuracy. The results show that the diagnosis accuracy based on SAE and LSTM networks is lower than 50%, while is higher than 68% when using CNN. The maximum accuracy can reach 87.2% by mean of a combination of CNN, BN, MLP, and using frequency domain data by FFT as inputs, which validates the feasibility of applying CNN in mixed-flow pumps.
1 Introduction
Mixed pumps are widely-used equipment in various industrial processes, and are introduced to water jet propulsion in recent years due to their better performances in high efficiency, low vibration, and anti-cavitation. There will inevitably appear various types of faults during the operation of mixed-flow pumps, i.e., rotation stall and severe cavitation. It is of great significance to detect and diagnose the fault status in time, so that continuous deterioration or serious damage due to the fault can be avoided. Generally, pressure and vibration of mixed-flow pumps are used as signals to monitor operating status, which can reflect sufficient information of the operation. However, the process of fault diagnosis still relies on artificial experience at present, which is unable to adapt to the current development trend of high automation. Therefore, it is significant to develop a more effective and efficient tool for fault diagnosis.
As pressure and vibration signals often contain a wealth of information in the time and frequency domains, various methods based on the conversion between the time domain and the frequency domain are introduced to the fault diagnosis of pumps. The wavelet packet decomposition and wavelet coefficient residual analysis are applied to the health diagnosis of hydraulic pumps by Gao and Zhang (2006). Signals of pump discharge pressure were measured, and then wavelet residuals were calculated to assess the health status. It is reported that an accuracy rate higher than 90% could be achieved. Muralidharan and Sugumaran (2013) developed a wavelet analysis approach combined with rough set theory. Different membership function was used for fuzzy classification, and performed equally well. In practice, signals are often interfered by noise. Gao et al. (2018) proposed a denoising method based on the Walsh transform with multi-sensor strategy, and the feasibility of the proposed method is validated by numerical and experimental investigations. In addition to methods based on wavelet analysis, other types of methods have also been introduced to the fault diagnosis of pumps, i.e., Symbolic Perceptually Important Point (SPIP) and Hidden Markov Model (HMM) (Jia et al., 2018), Sparse Representation (Han, 2019), and Mode Decomposition (Lan et al., 2018; Li Z. et al., 2021; Liu et al., 2021). However, although it is effective to extract information in time and frequency domains using these methods, the criterion to justify whether pumps are normal or fault is often set artificially, which restricts their further applications.
Recent years, tools based on artificial intelligence have been greatly developed due to the significant progress on computer technology. Such techniques including machine learning, neural networks, and deep learning, are introduced, and applied in various aspects of engineering practice, i.e., solar cells (Mahmood and Wang, 2021), image processing (Hou et al., 2021). The machine learning techniques are also applied in fault diagnosis of different machineries like high-speed trains (Chen et al., 2022) and wind turbine generator bearings (Li H. et al., 2021). In terms of fault diagnosis in pumps, there are also several studies. The early attempts on intelligent diagnosis starts from Support Vector Machine. Xue et al. (2014) developed a fault diagnosis method for centrifugal pumps using vibration signal based on statistic filter, support vector machine, possibility theory, and Dempster-Shafer theory. Zhou et al. (2019) proposed a combined method of unscented Kalman filter and radial basis function neural networks for fault diagnosis in pumping unit. It is reported that the accuracy rate of 92.14% can be achieved with 2100 training samples and 700 test data. Sakthivel et al. (2010) developed a vibration-based fault diagnosis based on decision tree algorithm with artificial neural networks and fuzzy logic, and a classification accuracy higher than 99.5% can be obtained. In order to develop the deep learning technique with better learning ability, the wavelet transform is employed to extract signals’ feature in frequency domain, and convolutional neural network is established for piston pumps (Tang et al., 2020) (Zhu et al., 2021). The accuracy rate can reach up to 97% using these techniques.
According to the knowledge of authors, investigation on fault diagnosis of mixed-flow pumps using deep learning techniques is relatively rare. It is of great importance to develop effective deep learning tools for fault diagnosis of mixed-flow pumps with sufficient accuracy, so that operation stability of mixed-flow pumps can be maintained in practice.
2 Deep learning techniques
Deep learning is a machine learning method based on bionics, which simulates human neurons conducting information and thus builds multi-layer non-linear mappings (Alzubaidi et al., 2021). Compared with traditional machine learning techniques, multiple hidden layers can be established in deep learning technique, so that the hidden features of the data can be discovered layer by layer. Totally three types of deep learning techniques are employed in the present study, namely, Stacked Auto-Encoder (SAE) network, Long Short Term Memory (LSTM) network, and Convolutional Neural Network (CNN).
2.1 Stacked autoencoder network
The structure of stacked autoencoder network is relatively simple, where autoencoder is employed as the basic neural of deep learning network. A typical autoencoder consists of sequentially arranged input layers, hidden layers, and output layers. There exist no connections between nodes in each layer, and all nodes between adjacent layers are connected to each other. The detailed structure of the SAE network is determined by the connection weights. As shown in Figure 1, input and output layers of multiple autoencoders are connected sequentially, and then features of input data can be extracted continuously.
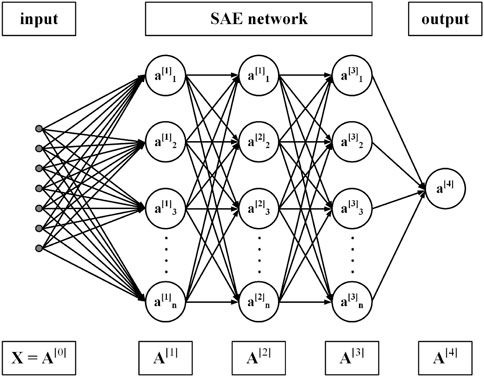
FIGURE 1. Structure of stacked autoencoder network.
2.2 Long short term memory network
Long short term memory network is developed based on Recurrent Neural Network (RNN), and it improve on the long-term information dependence of RNN. LSTM network is adaptive to the long-term characteristics of the data. The cell state of the LSTM cell is controlled using three control gates: The forgetting gate, the memory gate, and the output gate. By adjusting the cell state, the information flowing into the LSTM cell is controlled whether it is retained or passed to the next node, achieving the process of passing important information and omitting secondary information. The entire structure of LSTM network is illustrated in Figure 2.
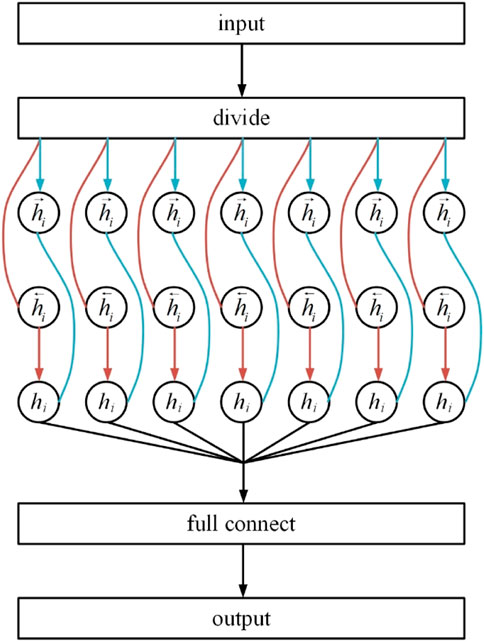
FIGURE 2. Structure of LSTM network.
2.3 Convolutional neural network
Convolutional neural network is a typical complex differentiated deep learning network, which performs well in the classification of datasets. The main components of CNN include convolution and pooling.
As depicted in Figure 3, the process of convolution is to build proper convolution kernels, which conducts convolution step-by-step to the input data sequentially to obtain deeper new data, so that the feature of the data can be extracted. The process of convolution is reflected by the convolutional integral of the input data and the convolution kernels. After the convolution operation, the depth of the data deepens, and their dimensionality becomes larger, resulting in a dataset, that is, difficult to process. The pooling operation involves slicing the features and processing each region separately. The maximum or the average values are often employed to reduce the amount of data in the pooled area, enabling feature enhancement, as show in Figure 4.
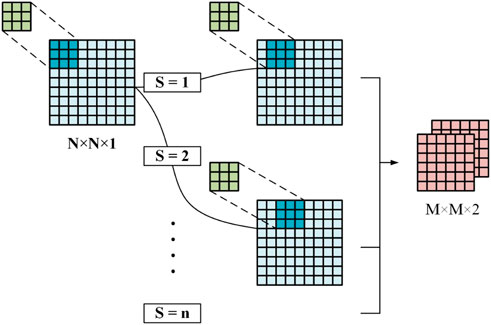
FIGURE 3. Convolutional operation in CNN.
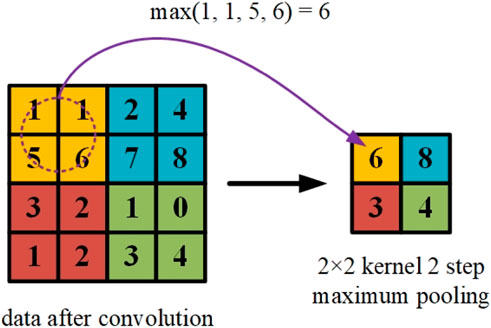
FIGURE 4. Pooling operation in CNN.
Figure 5 illustrates the schematic of convolutional neural network, which is constituted of data slicing, convolutional layer, pooling layer, full connect layer, and output. The convolutional layer uses convolutional kernels to extract data sample features in different dimensions. The pooling layer reduces the computation cost and network complexity in different pooling regions. Finally, full connect layer is used to connect the features in different regions to obtain the pattern of the data.
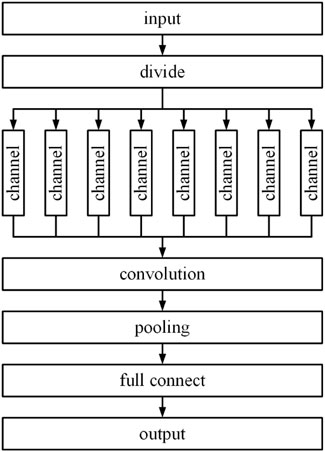
FIGURE 5. Structure of convolutional neural network.
3 Physical model
3.1 Test rig
The dataset used in the present study is collected from experimental measurements. The schematic diagram of the test rig is illustrated in Figure 6, which consists of the performance test component and the signal collection component. The performance test component includes the tested mixed-flow pump, vacuum pump, stainless steel water pipe, servo motor, water tank, ball valve. The signal collection component is composed of synchronization trigger, multi-channel data acquisition card, high-speed camera.
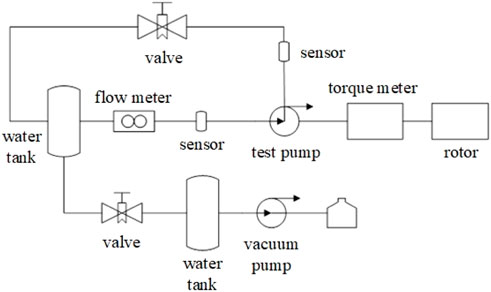
FIGURE 6. Schematic diagram of test rig.
The electromagnetic flowmeter is used in the present experiment to measure the pump flow rate. Two pressure sensors are employed to measure pressures at the inlet and the outlet of the test pump. Three acceleration sensors are applied to measure vibrations of the tested pump. These acceleration sensors are located on the impeller chamber in orthogonal directions. The sampling frequency of the acceleration sensors is set as 2048 Hz.
3.2 Test pump and test conditions
A mixed-flow pump with the specific number
4 Results and discussions
4.1 Data preprocessing
The collected data from the experiment is divided into sub-datasets with different labels, which are them employed as the input of deep learning techniques. In the present study, the cavitation conditions are distinguished according to the amount and morphology of cavitations bubbles. The condition with no bubbles is regarded as normal condition. The condition with limited attached bubbles on blades is regarded as minor cavitation condition. The condition with many bubbles inside impeller passages is regarded as major cavitation condition. All the measured conditions are divided into these three types manually. The physical meaning of each label and corresponding number of data are shown in Table 1. Typical figures by high-speed visualization and corresponding vibration signals of each label are shown in Figures 7–9, where the acceleration is normalized by gravity g. In order to guarantee the accuracy of fault diagnosis, the train test split algorithm is applied here. 65% of the sub-dataset is used as the training dataset, and the rest 35% of the sub-dataset is used as the testing dataset.
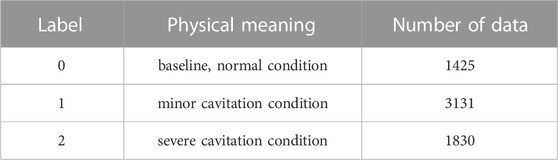
TABLE 1. Physical meaning and number of sub-datasets.
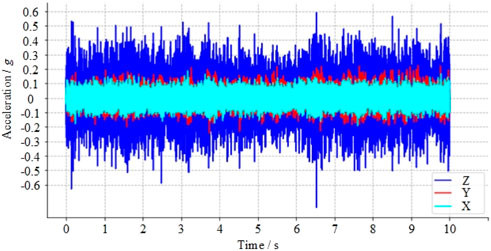
FIGURE 7. Vibration signals s under normal condition.
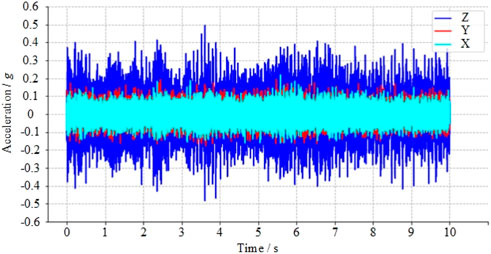
FIGURE 8. Vibration signals under minor cavitation condition.
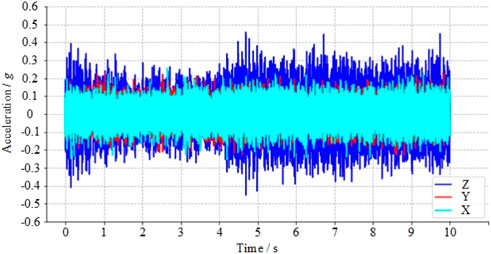
FIGURE 9. Vibration signals under severe cavitation condition.
Due to the complexity of the present experimental data, it is relatively hard to extract data characteristics. In order to enhance characteristics of the present data, the vibration signals in three directions are arranged into two-dimensional datasets. Then, the Fast Fourier Transform (FFT) is employed here to convert signals in time domain to data in frequency domain. After data preprocessing, the deep learning techniques described in Section 2 are employed for fault diagnosis based on PyTorch platform. The cost functional is defined by the sum of relative error between predicted label and actual label for cavitation conditions, which indicates the difference the deviation between the true and predicted results by deep learning techniques. The accuracy is defined by the ratio of the number of correctly classified samples by the total number of samples in dataset. When the cavitation predictions from deep learning techniques agree with the actual results, it is reasonable to determine whether severe cavitation has occurred under a particular operating condition based on the predictions. Figure 10 illustrates the flow chart of entire process from data collection to fault diagnosis, and the key parts of deep learning techniques are discussed in detail as follows.
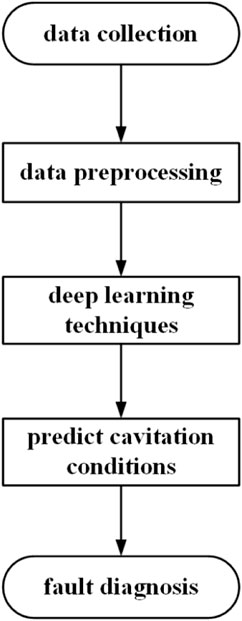
FIGURE 10. Flow chart of fault diagnosis.
4.2 Stacked autoencoder network
The stacked autoencoder network of totally seven layers is established in the present study. The input and output parameters for each layer are listed in Table 2. The training parameters for SAE network are as follows: epoch = 2048, learning rate = 0.01, and batch size = 128.
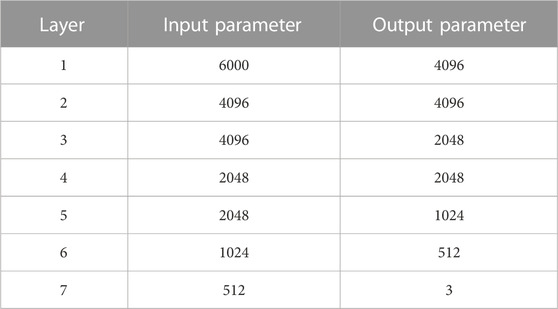
TABLE 2. SAE network parameters.
Figures 11,12 show the cost function and diagnosis accuracy for SAE network. The accuracy of training data by SAE network is within the range of 89.6% and 90.4%, and the average accuracy is 90.1%. The average accuracy of testing data is 47.6%, which is not available for practical use.
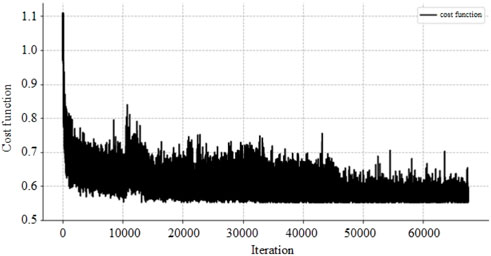
FIGURE 11. Cost function of SAE network.
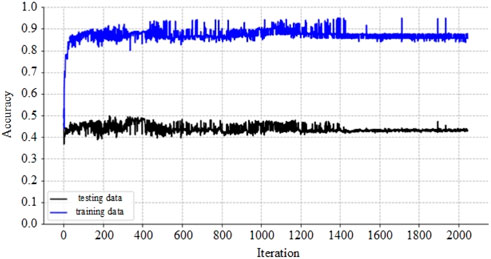
FIGURE 12. Accuracy of SAE network.
According to Figure 12, there exist significant difference between the accuracy of training data and testing data, which may result from overfitting during training. Therefore, the dropout algorithm is employed to simplify the network and the parameters are listed in Table 3. The dropout algorithm is a commonly-used regularization algorithm in deep learning, and is also introduced to the present study. When applying dropout algorithm, some neural are dropped randomly during training process. Sub-networks are generated in this way. When each layer of the neural network has n nodes, then P*2n sub-neural networks can be generated by dropout (where P is the loss rate), and the final network obtained is the average of the sub-neural networks, which reduces the sensitivity of the network to data noise and reduces overfitting. The value of loss rate is set as 0.9 in the present study.
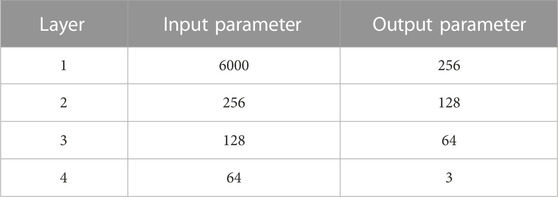
TABLE 3. SAE-dropout network parameters.
Figures 13,14 show the cost function and diagnosis accuracy for SAE-dropout network. The diagnosis accuracy is improved after introducing dropout algorithm, while there appears oscillations of accuracy during iterations. The accuracy of training data by SAE network is within the range of 88.4% and 96.7%, and the average accuracy is 92.3%. The average accuracy of testing data is 47.7%, which is still not available for practical use. The application of SAE network indicates that, the relatively simple structure of SAE network is not suitable for fault diagnosis of pumps under cavitation conditions.
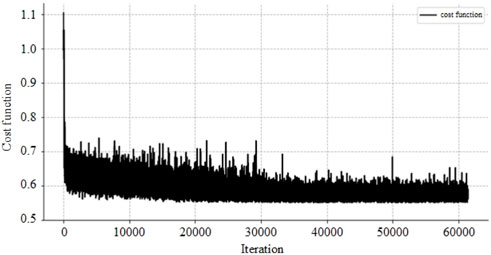
FIGURE 13. Cost function of SAE-dropout network.
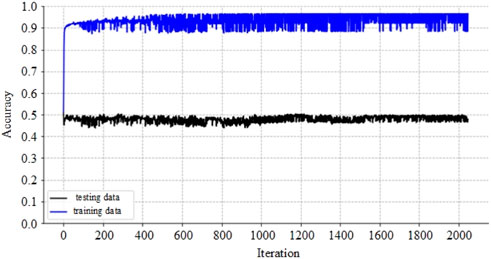
FIGURE 14. Accuracy of SAE-dropout network.
4.3 Long short term memory network
As shown in previous section, the dropout algorithm is effective in reducing overfitting, and hence it is also employed in LSTM network. The parameters for LSTM network are listed in Table 4. The training parameters of LSTM network are set as follows: epoch = 64, learning rate = 0.01, batch size = 128.
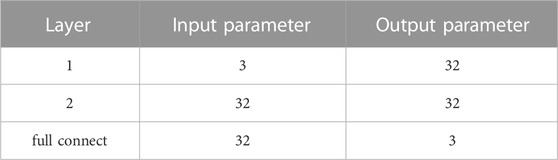
TABLE 4. LSTM network parameters.
Figures 15,16 show the cost function and diagnosis accuracy for LSTM-dropout network. The decreasing trend of the loss function of LSTM-dropout is not obvious. Along with the increasing of training, the loss function oscillates, indicating that the forgetting characteristics of the network and the features of the input data are poorly matched. The accuracy of training data by LSTM-dropout network is within the range of 48.1% and 48.2%, and the average accuracy is 48.1%. The average accuracy of testing data is 47.5%. The diagnosis accuracy on both training and testing datasets are lower than 50%, which means it is not available for practical use. In addition, the training results reflect no overfitting of the network, as the input data is a random filtering of the vibration signals, resulting in a chaotic order that breaks the repetitive pattern of the signals.
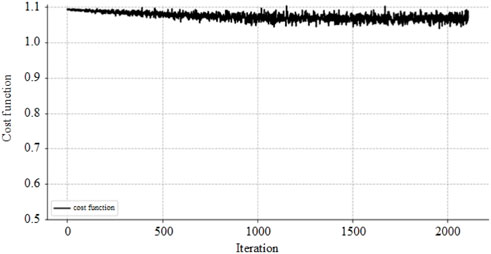
FIGURE 15. Cost function of LSTM-dropout network.
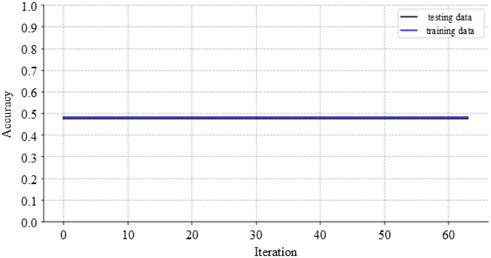
FIGURE 16. Accuracy of LSTM dropout network.
In order to overcome the mismatch between the input data and the network characteristics, the signals in frequency domain by FFT is employed as the input. The network parameters and training parameters of FFT-LSTM-dropout network remain the same as LSTM-dropout network. Figures 17, 18 show the cost function and diagnosis accuracy for FFT-LSTM-dropout network. The accuracy of training data by FFT-LSTM-dropout network is within the range of 48.0% and 48.3%, and the average accuracy is 48.2%. The average accuracy of testing data is 47.6%. There appears slightly improvement on diagnosis accuracy compared with LSTM-dropout network, while it is still too low for practical application.
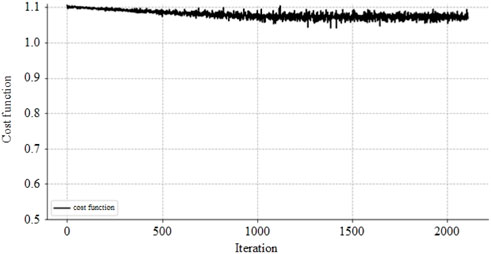
FIGURE 17. Cost function of FFT-LSTM-dropout network.
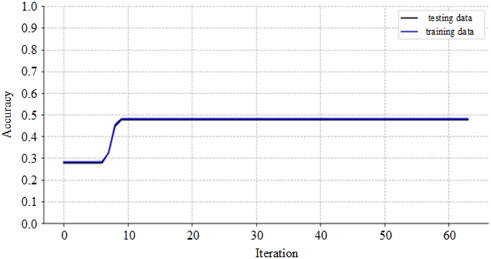
FIGURE 18. Accuracy of FFT-LSTM-dropout network.
4.4 Convolutional neural network
The convolutional neural network combined with dropout algorithm is built here. The network parameters of the four convolutional layer and two full connect layer are listed in Table 5. The training parameters are set as follows: epoch = 2048, learning rate = 0.01, batch size = 128, loss rate = 0.8.
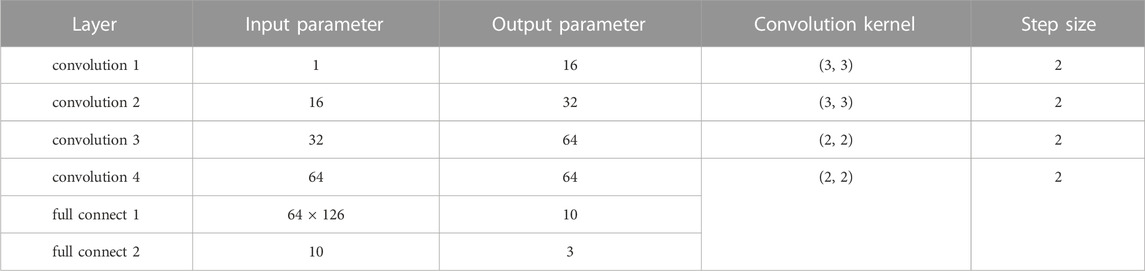
TABLE 5. CNN-dropout network parameters.
Figures 19, 20 show the cost function and diagnosis accuracy for CNN-dropout network. The loss function of the CNN dropout network represents a downward trend, accompanied by a certain range of oscillations. Comparing the training accuracy with the test accuracy reveals that the structure of the network can be enhanced to extract characteristics more efficiently. The accuracy of training data by CNN-dropout network is within the range of 68.0% and 69.2%, and the average accuracy is 68.7%. The average accuracy of testing data is 68.1%. Compared with previous models based on SAE and LSTM network, the diagnosis accuracy based on CNN on testing datasets is greatly improved, which indicates the potentials of CNN in the application to fault diagnosis of mixed-flow pumps under cavitation conditions.
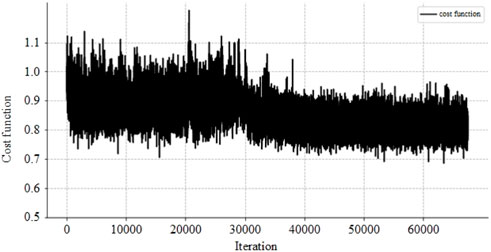
FIGURE 19. Cost function of CNN-dropout network.
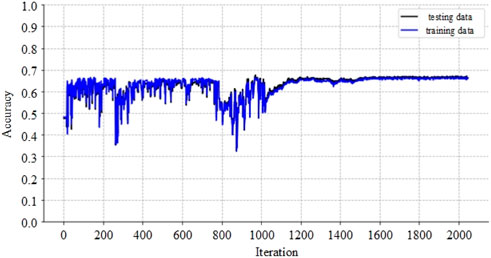
FIGURE 20. Accuracy of CNN-dropout network.
Then, the vibration signals in frequency domain by FFT is employed as the input data of CNN here. The value of learning rate is slightly reduced to be 0.008 to reduce disturbance from noise, and the other network and training parameters remain the same. Figures 21, 22 show the cost function and diagnosis accuracy for FFT-CNN-dropout network. As indicated in Figure 21, the loss function of the FFT-CNN-dropout network decreases, and the variations of training and test accuracy become smoother. The accuracy of training data by FFT-CNN-dropout network is within the range of 91.4% and 92.8%, and the average accuracy is 92.6%. The average accuracy of testing data is 85.6%. The results show that the diagnosis accuracy on both training and testing datasets has been further improved to be higher than 85%, which is basically effective for fault diagnosis of mixed-flow pumps under cavitation conditions.
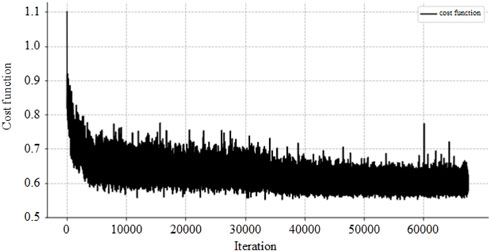
FIGURE 21. Cost function of FFT-CNN-dropout network.
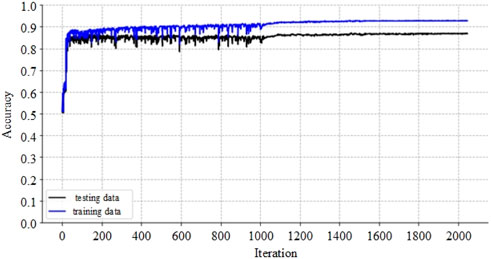
FIGURE 22. Accuracy of FFT-CNN-dropout network.
4.5 Summary and comparison
By comparing diagnosis accuracies based on various deep learning techniques, CNN shows the best performance, and using signals in frequency domain by FFT is effective in improving diagnosis accuracy. Then, FFT-CNN-dropout network is further improved in this section. The techniques of batch normalization (BN) and maximum pooling (MPL) are employed. BN is used to simplify the convolution operation, and MPL is used to extract data characteristics. The network parameters of FFT-CNN-MPL are listed in Table 6. The training parameters are set as follows: epoch = 2048, learning rate = 0.006, batch size = 0.006, loss rate = 0.9.
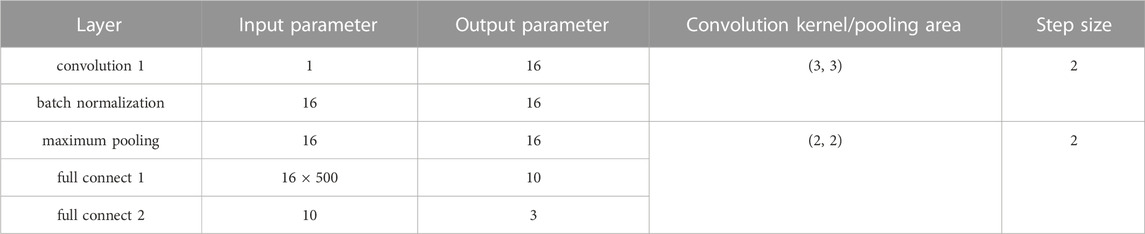
TABLE 6. FFT-CNN-MPL network parameters.
Figures 23, 24 show the cost function and diagnosis accuracy for FFT-CNN-MPL network. The accuracy of training data by FFT-CNN-MPL network is within the range of 96.4% and 96.5%, and the average accuracy is 96.5%. The average accuracy of testing data is 87.2%. Compared with previous FFT-CNN-dropout network, the diagnosis accuracy on both training and testing datasets has been improved. In addition, since the structure of the network is simplified, the computational cost has also been reduced.
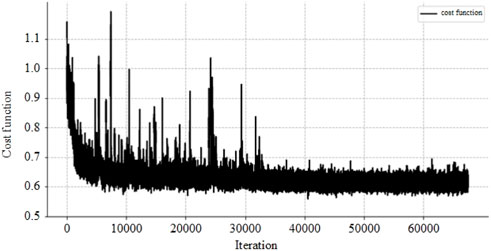
FIGURE 23. Cost function of FFT-CNN-MPL-dropout network.
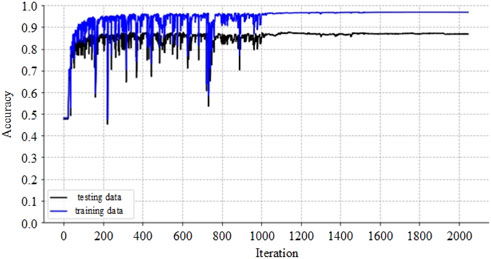
FIGURE 24. Accuracy of FFT-CNN-MPL-dropout network.
So far, totally seven deep learning networks have been built for fault diagnosis of mixed-flow pumps under cavitation conditions. Their accuracies are summarized in Table 7. SAE network is based on layer-by-layer characteristic extraction, while it is not suitable for fault diagnosis of mixed-flow pumps under cavitation conditions. The characteristics of input data in time domain can be extracted by means of LSTM network, but the application of FFT algorithm plays an insignificant effect. One possible reason is that the random algorithm used in data processing is negative for memorability, and the FFT algorithm that converts the time domain signal to the frequency domain signal breaks the repetitive feature. CNN algorithm is originally applied to computational vision-related fields, and its convolutional characteristics make CNN has good adaptability in dealing with signal-related problems. It is verified that CNN is also adaptive to fault diagnosis in the present research. The diagnosis accuracy can be further improved when using data in frequency domain as the input, which agrees with conclusions from previous studies that FFT facilitates convolution (Fu et al., 2020) (Rahimi et al., 2020) (Ding et al., 2021).
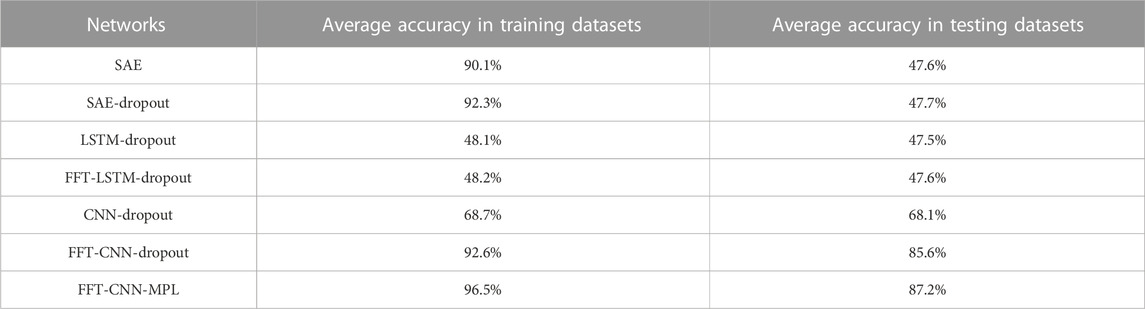
TABLE 7. Comparison among different networks.
5 Conclusion
In the present study, various deep learning techniques are employed for fault diagnosis of a mixed-flow pump under cavitation conditions, including SAE, LSTM, and CNN networks. Experimental measurements are conducted to record vibration signals, which is used as input datasets for deep learning. Cavitation bubbles inside impeller passages are visualized by high-speed photography, and operation status of the pump is clarified into normal, minor cavitation, and severe cavitation conditions according to bubble density. The techniques of FFT algorithm and dropout algorithm are also applied in the present study.
Totally seven types of deep learning networks are built. The average diagnosis accuracy in testing datasets based on SAE and LSTM networks are lower than 50% which is not of practical value. By comparison, the average diagnosis accuracy in testing datasets based on CNN networks are higher than 65%. The maximum diagnosis accuracy of 87.2% can be achieved by a combination of CNN, BN, MLP, and using frequency domain data by FFT as inputs.
Data availability statement
The original contributions presented in the study are included in the article/supplementary material, further inquiries can be directed to the corresponding author.
Author contributions
HF, contributed to conception and design of the study. JW organized the database. YT performed the statistical analysis and wrote the first draft of the manuscript. GW and YQ wrote sections of the manuscript. All authors contributed to manuscript revision, read, and approved the submitted version.
Funding
This article is contributed by funding from National Natural Science Foundation of China (NSFC) (Grant no: 51879140), State Key Laboratory of Hydroscience and Hydraulic Engineering (Grant no. 2021-KY-04), Tsinghua-Foshan Innovation Special Fund (TFISF) 2021THFS0209, and Creative Seed Fund of Shanxi Research Institute for Clean Energy, Tsinghua University.
Conflict of interest
YT was employed by the Jiangxi Port and Waterway Construction Investment Group Co., Ltd.
GW was employed by the China Water Resources Pearl River Planning Surveying and Designing Co., Ltd.
The remaining authors declare that the research was conducted in the absence of any commercial or financial relationships that could be construed as a potential conflict of interest.
Publisher’s note
All claims expressed in this article are solely those of the authors and do not necessarily represent those of their affiliated organizations, or those of the publisher, the editors and the reviewers. Any product that may be evaluated in this article, or claim that may be made by its manufacturer, is not guaranteed or endorsed by the publisher.
References
Alzubaidi, L., Zhang, J., Humaidi, A. J., Al-Dujaili, A., Duan, Y., Al-Shamma, O., et al. (2021). Review of deep learning: Concepts, CNN architectures, challenges, applications, future directions. Journal of Big Data 8, 53. doi:10.1186/s40537-021-00444-8
Chen, H., Jiang, B., Ding, S. X., and Huang, B. (2022). Data-driven fault diagnosis for traction Systems in high-speed trains: A survey, challenges, and perspectives. IEEE Transactions on Intelligent Transportation Systems 23 (3), 1700–1716. doi:10.1109/tits.2020.3029946
Ding, C., Wang, Z., Ding, Q., and Nie, T. (2021). Comparison and analysis of the influence of different data transformation methods on the fault identification of flexible DC transmission lines by convolutional neural network. Mathematical Problems in Engineering 2021, 1759866–17. doi:10.1155/2021/1759866
Fu, C., Lv, Q., and Lin, H. C. (2020). Development of deep convolutional neural network with adaptive batch normalization algorithm for bearing fault diagnosis. Shock and Vibration 2020, 8837958–10. doi:10.1155/2020/8837958
Gao, Q., Tang, H. S., Xiang, J. W., and Zhong, Y. (2018). A multi-sensor fault detection strategy for axial piston pump using the Walsh transform method. International Journal of Distributed Sensor Networks 14 (4), 155014771877253. doi:10.1177/1550147718772531
Gao, Y., and Zhang, Q. (2006). A wavelet packet and residual analysis based method for hydraulic pump health diagnosis. Proceedings of the Institution of Mechanical Engineers, Part D Journal of Automobile Engineering 220 (6), 735–745. doi:10.1243/09544070jauto253
Han, Z. (2019). Fault diagnosis of gear pump based on Sparse representation. IOP Conference Series: Materials Science and Engineering 563, 032003. doi:10.1088/1757-899x/563/3/032003
Hou, Y., Li, Q., Zhang, C., Lu, G., Ye, Z., Chen, Y., et al. (2021). The state-of-the-art review on applications of intrusive sensing, image processing techniques, and machine learning methods in pavement monitoring and analysis. Engineering 7, 845–856. doi:10.1016/j.eng.2020.07.030
Jia, Y., Xu, M., and Wang, R. (2018). Symbolic important Point perceptually and hidden Markov model based hydraulic pump fault diagnosis method. Sensors 18 (12), 4460. doi:10.3390/s18124460
Lan, Y., Hu, J., Huang, J., Niu, L., Zeng, X., Xiong, X., et al. (2018). Fault diagnosis on slipper abrasion of axial piston pump based on Extreme Learning Machine. Measurement 124, 378–385. doi:10.1016/j.measurement.2018.03.050
Li, H., Deng, J., Yuan, S., Feng, P., and Arachchige, D. D. K. (2021). Monitoring and identifying wind turbine generator bearing faults using deep belief network and EWMA control charts. Frontiers in Energy Research 9, 799039. doi:10.3389/fenrg.2021.799039
Li, Z., Jiang, W., Zhang, S., Sun, Y., and Zhang, S. (2021). A hydraulic pump fault diagnosis method based on the modified ensemble empirical Mode decomposition and wavelet kernel extreme learning machine methods. Sensors 21, 2599. doi:10.3390/s21082599
Liu, X., Yang, X., Shao, F., Liu, W., Zhou, F., and Hu, C. (2021). Composite multi-scale basic scale entropy based on CEEMDAN and its application in hydraulic pump fault diagnosis. IEEE Access 9, 60564. doi:10.1109/access.2021.3074498
Mahmood, A., and Wang, J. L. (2021). Machine learning for high performance organic solar cells: Current scenario and future prospects. Energy & Environmental Science 14, 90–105. doi:10.1039/d0ee02838j
Muralidharan, V., and Sugumaran, V. (2013). Roughset based rule learning and fuzzy classification of wavelet features for fault diagnosis of monoblock centrifugal pump. Measurement 46, 3057–3063. doi:10.1016/j.measurement.2013.06.002
Rahimi, M., Alghassi, A., Ahsan, M., and Haider, J. (2020). Deep learning model for industrial leakage detection using acoustic emission signal. Informatics 7 (4), 49. doi:10.3390/informatics7040049
Sakthivel, N. R., Sugumaran, V., and Babudevasenapati, S. (2010). Vibration based fault diagnosis of monoblock centrifugal pump using decision tree. Expert Systems with Applications 37, 4040–4049. doi:10.1016/j.eswa.2009.10.002
Tang, S., Yuan, S., Zhu, Y., and Li, G. (2020). An integrated deep learning method towards fault diagnosis of hydraulic axial piston pump. Sensors 20 (22), 6576. doi:10.3390/s20226576
Xue, H., Li, Z., Wang, H., and Chen, P. (2014). Intelligent diagnosis method for centrifugal pump system using vibration signal and support vector machine. Shock and Vibration 2014, 407570–14. doi:10.1155/2014/407570
Zhou, W., Li, X., Yi, J., and He, H. (2019). A novel UKF-rbf method based on adaptive noise factor for fault diagnosis in pumping unit. IEEE Transactions on Industrial Informatics 15 (3), 1415–1424. doi:10.1109/tii.2018.2839062
Keywords: fault diagnosis, mixed-flow pump, deep learning, convolution neural network, cavitation condition
Citation: Tan Y, Wu G, Qiu Y, Fan H and Wan J (2023) Fault diagnosis of a mixed-flow pump under cavitation condition based on deep learning techniques. Front. Energy Res. 10:1109214. doi: 10.3389/fenrg.2022.1109214
Received: 27 November 2022; Accepted: 15 December 2022;
Published: 06 January 2023.
Edited by:
Xiaojun Li, Zhejiang Sci-Tech University, ChinaReviewed by:
Tang Xuelin, China Agricultural University, ChinaYuchuan Wang, Northwest A&F University, China
Copyright © 2023 Tan, Wu, Qiu, Fan and Wan. This is an open-access article distributed under the terms of the Creative Commons Attribution License (CC BY). The use, distribution or reproduction in other forums is permitted, provided the original author(s) and the copyright owner(s) are credited and that the original publication in this journal is cited, in accordance with accepted academic practice. No use, distribution or reproduction is permitted which does not comply with these terms.
*Correspondence: Honggang Fan, ZmFuaG9uZ2dhbmdAdHNpbmdodWEub3JnLmNu