 Jinjing Sun
 Shuhan Zhang
 Peiyu Cao
- University of Shanghai for Science and Technology, Shanghai, China
In this study, the effect of different blade shapes on the aerodynamic performance of NACA series airfoils under a wide variety of working conditions at Reynolds number Re = 700,000 was explored. The SST k-ω turbulence model was used for the CFD method to investigate the effect of leading edge erosion on the aerodynamic performance of NACA series airfoils. The results indicated that an optimal thickness range of the blade exists considering the leading edge erosion. If the airfoil was too thin or too thick, the leading edge erosion increased, and the aerodynamic performance was significantly reduced. However, the aerodynamic performance will not decrease greatly when the thickness was moderate, even if the leading edge erosion increased. For the same airfoil, the less the leading edge erosion, the better its aerodynamic performance will be. When the erosion degree (depth) of the leading edge airfoil was small, the variation of the erosion size would significantly affect the aerodynamic performance of the airfoil. When the erosion size of the leading edge increases to a certain extent, the performance of the blade decreases greatly compared with the original cases, but the sensitivity of the erosion blade performance to the change of the leading edge erosion size decreases.
1 Introduction
The burning of fossil fuels has caused considerable greenhouse gas (GHGs) emissions. In 2016, the greenhouse gas emissions attributed to fossil fuels accounted for 73.2% of the 49.4 billion tons of CO2 equivalent greenhouse gas emissions worldwide (Ritchie and Roser, 2017). Greenhouse gas emissions will further increase the greenhouse effect, thus causing climate change disasters [e.g., global warming and extreme weather (Hussain et al., 2020)]. From the global perspective, people are shifting their focus from fossil fuel-based energy sources to cleaner sources [e.g., solar, wind, geothermal and biomass (Eshiemogie et al., 2022)]. Compared with other energy sources (Chien et al., 2021), wind energy is one of the most promising clean energy sources since it is sustainable and cost-effective.
In the actual installation environment, the working position of wind turbines is often arranged in northwest wind resources (e.g., sandstorm and coastal typhoon frequency areas). The above areas are characterized by dust caused by drought (Dong et al., 2019; Wang et al., 2021), hailstones washed away by extreme weather (Mishnaevsky et al., 2021), rain generated by Pacific current on the sea surface, wave corrosion caused by lunar attraction (Elhadi Ibrahim and Medraj, 2019; Doagou-Rad et al., 2020). All these factors will cause irreversible erosion on the leading edge of the wind turbine blade, thus seriously affecting the aerodynamic performance of the blade and resulting in the increase of wind turbine power loss (Wang et al., 2017; Cappugi et al., 2021; Manatbayev et al., 2021).
At present, many scholars worldwide have studied the effect of the generation, development and erosion of the leading edge on the aerodynamic performance of the wind turbine (Khalfallah and Koliub, 2007). investigated the mechanism of dust and accumulation of the wind turbine blades, and examined the effect of the operation cycle of the wind turbine on the surface roughness of the blades. By examining the power performance of the leading edge of a 1.5 MW wind turbine blade to varying degrees of pollution or erosion Vestas (Spruce, 2006) has suggested that high levels of pollution and erosion are capable of reducing annual electricity generation (AEP) by 10%–13% (Keegan et al., 2012; Keegan et al., 2013). established the dynamic model of rain and hail using the display dynamics module in ANSYS and then simulated the hail on the airfoil leading impact process using SPH method. The result has suggested that hailstones and impacts on wind turbine blades are continuous and will cause erosion and deformation on wind turbine blades during long-term operation in rainy conditions (Han et al., 2018). has suggested that the leaf lift and resistance coefficients decrease and increase by 53% and 314%, depending on the severity of the contamination and leading edge erosion conditions, respectively.
There are three major changes in the geometric characteristics of the leading edge erosion of wind airfoil (Sareen et al., 2014). The surface of the wind airfoil is erosion, and when the erosion depth reaches 0.51 mm, a sand hole is generated. The sand hole continues to expand into smaller pits of higher size. When the depth is 2.54 mm, it can be considered as a small pit. The small pit develops into local peeling and becomes delamination, which can be considered as delamination when the depth is 3.81 mm (Li et al., 2017). modified the leading edge of DU 96-W-180 wind airfoil. The leading edge of the erosion airfoil primarily comprises sand holes, small pits, and grooves. When the angle of attack is 10.3°, the lift-drag ratio of erosion airfoil of sand holes and small pits is reduced by nearly 10% compared with the value of smooth airfoil, and the lift-drag ratio of trench erosion airfoil decreases by nearly 60% compared with the value of smooth airfoil (Papi et al., 2020). built a 2-dimensional FFAW3-241 airfoil erosion model to investigate different modeling stratification methods (stratification depth and leaf head cover area), reducing the lift-drag ratio by 57.74% at Re = 1.85*106 with a stratification depth of 5 (Wang et al., 2016). mainly studied the rectangular erosion at the leading edge of S809 airfoil. The erosion depths of the airfoil with erosion thickness of 12%t, 18%t and 25%t reached 1.0%c, 2.0%c, and 3.0%c, respectively, and the corresponding relative reduction values of lift-drag ratio were obtained as 48.08%, 64.56%, and 77.53%, respectively. In this study, the effect of different leading edge erosion degree on the maximum thickness of different blade airfoil performance was investigated based on two leading edge erosion forms using the CFD method, which can guide wind turbine airfoil design and erosion blade performance evaluation.
2 Numerical method
2.1 Erosion model
In this study, the aerodynamic performance of NACA airfoil was primarily explored at different erosion depths (Sapre, 2012). highlighted that the chord depth of erosion is up to 13% of the chord length. For the airfoil, three degree of erosion depth were studied, with h1 of 0.3%c, 0.5%c, and 1%c, and erosion thickness d1 = 2h1 (Gharali and Johnson, 2012). examined the amount of wind turbine blade wear after years of operation and have suggested that the maximum erosion thickness can account for 23% of the maximum airfoil thickness when the entire leading edge of the blade is largely eroded by erosion. In the study by Sareen et al. (2014), as derived from the blade erosion provided by 3 M, the deformation ratio of airfoil suction surface and pressure surface is nearly 1:1.3. Accordingly, for the square erosion setting on the leading edge of airfoil presented in Figure 1B, the erosion depth h2 was 0.3%c, 0.5%c, 1%c, and the erosion thickness d2 = 13%t (t is the maximum thickness of airfoil, the erosion thickness on the suction and pressure surfaces of the airfoil is 1: 1.3).
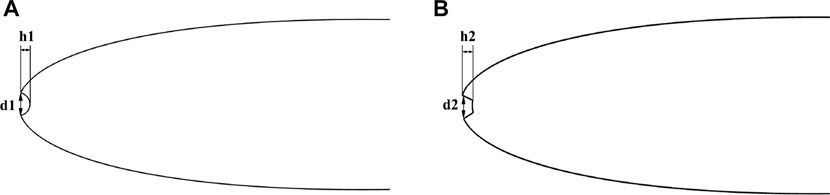
FIGURE 1. Two erosion shape applied on airfoil leading edge. ((A): Semi-circleerosion; (B): Square erosion).
2.2 Computing domain and grid division
The airfoil calculation domain is presented in Figure 3 as an overall C shape, with a semi-circular inlet 15 times the chord length from the leading edge as well as an exit 30 times the chord length from the caudal edge of the blade. The vertical distance of the upper and lower boundaries from the blade was 15 times the chord length. The inlet was set as velocity inlet, and the outlet was set as pressure outlet. As depicted in Figures 2, 3, the calculation domain was filled with structural grid and with the unstructured grid filled in the erosion part. The grid near the airfoil surface was encrypted to conform to the y+< 1 requirements in the turbulence model. Furthermore, the Reynolds number was taken as Re = 700,000.
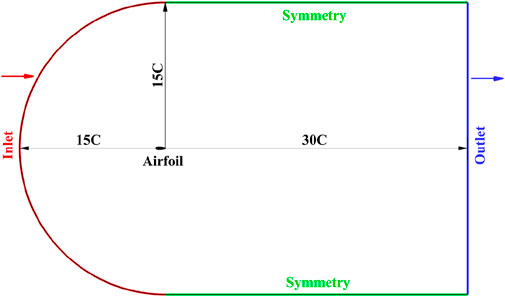
FIGURE 2. Fluid domain of the airfoil.
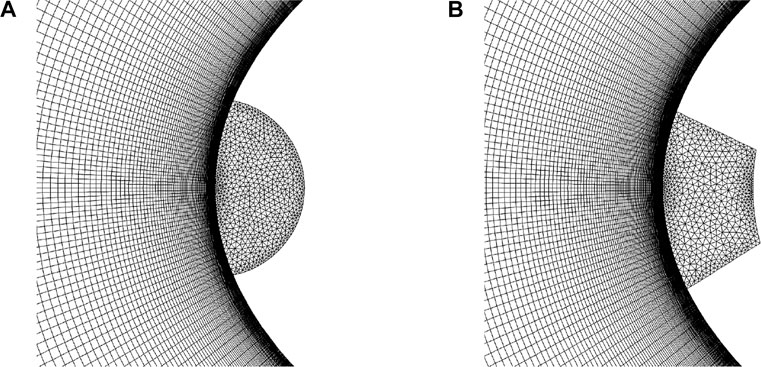
FIGURE 3. Local mesh amplification of the leading edge of the airfoil. ((A): Semi-circle erosion; (B): Square erosion).
2.3 Turbulence model
The selection of turbulence model significantly affects the calculation, verification and evaluation of airfoil performance. For the region close to the wall, the k-ε model with low Reynolds numbers cannot be taken. Thus, the k-ω model was built by combining considerable experimental data and the calculation method of the turbulence model. Moreover, based on Wilcox k-ω, the standard k-ω model was built through optimization calculation. To obtain a result with less error for the calculation near the wall (Menter, 1994), revised the model again after obtaining a large number of experimental data, and also took the transport of turbulent shear stress in the flow field into account. Finally, the SST k-ω model was obtained. With high calculation accuracy, this model has been used in the CFD software frequently. Accordingly, the SST k-ω model was used to simulate the airfoil aerodynamic performance in this study.
2.4 Grid-independent validation and model validation
To ensure the independence of the calculation grid, the number of nodes on the airfoil surface was 201,238 and 286, respectively. Three sets of grids with different number of grids were drawn, and the calculation results are presented in Figure 4. When the number of grids exceeded 270 thousand, the simulation results varied slightly, while 130 thousand and 270 thousand grid amount showed a significant gap in the rising resistance coefficient. Thus, the following conclusion was drawn: 130 thousand mesh was too large for the overall calculation error, so it cannot be used. However, there was little difference in accuracy between 270 thousand and 390 thousand grids. For the consideration of the accuracy of the calculation results and the rationality of the overall computing resource allocation, 270 thousand grids were selected as the grid for simulation calculation in this study.
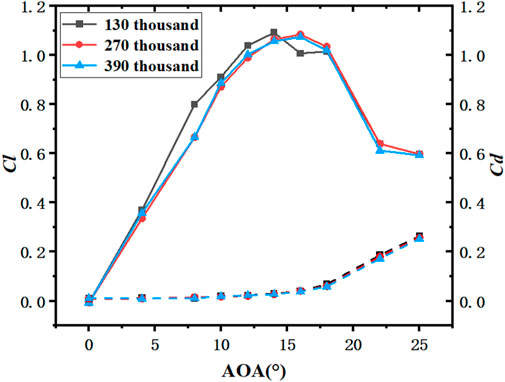
FIGURE 4. Lift-drag coefficient for different mesh quantities of the NACA0021 airfoil.
When the 270 thousand grid amount was used, the maximum lift coefficient was 1.08534, not significantly different from the experimental data (Figure 5), but only 6%. Moreover, close to the maximum lift coefficient and the corresponding angle in existing research (Sun et al., 2020), the data trend of the simulation was smooth without mutation, and it was also close to the current simulation data. In conclusion, the grid setting and numerical calculation method applied to the simulation of low-speed airfoil NACA in wind turbines are reliable, as verified by the data simulation calculation of NACA0021 on the suitable SST k-ω turbulence model, thus laying a good numerical calculation basis for the subsequent simulation experiments to increase the airfoil leading edge erosion and change the maximum thickness of the airfoil.
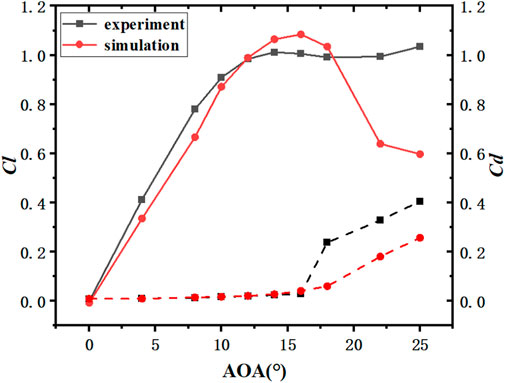
FIGURE 5. Comparing NACA0021 simulation data and experimental data.
3 Results and analysis
3.1 Effect of airfoil thickness on aerodynamic performance of erosion airfoil
In this study, NACA0012, NACA0015, NACA0018 and NACA0021 were selected as the research objects and modified into two erosion forms (semi-circular/square) to explore the effect of airfoil thickness on the aerodynamic performance of erosion airfoil. Two sets of simulations were performed on the respective airfoil, i.e., airfoil with semi-circular erosion (erosion depth ratio of 0.5%c), airfoil with square erosion (erosion depth ratio of 0.5%c) and the original airfoil. The calculation results are presented as follows:
According to the lift-drag coefficients of airfoils with different thickness presented in Figure 6A, Figure 7A, Figure 8A and Figure 9A, the lift coefficient increased first and then decreased after reaching a maximum peak value. Moreover, from 0° to 8° (Figures 10A, B), the lift coefficient of the semicircle erosion airfoil was basically the same as that of the original airfoil. On that basis, the vorticity remained nearly unchanged, and the fitting degree of streamline was basically the same. When it was higher than 8° (Figures 10C, D), the lift coefficient of the original airfoil was significantly higher than that of the erosion airfoil, and the vorticide of the erosion airfoil was significantly higher than that of the original airfoil. However, there was no detachment, the fluid velocity in the upper part of the erosion airfoil was significantly smaller, and the lift coefficient decreased. With the increase of the angle of attack, the lift difference between the erosion airfoil and the original airfoil tended to decrease. The analysis reason is that with the increase of the angle of attack, the flow field environment deteriorated significantly, and the effect of the erosion part of the leading edge on the overall airfoil decreased, such that the difference was reduced. However, the drag coefficient of the erosion airfoil was higher than that of the prototype from 0° to 25°. As depicted in Figure 6B, Figure 7B, Figure 8B and Figure 9B, variation trend of lift-drag ratios of airfoils with different thickness remained nearly unchanged, whereas the maximum lift-drag ratios of the original airfoils of NACA0012 and the erosion airfoils were 8°. The maximum lift-drag ratios of the original airfoil of the remaining three airfoils were 10°, and the maximum lift-drag ratios of the erosion airfoils reached 8°.
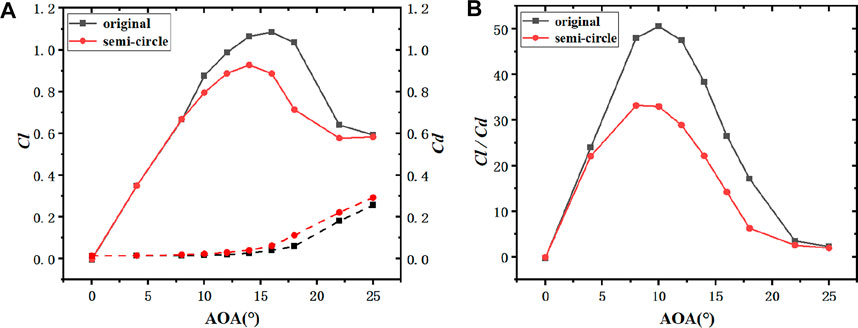
FIGURE 6. NACA0021 aerodynamic characteristic curve comparison diagram of the original airfoil with the leading edge semi-circular erosion airfoil (h1 = 0.5%c). ((A): Lift and drag coefficient; (B): Lift-drag ratio coefficient).
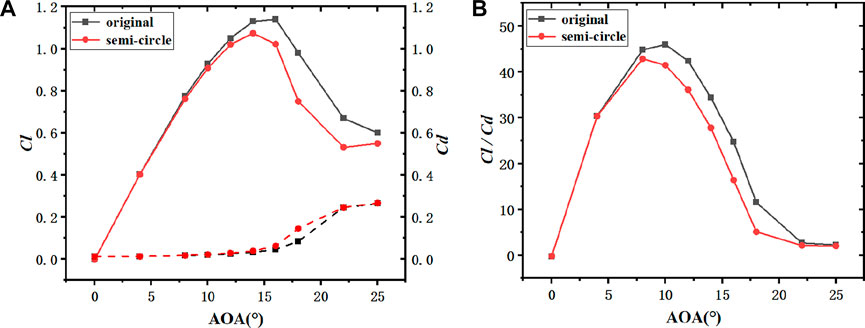
FIGURE 7. NACA0018 aerodynamic characteristic comparison curve of the original airfoil and the leading edge semi-circular erosion airfoil (h1 = 0.5%c). ((A): Lift and drag coefficient; (B): Lift-drag ratio coefficient).
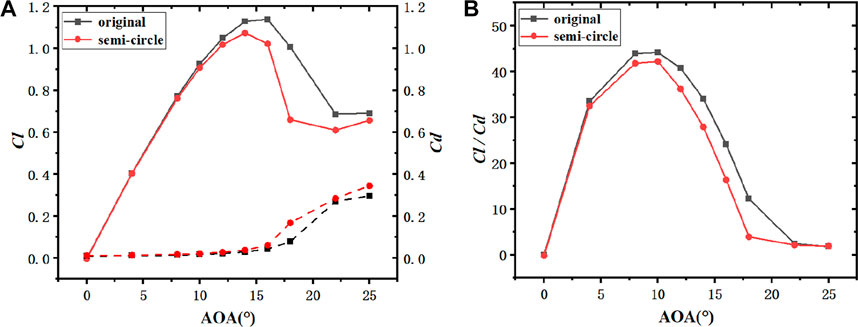
FIGURE 8. NACA0015 aerodynamic characteristic comparison curve of the original airfoil and the leading edge semi-circular erosion airfoil (h1 = 0.5%c). ((A): Lift and drag coefficient; (B): Lift-drag ratio coefficient).
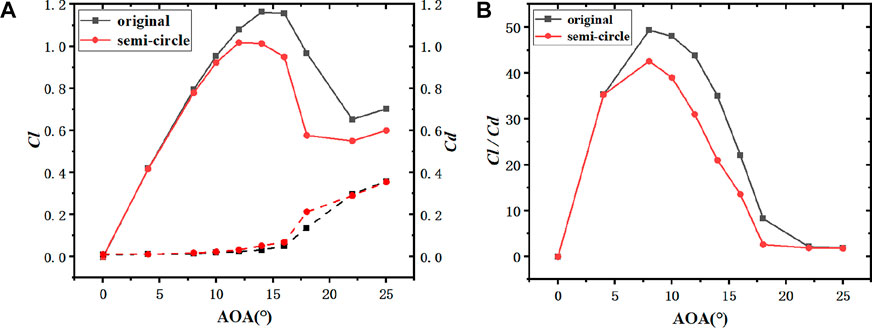
FIGURE 9. NACA0012 aerodynamic characteristic comparison curve of the original airfoil with the leading edge semi-circular erosion airfoil (h1 = 0.5%c). ((A): Lift and drag coefficient; (B): Lift-drag ratio coefficient).
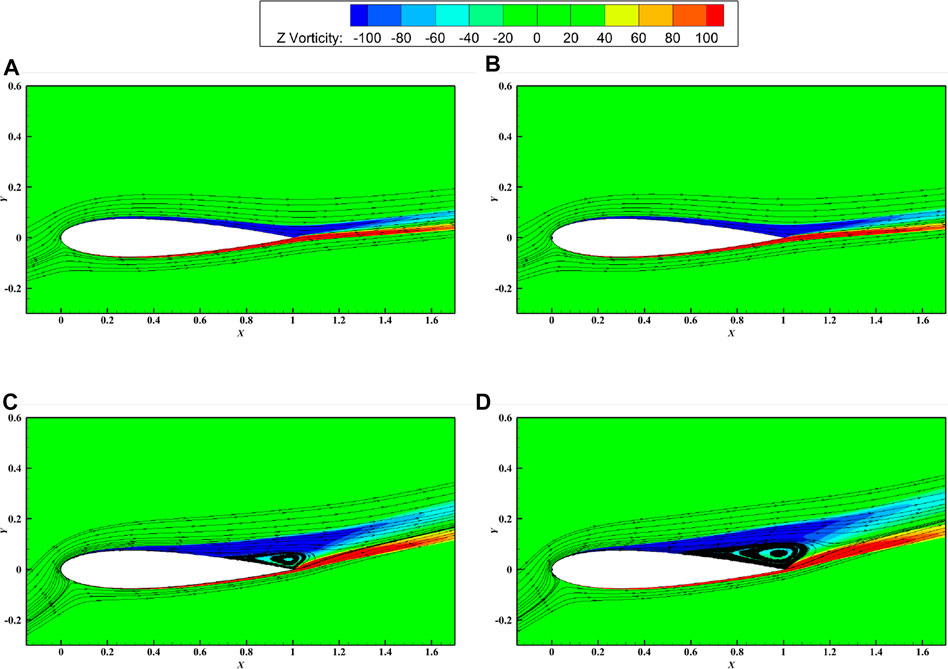
FIGURE 10. Schematic diagram of the surface streamline and vorticity of the NACA0015 original and semi-circular leading edge erosion airfoil (h1 = 0.5%c). ((A): Original airfoil (i = 8°); (B): Semi-circular erosion airfoil (i = 8°); (C): Original airfoil (i = 16°); (D): Semicircular erosion airfoil (i = 16°).
As depicted in Figure 11A, the difference of lift-drag ratio between the original airfoil and the erosion airfoil of NACA0021 was the most significant among the four thicknesses, and the absolute difference of lift-drag ratio reached 18.6 at 12° angle of attack. However, as depicted in Figure 11B, the relative difference of lift-drag ratio of NACA0021 at 12° angle of attack was only 0.39, whereas the maximum decrease was 63.1% at 18° angle of attack. Moreover, as depicted in Figure 12, at 12°angle of attack, the size of vortex for the original airfoil near blade trailing edge did not change significantly compared to the erosion airfoil. However, at 18° angle of attack, the size of vortex for the semi-circular erosion airfoil is significantly increased compared to the original airfoil. (
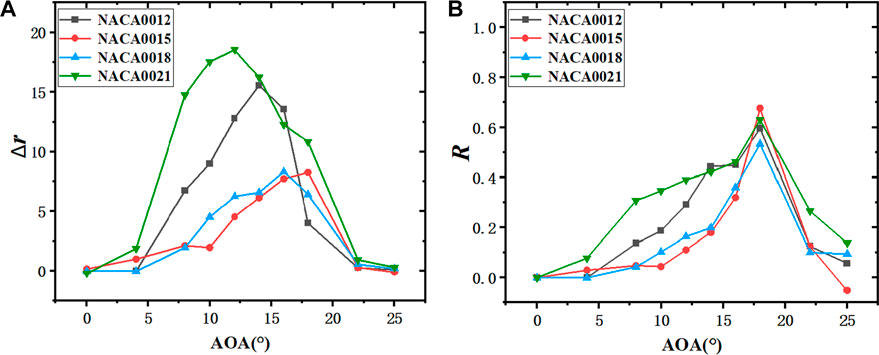
FIGURE 11. Difference of lift-drag ratio between original airfoil with different thickness and semi-circular leading edge erosion airfoil (h1 = 0.5%c). ((A): Absolute difference in the lift-drag ratio; (B): Relative difference in the lift-drag ratio).
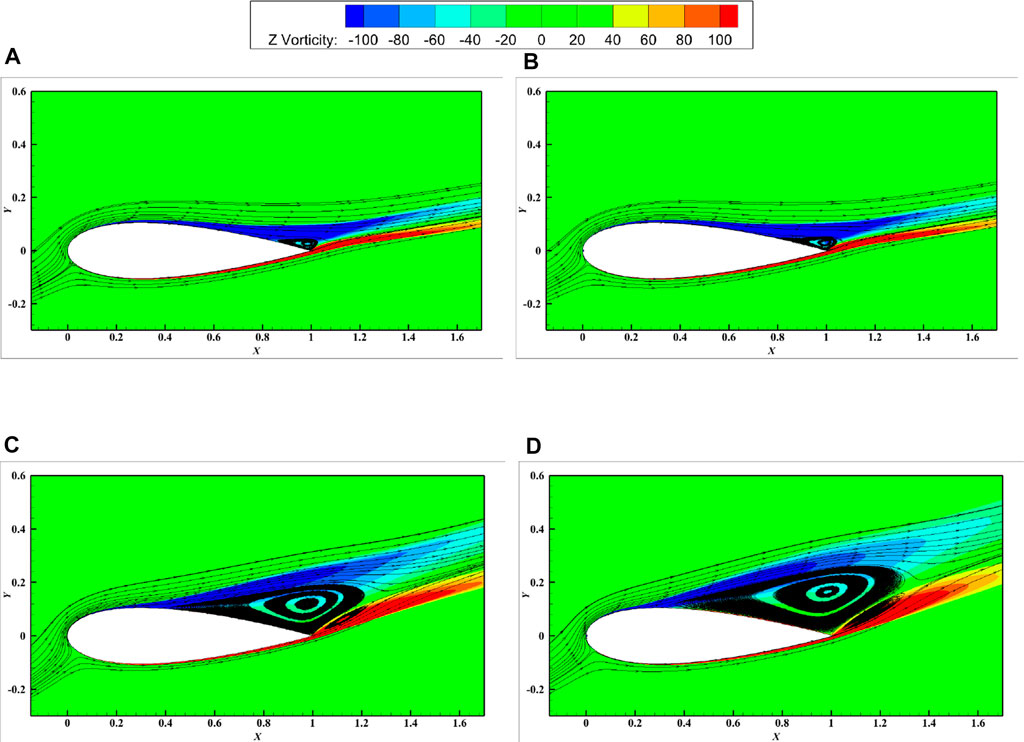
FIGURE 12. Schematic diagram of the surface streamline and vorticity of the NACA0021 primitive and semi-circular leading edge erosion airfoil (h1 = 0.5%c). ((A): Original airfoil (i = 12°); (B): Semi-circular erosion airfoil (i = 12°); (C): Original airfoil (i = 18°); (D): Semi-circular erosion airfoil (i = 18°)).
The second was the NACA0012 airfoil. At 18° angle of attack, as presented in Figure 11, compared with the other three airfoils, it showed the smallest reduction in the lift-drag ratio, whereas the relative reduction in the lift-drag ratio accounted for 59.7%. The vorticity diagram in Figure 13 indicates that the vorticity increased significantly at 18° compared with The original. The overall trend of the whole lift-drag ratio difference curve of NACA0015 and NACA0018 was smaller than that of NACA0012 and NACA0021 airfoils.
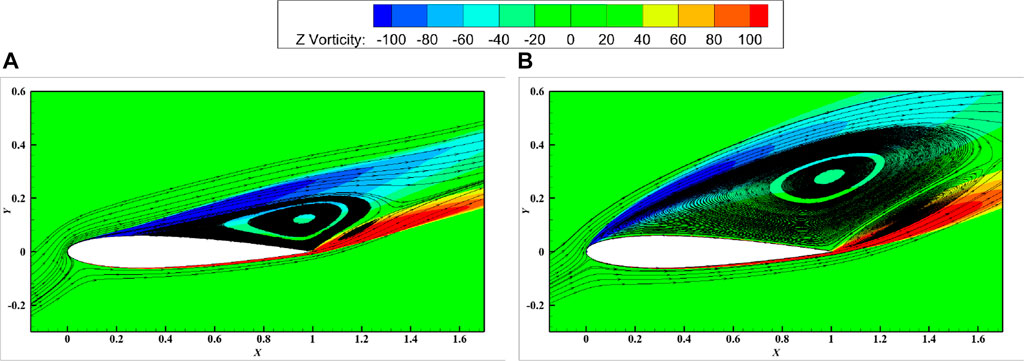
FIGURE 13. Schematic diagram of the surface streamline and vorticity of the NACA0012 original and semi-circular leading edge erosion airfoil (h1 = 0.5%c). ((A): Original airfoil (i = 18°); (B): Semi-circular erosion airfoil (i = 18°)).
In addition, as depicted in Figure 11, the difference of lift-drag ratio of the four blade thicknesses was relatively small at 0° and 25° angles of attack, and the leading edge erosion slightly affected the aerodynamic performance of airfoils with 0° angles of attack and angles of attack greater than 25° (including 25°). At the 0° angle of attack, the flow was not separated, there was basically no lift, and the leading edge erosion geometry was also symmetric on the suction and pressure surfaces, such that the effect was small. However, at 25° angle of attack, the flow separation developed from the trailing edge to the leading edge of the airfoil, and the lift to drag ratio of the original airfoil was relatively small at this time. Besides, the effect of the deterioration of aerodynamic performance caused by the erosion of the leading edge was small.
For the leading edge erosion airfoil with square erosion pattern, as depicted in Figure 14A, Figure 15A and Figure 16A, at the angle of attack from 0° to 8°, the lift coefficient values of the original airfoil and the leading edge square erosion airfoil remained nearly unchanged, thus indicating that there was little difference between the flow on the suction surface and pressure surface of the leading edge square erosion airfoil and the original airfoil at this time. At the lift coefficient higher than 8°, the lift coefficient of the original airfoil was significantly higher than that of the leading edge square airfoil. Moreover, the angle of attack when the maximum lift coefficient of the square erosion airfoil moved forward from the original 16°–12° of the square erosion airfoil of the leading edge.
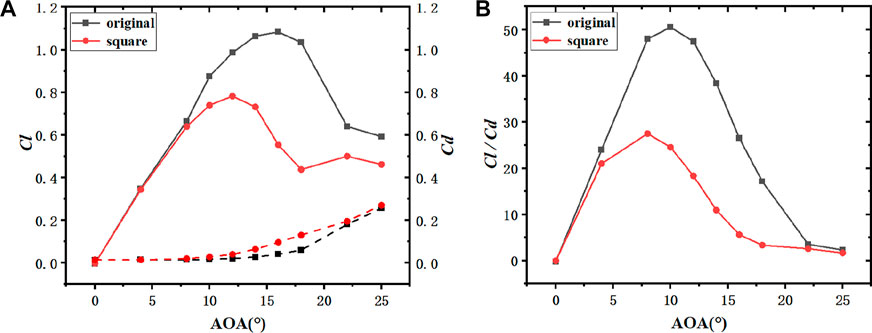
FIGURE 14. Comparison of aerodynamic characteristic curves between the original airfoil of NACA0021 and the square erosion airfoil with leading edge (h2 = 0.5%c). ((A): Lift and drag coefficient; (B): Lift-drag ratio coefficient).
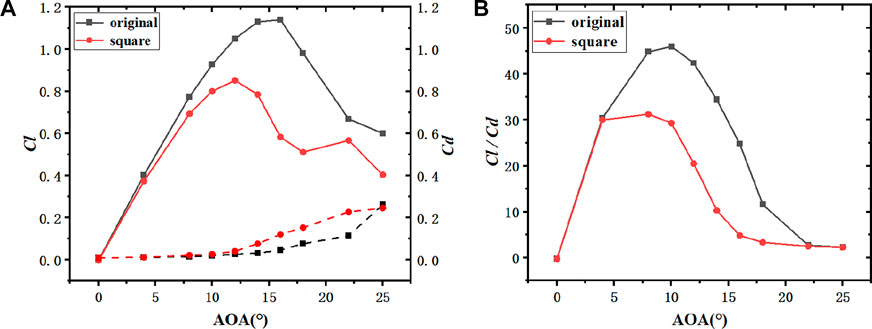
FIGURE 15. Comparison of aerodynamic characteristics between NACA0018 original airfoil and square erosion leading edge airfoil (h2 = 0.5%c). ((A): Lift and drag coefficient; (B): Lift-drag ratio coefficient).
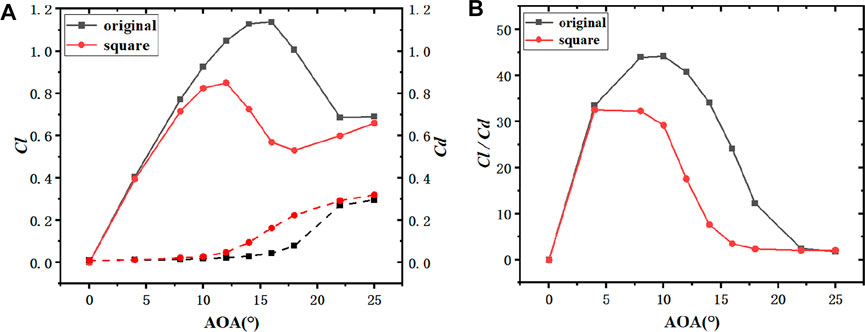
FIGURE 16. Comparison of aerodynamic characteristics between NACA0015 original airfoil and square-erosion leading edge airfoil (h2 = 0.5%c). ((A): Lift and drag coefficient; (B): Lift-drag ratio coefficient).
The resistance curves of the original and square erosion airfoil with different thickness remained nearly unchanged with the exponential curve growth. The drag coefficient curve of the leading edge square airfoil rose slowly before the angle of attack from 0° to 12° and then increased after the angle of attack from 12°. Notably, the drag coefficient value of the leading edge square airfoil was always higher than that of the original airfoil (0°–25° angle of attack).
As depicted in Figure 14B, Figure 15B and Figure 16B, the maximum lift-to-drag ratio of the square erosion airfoil was at 8° angle of attack, nearly 2° forward compared with the 10° angle of attack when the lift-to-drag ratio of the original airfoil reached its maximum. The higher the lift-drag ratio, the better the aerodynamic performance of the airfoil will be. As depicted in the figure, the maximum lift-drag ratio of the original airfoil of NACA0021 was obtained as 50.6, whereas the maximum lift-drag ratio of the square erosion airfoil was 27.6, and the reduction range was the largest among the four thickness blades, up to 45.5%. The maximum difference of lift-drag ratio between the original airfoil and leading edge deformation of NACA0015 and NACA0018 airfoils was smaller than that of NACA0021 airfoils, with a decrease of 33.9% and 33.1%, respectively.
As depicted in Figure 17, the maximum lift-drag ratio curve of NACA0012 square erosion airfoil was obtained at 4° angle of attack, nearly 4° ahead of the 8° angle of attack when the lift-drag ratio of the original airfoil was at its maximum value. In addition, there was a significant difference between the maximum lift-drag ratio of the original airfoil and the square-erosion airfoil. The maximum lift-drag ratio of the original airfoil was 46.7, and the maximum lift-drag ratio of the square-erosion airfoil was obtained as 29.2, marking a decrease of 37.5%.
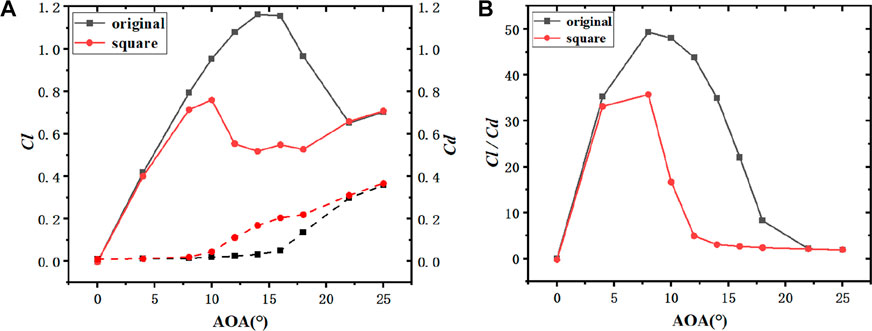
FIGURE 17. Comparison of aerodynamic characteristics between NACA0012 original airfoil and square-erosion leading edge airfoil (h2 = 0.5%c). ((A): Lift and drag coefficient; (B): Lift-drag ratio coefficient).
Figure 18 presents the difference in the lift-drag ratio between the square erosion airfoil with four thicknesses and the original airfoil. The difference in the lift-drag ratio between the original and erosion airfoil of NACA0012 was the largest among the four thicknesses, followed by the NACA0021 airfoil. The absolute difference of lift-drag ratio between NACA0012 airfoil and erosion airfoil was obtained as 39.7, and the relative difference in the lift-drag ratio was 90.5% at 12° angle of attack, and the maximum decrease was 94.2% at 14° angle of attack. The difference of lift-drag ratio between NACA0015 airfoil and NACA0018 airfoil and their erosion airfoils is significantly smaller than that of NACA0012 and NACA0021 airfoils between 0° and 16° angles of attack, and slightly higher than that of NACA0012 and NACA0021 airfoils between 16° and 25° angles of attack.
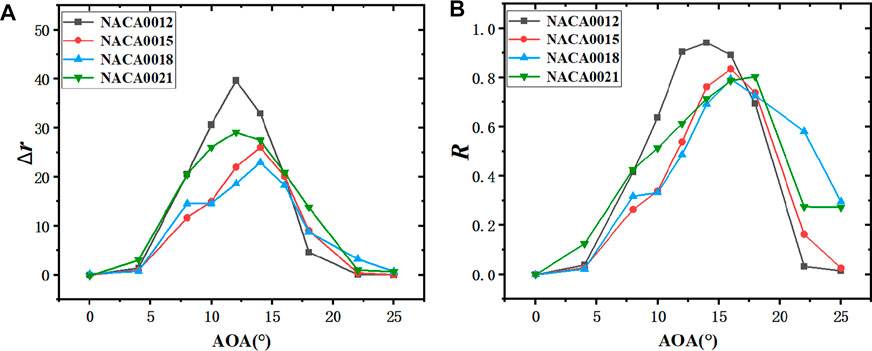
FIGURE 18. Difference of lift-drag ratio between the original airfoil with different thickness and the square leading edge erosion airfoil (h2 = 0.5%c). ((A): Absolute difference in the lift-drag ratio; (B): Relative difference in the lift-drag ratio).
In brief, NACA0012 and NACA0021 were the two airfoils with the largest thickness and the smallest thickness among the four airfoils studied in this study. One of them was thinner, resulting in less differential pressure and less lift; the other was thicker, causing easy separation of the flow, interfering with the flow field, thus resulting in a reduction in the lift coefficient and a rise in the drag coefficient. As a result, the aerodynamic performance will be reduced. NACA0015 and NACA0018 were the two airfoil types with medium thickness among the four blade types.
3.2 Effect of leading erosion on aerodynamic performance of airfoil
In this study, airfoil NACA0015 was selected as the research object to explore the effect of leading edge erosion degree on aerodynamic performance of airfoil. Three groups of simulations were performed to compare the two erosion (semi-circular and square) airfoils, respectively, with the leading edge erosion depth ratios of 0.3%c, 0.5%c, and 1%c.
As depicted in Figure 19A, the overall trend of lift-drag of airfoils with three erosion degrees was to increase at small angles of attack. At the angle of attack close to 12°, the lift-drag was peaked. At the angle of attack close to the large angle of attack, the lift coefficient decreased, whereas the drag coefficient continued to increase. The higher the angle of attack, the more significant the change of Lift-drag coefficient will be. The difference between lift coefficient and drag coefficient of airfoil with three erosion degrees tended to decrease to the same value after 20° angle of attack. As depicted in Figure 20, this is because at high angle of attack, the drag increment caused by the erosion part of the leading edge accounted for a too small proportion for the overall airfoil after large flow separation and slightly affected it when the flow field environment was harsh, such that the coefficients tended to be the same. As depicted in Figure 21, the lift-drag ratio of the erosion airfoil with the leading edge erosion degree of 1% decreased the most in the range of 0°–25° angle of attack, and the lift-drag ratio of the erosion airfoil with the leading edge erosion degree of 0.5% decreased by 26.3% at 8° angle of attack (at the maximum lift-drag ratio of the airfoil). The lift-drag ratio of an airfoil with 0.3% leading edge erosion decreased by only 3.5%. The above results suggest that for the same airfoil, the smaller the leading edge erosion, the better its aerodynamic performance will be.
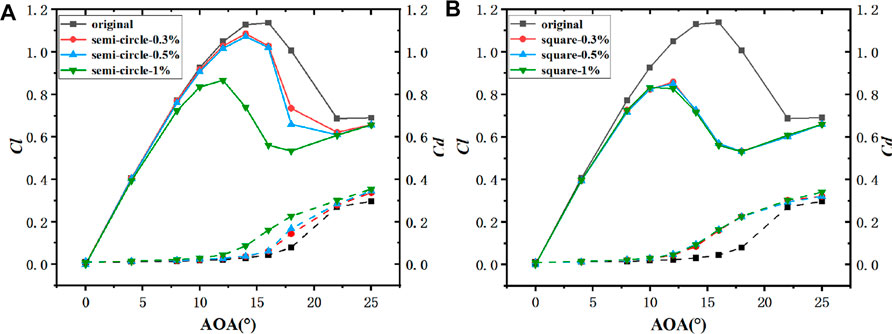
FIGURE 19. Comparison of the Lift and drag coefficient between the original airfoil and the semi-circular/square leading edge erosion airfoil for NACA0015. ((A): Semi-circular erosion airfoil; (B): Square erosion airfoil).
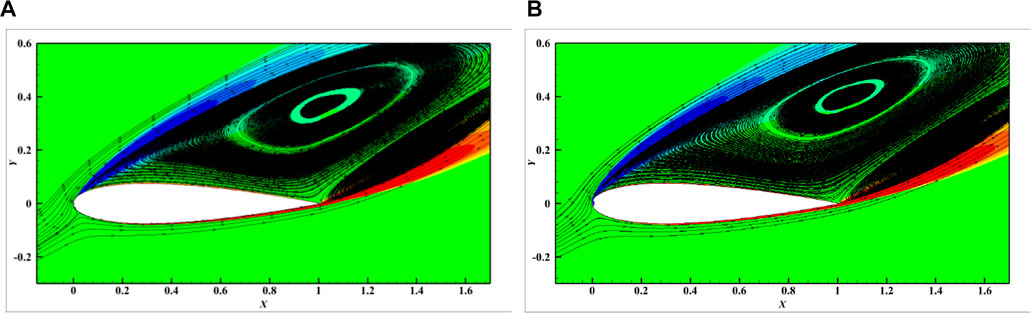
FIGURE 20. Surface streamline and vorticity of the Semi-circular erosion on the leading edge of the NACA0015 airfoil at 22° angle of attack. ((A): h1 = 0.3%c; (B): h1 = 1%c).
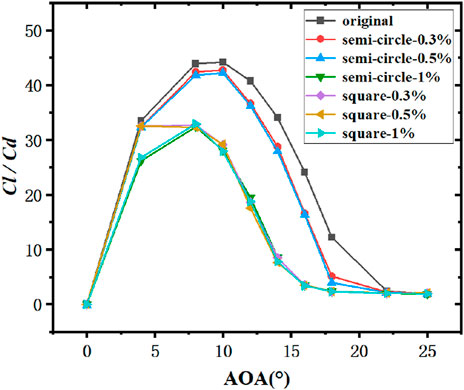
FIGURE 21. Comparison of the lift-drag ratio coefficient between the original airfoil and the semi-circular/square leading edge erosion airfoil for NACA0015.
As depicted in Figure 19B, the aerodynamic performance of the airfoil was reduced significantly when the square erosion of the airfoil leading edge increased. Even if the square erosion of the airfoil leading edge was only 0.3% of the chord length of the airfoil, the lift of the erosion airfoil decreased to 50.3% of the original airfoil, and the drag increased by 263.6% at 16° angle of attack. However, the increase of square erosion degree slightly affected the aerodynamic changes of the airfoil. As depicted in Figure 21, the lift-drag ratio of the square erosion airfoil with leading edge erosion depth of 0.3%c and 0.5%c was slightly higher than that of 1%c when the erosion depth of the square erosion airfoil ranged from 0° to 8°, and the lift-drag ratio of the three erosion degrees of the square airfoil at other attack angles remained nearly unchanged.
3.3 Effect of different leading edge erosion on the aerodynamic performance of the airfoil
To explore the morphology of different leading edge erosion (different depth and thickness), two groups of simulation were performed on the airfoil NACA0015 under the same leading edge erosion depth (h1 = h2) for comparison. The two sets of simulations included the leading edge Semi-circular erosion airfoil d1 = 2h1 (h1 = 0.3%c, 0.5%c, 1%c) and the leading edge square erosion airfoil d2 = 13%t.
As depicted in Figure 21 and Figure 22, when the leading edge erosion shape is semi-circle, the change of airfoil erosion thickness significantly affected the aerodynamic performance of airfoil from 0.3%c to 1%c. For the square leading edge erosion shape, the aerodynamic performance for the eroded airfoil little varied by the erosion depth, but the lift coefficient can be much lower than the semi-circle erosion airfoil at 0.3%c an 0.5%c erosion depth. As depicted in Figures 23A, B, at the erosion depth of 0.3%, the vorticity of the two erosion patterns was significantly different. However, with the increase of the leading edge erosion degree, the difference between the lift drag coefficient of the Semi-circular erosion airfoil and the square erosion airfoil decreased. When the leading edge erosion reached to 1%, the lift drag coefficient curves of the Semi-circular erosion airfoil and the square erosion airfoil were basically the same. Figures 23C,D shows that the vorticity generated by the two erosion airfoil is the same. At this time, the aerodynamic performance of the original NACA0015 airfoil changed to a similar extent by both. The results indicated that the effect of the change of airfoil erosion thickness on airfoil aerodynamic performance decreases, when the leading edge erosion depth reached a certain level.
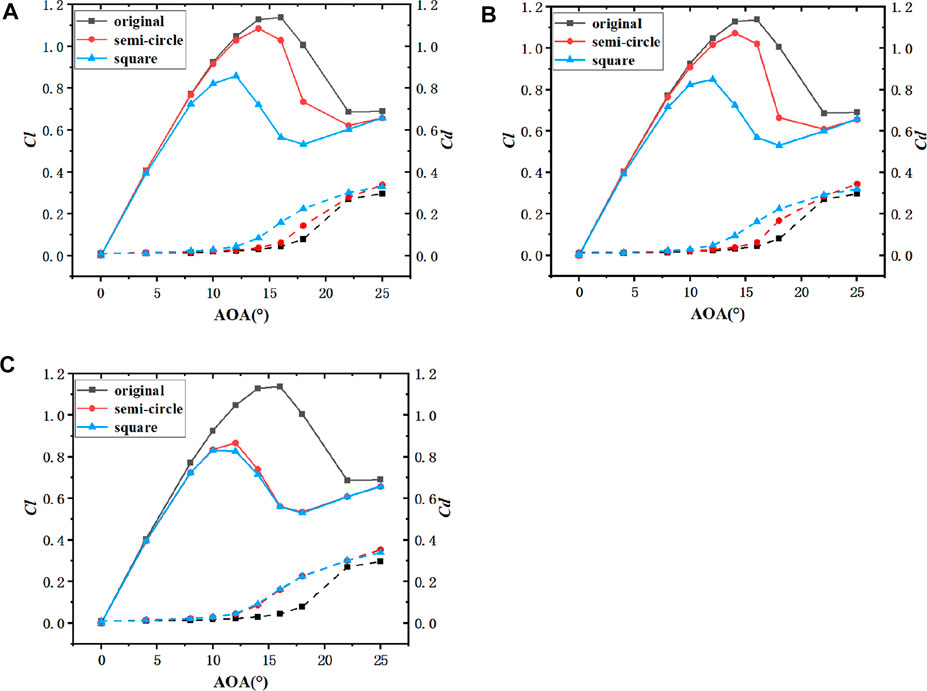
FIGURE 22. Comparison of Lift and drag coefficients of NACA0015 original airfoil with semi-circle and square leading edge erosion airfoil. ((A): h1 = h2 = 0.3%c; (B): h1 = h2 = 0.5%c; (C): h1 = h2 = 1%c).
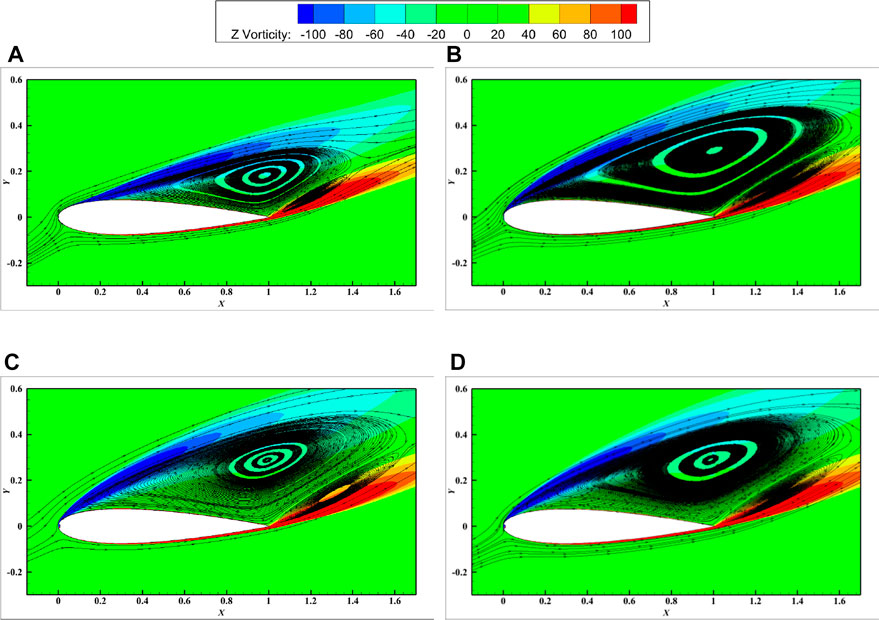
FIGURE 23. Surface streamlines and vorticity of NACA0015 airfoil with different erosion patterns at 18° angle of attack. ((A): Semicircular erosion (h1 = 0.3%c); (B): Square erosion (h2 = 0.3%c); (C): Semi-circular erosion (h1 = 1%c); (D): Square erosion (h2 = 1%c)).
4 Conclusion
In this study, four NACA series airfoils were investigated and the influence of blade maximum thickness on airfoil performance under different leading edge erosion rates were studied by two erosion forms through the CFD method. The main conclusions are drawn as follows:
1) The result indicated that due to the thin or thick airfoil of NACA0012 and NACA0021, the increase of leading edge erosion resulted in a significantly reduced aerodynamic performance compared with the medium thickness airfoil. However, due to the moderate thickness of NACA0015 and NACA0018, the variation range of aerodynamic performance was small even with the increase of the leading edge erosion. Among the four different thickness airfoils, the aerodynamic performance of the NACA0015 and NACA0018 airfoils with increased leading edge erosion was proved to be higher than that of thicker or thinner airfoils.
2) For NACA0015, semi-circular erosion airfoil, at 8° angle of attack (when the lift-drag ratio of airfoil was peaked), the lift-drag ratio of airfoil with the leading edge erosion degree of 1% decreased by 26.3%, followed by the airfoil with 0.5%leading edge erosion, and the lift-drag ratio of airfoil with the leading edge erosion degree of 0.3% decreased by only 3.5%. For square erosion airfoil, the drop of lift-drag ratio of the erosion airfoil with 1% leading edge erosion was also the largest. The above results suggest that for the same airfoil, the smaller the leading edge erosion, the better the aerodynamic performance will be.
3) When the erosion degree (depth) of the leading edge airfoil was small, the varation of the erosion size would significantly affect the aerodynamic performance of the airfoil. When the erosion size of the leading edge increases to a certain extent, the performance of the blade decreases greatly compared with the original cases, but the sensitivity of the erosion blade performance to the change of the leading edge erosion size decreases.
Data availability statement
The original contributions presented in the study are included in the article/supplementary material, further inquiries can be directed to the corresponding author.
Author contributions
JS: Conceptualization, Funding acquisition, Resources Writing—review and editing, Funding acquisition. SZ: Writing—original draft, Visualization. PC: Investigation, Data curation. LQ: Validation, Formal analysis.
Funding
This work was funded by National Natural Science Foundation of China (Grant Nos. 51906156) and Natural Science Foundation of Shanghai (Grant Nos. 22ZR1443500).
Conflict of interest
The authors declare that the research was conducted in the absence of any commercial or financial relationships that could be construed as a potential conflict of interest.
Publisher’s note
All claims expressed in this article are solely those of the authors and do not necessarily represent those of their affiliated organizations, or those of the publisher, the editors and the reviewers. Any product that may be evaluated in this article, or claim that may be made by its manufacturer, is not guaranteed or endorsed by the publisher.
References
Cappugi, L., Castorrini, A., Bonfiglioli, A., Minisci, E., and Campobasso, M. S. (2021). Machine learning-enabled prediction of wind turbine energy yield losses due to general blade leading edge erosion. Energy Convers. Manag. 245, 114567. doi:10.1016/j.enconman.2021.114567
Chien, F. S., Kamran, H. W., Albashar, G., and Iqbal, W. (2021). Dynamic planning, conversion, and management strategy of different renewable energy sources: A sustainable solution for severe energy crises in emerging economies. Int. J. Hydrogen Energy 46 (11), 7745–7758. doi:10.1016/j.ijhydene.2020.12.004
Doagou-Rad, S., Mishnaevsky, L., and Bech, J. I. (2020). Leading edge erosion of wind turbine blades: Multiaxial critical plane fatigue model of coating degradation under random liquid impacts. Wind Energy 23 (8), 1752–1766. doi:10.1002/we.2515
Dong, M., Wang, C., Liu, H., Shen, C., and Zhang, J. (2019). Enhanced solid particle erosion properties of thermoplastic polyurethane-carbon nanotube nanocomposites. Macromol. Mater. Eng. 304 (5), 1900010. doi:10.1002/mame.201900010
Elhadi Ibrahim, M., and Medraj, M. (2019). Water droplet erosion of wind turbine blades: Mechanics, testing, modeling and future perspectives. Materials 13 (1), 157. doi:10.3390/ma13010157
Eshiemogie, S. O., Ighalo, J. O., and Banji, T. I. (2022). Knowledge, perception and awareness of renewable energy by engineering students in Nigeria: A need for the undergraduate engineering program adjustment. Clean. Eng. Technol. 6, 100388. doi:10.1016/j.clet.2021.100388
Gharali, K., and Johnson, D. A. (2012). Numerical modeling of an S809 airfoil under dynamic stall, erosion and high reduced frequencies. Appl. Energy 93, 45–52. doi:10.1016/j.apenergy.2011.04.037
Han, W., Kim, J., and Kim, B. (2018). Effects of contamination and erosion at the leading edge of blade tip airfoils on the annual energy production of wind turbines. Renew. energy 115, 817–823. doi:10.1016/j.renene.2017.09.002
Hussain, M., Butt, A. R., and Uzma, F. (2020). A comprehensive review of climate change impacts, adaptation, and mitigation on environmental and natural calamities in Pakistan[J]. Environ. Monit. Assess. 192 (1), 1–20. doi:10.1007/s10661-019-7956-4
Keegan, M. H., Nash, D., and Stack, M. (2012). Modelling rain drop impact on offshore wind turbine blades[J]. ASME Turbo Expo. 2012, 8–10. doi:10.1115/GT2012-69175
Keegan, M. H., Nash, D., and Stack, M. (2013). Numerical modelling of hailstone impact on the leading edge of a wind turbine blade[J]. EWEA Annu. Wind Energy Event 2013, 5–10.
Khalfallah, M. G., and Koliub, A. M. (2007). Effect of dust on the performance of wind turbines. Desalination 209 (1-3), 209–220. doi:10.1016/j.desal.2007.04.030
Li, D., Wang, C., and Li, Y. (2017). Influence of blade leading edge erosion features on aerodynamic characteristics of wind turbine airfoil[J]. Trans. Chin. Soc. Agric. Eng. 33 (22), 269–275. doi:10.11975/j.issn.1002-6819.2017.22.035
Manatbayev, R., Baizhuma, Z., Bolegenova, S., and Georgiev, A. (2021). Numerical simulations on static Vertical Axis Wind Turbine blade icing. Renew. Energy 170, 997–1007. doi:10.1016/j.renene.2021.02.023
Menter, F. R. (1994). Two-equation eddy-viscosity turbulence models for engineering applications. AIAA J. 32 (8), 1598–1605. doi:10.2514/3.12149
Mishnaevsky, L., Hasager, C. B., Bak, C., Tilg, A. M., Bech, J. I., Doagou Rad, S., et al. (2021). Leading edge erosion of wind turbine blades: Understanding, prevention and protection. Renew. Energy 169, 953–969. doi:10.1016/j.renene.2021.01.044
Papi, F., Ferrara, G., and Bianchini, A. (2020). Practical considerations on wind turbine blade leading edge erosion modelling and its impact on performance and loads[C]//Journal of physics: Conference series. IOP Publ. 1618 (5), 052005. doi:10.1088/1742-6596/1618/5/052005
Ritchie, H., and Roser, M. (2017). CO₂ and greenhouse gas emissions. UK: Our World in Data. [J]. Cited on, 3.
Sareen, A., Sapre, C. A., and Selig, M. S. (2014). Effects of leading edge erosion on wind turbine blade performance. Wind Energy 17 (10), 1531–1542. doi:10.1002/we.1649
Spruce, C. J. (2006). “Power performance of active stall wind turbines with blade contamination,” in Proceedings of the European Wind Energy Conference, Greece, 27 Feb-2 Mar.
Sun, J., Sun, X., and Huang, D. (2020). Aerodynamics of vertical-axis wind turbine with boundary layer suction – effects of suction momentum. Energy 209, 118446. doi:10.1016/j.energy.2020.118446
Wang, Y., Zheng, X., Hu, R., and Wang, P. (2016). Effects of leading edge defect on the aerodynamic and flow characteristics of an S809 airfoil. PloS one 11 (9), e0163443. doi:10.1371/journal.pone.0163443
Wang, Y., Hu, R., and Zheng, X. (2017). Aerodynamic analysis of an airfoil with leading edge pitting erosion. J. Sol. Energy Eng. 139 (6). doi:10.1115/1.4037380
Keywords: leading edge erosion, wind turbine, airfoil, thickness, aerodynamic performance
Citation: Sun J, Zhang S, Cao P and Qi L (2023) Influence of blade maximum thickness on airfoil performance with varied leading edge erosion rate. Front. Energy Res. 10:1107524. doi: 10.3389/fenrg.2022.1107524
Received: 25 November 2022; Accepted: 13 December 2022;
Published: 04 January 2023.
Edited by:
Yang Yang, Yangzhou University, ChinaReviewed by:
Daoxing Ye, Xihua University, ChinaYibin Li, Lanzhou University of Technology, China
Fei Tian, Jiangsu University, China
Copyright © 2023 Sun, Zhang, Cao and Qi. This is an open-access article distributed under the terms of the Creative Commons Attribution License (CC BY). The use, distribution or reproduction in other forums is permitted, provided the original author(s) and the copyright owner(s) are credited and that the original publication in this journal is cited, in accordance with accepted academic practice. No use, distribution or reproduction is permitted which does not comply with these terms.
*Correspondence: Jinjing Sun, c3VuamluamluZzA5MTZAMTYzLmNvbQ==