 Yuting Lv1
 Fan Yang
94% of researchers rate our articles as excellent or good
Learn more about the work of our research integrity team to safeguard the quality of each article we publish.
Find out more
ORIGINAL RESEARCH article
Front. Energy Res. , 05 January 2023
Sec. Process and Energy Systems Engineering
Volume 10 - 2022 | https://doi.org/10.3389/fenrg.2022.1104248
This article is part of the Research Topic Optimal Design and Efficiency Improvement of Fluid Machinery and Systems View all 18 articles
In order to clarify the non-constant flow characteristics of the impeller and bulb body of the submersible tubular electric pump device, the entire flow rate conduit of the pump device is numerically calculated using the numerical simulation method, focusing on the analysis of the non-constant flow field characteristics of the guide vane body and bulb body and the time–frequency variation law of the pressure pulsation, and the results of the physical model testing confirm the validity of the numerical simulation. The findings demonstrate that the impeller of a submersible tubular electric pump is mostly responsible for the impeller’s inlet pressure pulsation, and the number of impeller blades to the number of peaks and valleys is consistent. Under the high flow rate condition of 1.2 Qd, the pressure fluctuation in the impeller inlet, between the impeller and the guide vane is small, and the main frequency is located at three times the rotational frequency, and the pressure pulsation at the outlet of the guide vane body has no obvious pattern and small amplitude. As the flow rate increases, the peak value of pressure pulsation at each monitoring point in the characteristic section of the pump device gradually decreases. The pressure pulsation peak value varies widely, ranging from 0.058 to 0.15, at each monitoring location of the impeller inlet. The peak value of pressure pulsation at each monitoring point of the impeller outlet fluctuates less due to the change of flow rate. The size and scale of the omega vortex structure in the guide vane body at different moments of the same cycle is small, and the number of vortex structures from the guide vane body inlet to the outlet direction shows a gradual increase in the trend; with a rise in flow rate, there is a tendency for the velocity and deflection angle of the guide vane body outlet and bulb body outlet surface to decrease.
The installation method of submersible tubular electric pump device is horizontal or tilting type, which is mostly applied to river water lifting and urban drainage projects, which mainly has the following characteristics: 1) the inlet and outlet water conduit is straight, the water flow is stable, and the total hydraulic loss of the flow rate conduit is small; 2) compared to the conventional bulb tubular pump, the bulb body volume is smaller, and the device has a high hydraulic efficiency; and 3) the motor of the submersible tubular electric pump device can run in water, which is simple to operate, generates low noise, does not produce high temperature, and has good cavitation performance. In the 1970s, Japan used submersible tubular electric pump devices in the agricultural government Sijue Lujin pumping station and other large pumping station projects. Early 21st century, China began to develop large submersible tubular electric pumping devices and promote the application of large submersible tubular electric pumping devices in 2008 for the first time in China’s Jiangsu Province, Tongyu River North Extension Water Supply Project irrigation River North, Shan Hou Henan pumping station. In good operating condition, the device has an efficiency of up to 79%, changing the status quo of the traditional tubular pumping device’s low efficiency (Xie et al., 2010). Optimizing the relevant parameters of the impeller and guide vane is of great significance to improve the hydraulic performance of the submersible tubular electric pump.
So far, many scholars at home and abroad have carried out some research on the submersible tubular electric pump device. The research methods mainly use CFD technology and model tests (Wang et al., 2019a; Munih et al., 2020; Yang et al., 2022a) to study the internal and external characteristics and pressure pulsation of the pump device. The three-dimensional steady numerical analysis and structural optimization of the flow field in each flow structure (Lu et al., 2018; Arocena et al., 2021; Sun et al., 2021) have achieved fruitful research results. Zhang et al. (2014) investigated the three-dimensional turbulent flow and the pressure fluctuation in a submersible axial-flow pump by adopting the RNG k-ε turbulence model and the SIMPLEC algorithm, with which the pressure pulsation distribution of the impeller inlet and outlet was obtained (Ji et al., 2021). The influence of shaft position on the performance of tubular pump devices was studied by three-dimensional steady and unsteady numerical simulation combined with a model test. The results showed that the hydraulic performance of the two inlet conduits was excellent, and the hydraulic loss was close. In the study by Xiao et al. (2019), two-dimensional (2D) particle image velocimetry (PIV) was applied to test the blood pump under three different conditions, and the results show that under the medium rotation velocity condition, the flow field is stable and the velocity distribution is even (Choi et al., 2008). The variation of turbine performance with blade angle is analyzed by CFD. The results show that the inlet and outlet angles of the runner blade have great influence on turbine performance. In the study by Miyabe et al. (2006), dynamic particle image velocimetry and pressure fluctuation measurement were used to investigate the unstable flow of a mixed-flow pump with a vane diffuser. It is concluded that the key to improving the positive slope of the flow-head curve is to suppress the growth of the vortex at the diffuser inlet.
Due to the pump’s actual operation’s high-velocity rotation, it is very easy for the water flow to produce flow separation, vortex, secondary flow, and other complex flow phenomena (Khalifa et al., 2011). The flow characteristics of the pump device and the flow state of the fluid in the pump have a great influence on its operational reliability and performance stability. Pressure pulsation is one of the main causes of vibration and noise in pump devices, and some scholars have carried out studies on the internal pressure pulsation characteristics of pump devices of different structural forms (Chu et al., 1995; Li et al., 2018; Ji et al., 2020; Yang et al., 2021a). Li et al. (2021) examine the cavitation performance of an LNG submerged pump and the pressure pulsation characteristics during cavitation excitation using CFD analytical technologies. Jin et al. (2019) present an investigation of external flow characteristics and pressure fluctuation of a submersible tubular pumping system by using a combination of numerical simulation and experimental methods. In the work by Shi et al. (2021), CFD is used to compare the difference in pressure pulsation characteristics between a full tubular pump and an axial flow pump. The results show that the pressure pulsation at the inlet of the impeller of the full tubular pump is larger than that of the axial flow pump, while the pressure pulsation of the full tubular pump is smaller than that of the axial flow pump. In the study by Zhang et al. (2015), in order to find a practical way to lower high pressure pulsation levels, a slope volute is explored. The results demonstrate that unique pressure pulsation peaks at fBPF, together with non-linear components, are captured. Results demonstrate that distinct pressure pulsation peaks at fBPF are caught, together with non-linear components. In the study by Al-Obaidi (2020), the influence of different blade numbers on the flow and pressure pulsation in the pump is studied by computational fluid dynamics technology. The impeller blade has a great influence on the pressure, shear stress, magnitude velocity, and axial velocity.
The internal flow of a submersible tubular electric pump device is a complex three-dimensional non-constant turbulent flow, and the water flows through the impeller to obtain energy, so the numerical simulation of the internal flow characteristics of the pump device can help to optimize the pump device structure. This study focuses on the numerical simulation of the internal non-constant flow of the submersible tubular electric pump device at different flow rate conditions by CFD technology, focusing on the time–frequency characteristics of the pressure pulsation in the impeller and guide vane domain to study the internal flow characteristics of the submersible tubular electric pump device, and it elaborates the development law of the pump device’s internal flow characteristics and vortex structure at various points in order to optimize the pump device’s structure and assure the safety of the pumping station.
The submersible tubular electric pump device consists of five parts: straight inlet conduit, impeller, guide vane body, bulb body, and straight outlet conduit. In order to ensure the full development of the water flow into the inlet conduit during the numerical simulation and to be closer to the actual inlet flow field, an inlet extension section was set in front of the straight pipe inlet conduit with a length of 1.0 times the length of the inlet conduit and a height of 1.2 times the height of the inlet conduit; the outlet conduit extension section was set at the outlet of the straight outlet conduit, and its dimensions were set the same as the inlet extension section. Unigraphics NX modeling software was used to model the straight inlet conduit, bulb body, and straight outlet conduit in three dimensions. The complex shape of the blade in the meshing of the rotating equipment may be produced by ANSYS TurboGrid software, so ANSYS TurboGrid was used to provide structured mesh for the impeller domain and guide vane domain. The impeller model is ZM25N, the nominal diameter of the impeller is 300 mm, the rotational velocity is 1,352 r/min, and the impeller nD value is according to the hydraulic performance of the selected ZM25N impeller of the submersible tubular electric pump device and the operating parameters such as the design head and design flow rate of the pump device. The number of impeller blades is 3, the top clearance is 0.20 mm, the number of guide vanes is 5, and the axial distance between the impeller and the guide vanes is 0.25D. The length of the straight inlet conduit is 6.01D, the height of the inlet conduit is 1.72D, and the width of the inlet conduit is 2.21D. The length of the straight outlet conduit is 5.42D, the height of the outlet conduit is 1.72D, and the width of the outlet conduit is 2.21D; the length of the bulb body is 1.67D, the bulb body is supported on the support segment, and the cross-sectional shape of the support is stream-lined; the number of support strucutre is five evenly spaced in the flow conduit, with a length of 0.58D, a width of 0.025D, and an average height of 0.26D. Figure 1 depicts the submersible tubular electric pump device’s primary geometric measurements, and Table 1 presents the pump device’s primary calculation parameters.
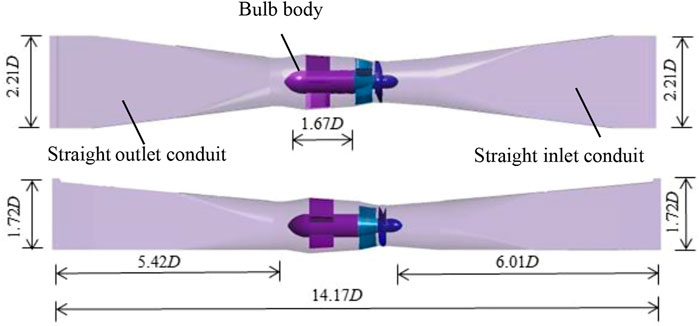
FIGURE 1. Dimensional drawing of the whole submersible tubular electric pump device.
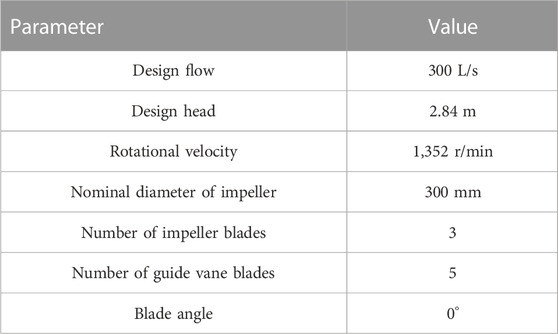
TABLE 1. Main parameters of the submersible tubular electric pump device.
The SST-CC turbulence model can better handle the transport of turbulent shear stress in the inverse pressure gradient and separation boundary layer (Chalghoum et al., 2018; Smirnov and Menter, 2009) and predict the flow separation in the inverse pressure gradient region by using ANSYS CFX to perform three-dimensional non-constant numerical values of the internal flow field of a submersible tubular electric pump device at different flow rate conditions. Also, the turbulence model has been well applied in rotating mechanical energy performance and three-dimensional flow field prediction (Tao et al., 2014; Yang et al., 2022b), so this study uses the SST-CC turbulence model with rotation and curvature-adjusted vortex viscosity model. Pressure is the inlet boundary condition, the reference total pressure size is set to 1 atm, and the inlet surface of the inlet extension is designed to have the entire pressure. The outlet condition is mass flow rate, which is set on the outlet surface of the outlet extension. The impeller, guide vane body, bulb body, and the solid wall surface of the flow rate conduit are set as no-slip boundary conditions, and the intersection surface between the impeller and the inlet water conduit and guide vane body is set as the dynamic–static intersection interface, as shown in Table 2, and the transient frozen rotor intersection interface is used for non-stationary flow field calculation. Referring to the time step setting of the non-constant numerical calculation in the literature (Wang, 2020; Yang et al., 2022c), the time step for the non-constant calculation of the submersible tubular electric pump device is set to 3.6988 × 10⁻⁴ (1/120 of the impeller rotational period), and one time step is set for every 3° of impeller rotation, 8 calculation periods are selected for a total of 960 steps, and the total time is set to 0.35552 s. The range of flow rate conditions is calculated by changing the inlet flow rate and monitoring the inlet and outlet pressure, the efficiency and head under different flow rate conditions are calculated, and 1.0 × 10⁻⁵ is the convergence accuracy setting.
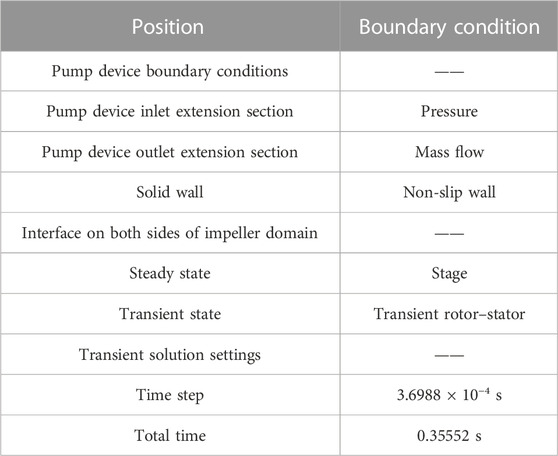
TABLE 2. Setting of boundary conditions.
There are two main types of mesh segmentation methods: structured and unstructured. The structure of the pump device is complex, and the block mesh separation strategy is used. The complicated shape of the blades in the mesh section of rotating machinery can be generated by ANSYS TurboGrid software as a high-quality structured mesh, the fluid domain of the impeller and guide vane body is separated by structured mesh through TurboGrid, the inlet and outlet water conduits are generated in ICEM CFD software to generate structured mesh, and the bulb body’s fluid domain is dissected by ICEM CFD software with an unstructured grid, the accuracy of the internal flow of the pump device’s, and the Jacobi determinant value is used to judge the grid quality, and the grid quality of each overflow structure is greater than 0.6. The impeller and impeller grid y+ are within 20. This satisfies the near-wall grid quality requirements of the SST-CC turbulence model (Yang et al., 2021b). The impeller and guide vane body meshes of the submersible tubular electric pump device are shown in Figure 2.
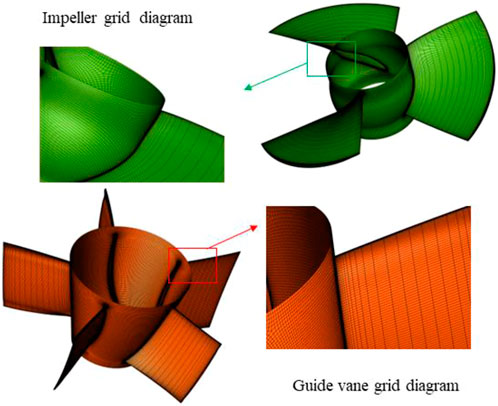
FIGURE 2. Grid of impeller and guide vane.
In the numerical simulation calculation of the internal flow of the pump device, the grid dissection nodes contain physical quantities. Thus, while in theory, a larger number of grid nodes would result in more precise calculations, in fact, the accuracy of the calculations is not in a linear relationship with the number of grids. When the number of grids reaches a certain value, the increase in calculation accuracy tends to be stable. In order to select a suitable number of grids for the pump device, the predicted values of the pump device efficiency at seven grid quantities were selected as the basis for the evaluation of the grid quantities, and the grid quantities of schemes 1 to 6 were 2514527, 3345478, 4224561, 5143695, 5854427, and 7185921, respectively. The results of the calculation of the efficiency of the device are shown in Figure 3. When there are 5.85 million grids, the efficiency of the pump device changes noticeably more slowly. The absolute error of the device efficiency of scheme 4 and scheme 5 is 0.4%, the absolute error of the device efficiency of scheme 5 and scheme 6 is 0.15%, and the absolute difference of the pump device efficiency of scheme 4, scheme 5, and scheme 6 is less than 0.5% to meet the accuracy requirements; this study adopts 5.85 million grids. The submersible tubular electric pump device is numerically simulated using the grid number of scheme 5.
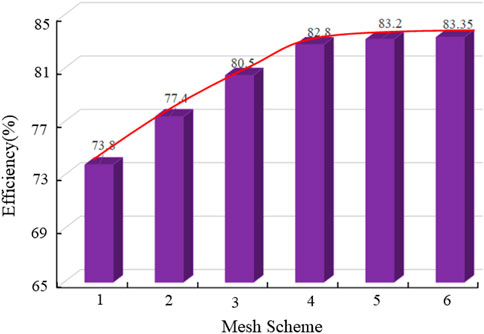
FIGURE 3. Grid number irrelevance.
To verify the validity of the numerical calculations, the energy performance of the submersible tubular electric pump device was tested on a high-precision hydro-mechanical test bench at the Key Laboratory of Hydraulic Power Engineering in Jiangsu Province, China, as shown in Figure 4. The pump device’s physical model test used an impeller and guide vane with the same geometry as the numerically calculated model, and the head, flow rate, and torque of the pump device were measured under different flow rate conditions at a blade placement angle of 0° and a rated rotational speed of 1,352 r/min. A reputable metrology calibration department in China confirmed the system uncertainties of the test equipment, and Table 3 lists the system uncertainties of each piece of test equipment. The system uncertainty of the test bench and pump device energy performance efficiency is 0.274%, the random uncertainty of the pump device efficiency test is 0.11%, and then the comprehensive uncertainty of the test bench is 0.296%. The comprehensive uncertainty of the efficiency test is in line with the requirements of the water industry standard of the People’s Republic of China “Code of practice for model pump and its installation acceptance tests (SL140-2006).”
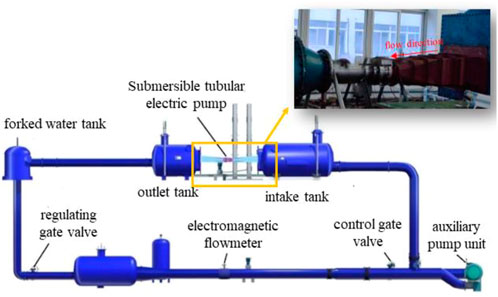
FIGURE 4. High-precision hydro-mechanical test bench.
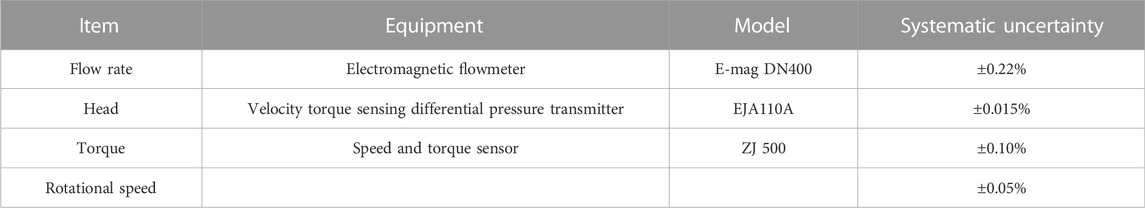
TABLE 3. Systematic uncertainty of the test equipment.
The head ∼ flow rate and efficiency ∼ flow rate curves of the submersible tubular electric pump device at different flow rate conditions are shown in Figure 5. The trends of flow rate ∼ efficiency curve and flow rate ∼ head curve of numerical simulation and model test are consistent, and the test results of head and efficiency in the high-efficiency zone, flow rate 280 L/s∼320 L/s, are in good agreement with the outcomes of the numerical simulation. In the range of calculated flow rate conditions 200 L/s∼400 L/s, the maximum relative head error is 7.6 and the maximum absolute efficiency error is 2.5, all of which are within acceptable bounds. Indicating that the numerical calculation results are realistic and reliable and can accurately reflect the internal flow characteristics of the pump device, the numerical calculation predicts the overall agreement between the energy performance results of the pump device and the physical model test results. For the purpose of analysis, three characteristic flow rate conditions were selected, namely, 1.0Qd (Q = 300 L/s) for the design flow rate condition, 1.2 Qd (Q = 360 L/s) for the high flow rate condition, and 0.8 Qd (Q = 280 L/s) for the low flow rate condition.
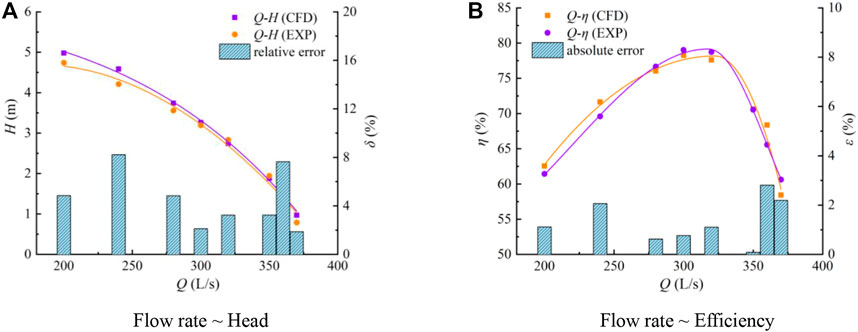
FIGURE 5. Comparison between numerical simulation and test results of energy performance parameters of the pump device.
Omega criterion has a low perception of moderate threshold change compared to traditional vortex identification methods, and it is able to precisely capture the intricate weak and strong vortices inside each overflow part of the pump device (Liu et al., 2016; Wang et al., 2019b). In this study, the omega criterion was used to analyze the vortex structure of the guide vane domain at 1.0Qd operating conditions, and the vortex structure inside the guide vane is shown in Figure 6, using turbulent kinetic energy (TKE) for a threshold value of 0.68 equivalent surface coloring to reflect the intensity of the vortex structure (Hunt et al., 1988; Jeong and Hussain, 1995). The vortex structure of the guide vane body at three different characteristic moments in one rotational period (T) under the low flow rate condition mainly exists at the position where the hub, rim, and blade are connected, and the influence of the guide vane on the fluid flow pattern is easy to form a vortex at the edge of the blade. The number of vortex structures from the guide vane body inlet to the outlet direction shows a gradual increase in the trend. With the same rotational period at different moments, the change in size and scale of the vortex structure is small, the shape of the vortex structure overall is a long strip, and there is obvious continuity. The guide vane body’s exit rim is where the high turbulence energy area is concentrated, and its value is primarily between 0.5 and 0.8.
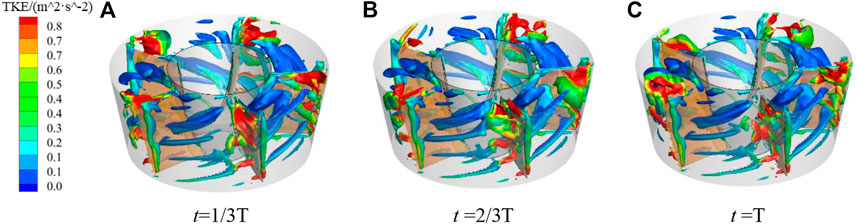
FIGURE 6. Structure of the vortex of the guide vane body at different moments (1.0Qd).
The guide vane body of the submersible tubular electric pump device plays a role in changing the flow direction and recovering kinetic energy, and the vane blade of the guide vane body has a great influence on the flow pattern of water. Bulb body support is an important over-flow component inside the submersible tubular electric pump device, and a reasonable shape of the support can improve the flow pattern, reduce the amount of water circulation, and improve the efficiency of the pump device. The water flow at the outlet of the guide vane has a certain residual velocity circulation, which induces the spiral operation of the water flow inside the flow conduit and affects the hydraulic loss of the outlet conduit. The tail of the bulb body increases the radial velocity due to the increase in the flow area, the water flow is disordered, and the velocity distribution is uneven. The flow field of the characteristic section of the bulb body is analyzed by selecting three characteristic moments in one rotational period, and the location of the characteristic section is shown in Figure 7. The distance of section 1-1 from the center line of the impeller is 0.61D and the distance of section 2-2 from the center line of the impeller is 2.3D. The relative velocity distribution of section 1-1 at different moments of the guide vane body (vi is the instantaneous velocity at this point and va is the average velocity of the section) is shown in Figure 8. There are five similar areas at the outlet all showing obvious high-velocity and low-velocity areas, and the low-velocity area is mainly at the position of the guide vane because the water flow at the suction surface and the hub of the guide vane has a bad flow pattern. The flow velocity distribution of section 2-2 at different moments is shown in Figure 9. The overall flow velocity value at the exit of the bulb body is small, basically the low-velocity zone. In the tail area of the bulb body, due to the sudden expansion of the overflow section, resulting in complex flow patterns such as deluge and vortex, the size distribution position of the flow velocity in the same cycle is relatively unchanged in periodic changes.
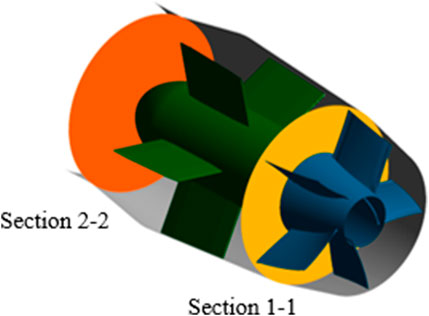
FIGURE 7. Diagram of each section position of the bulb body.
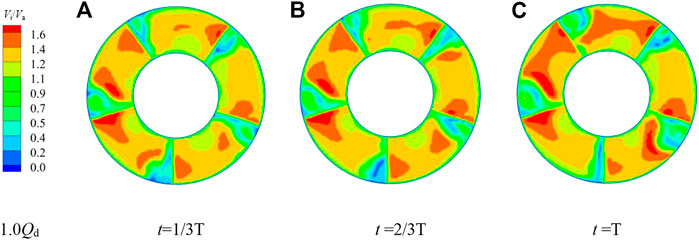
FIGURE 8. Outlet velocity cloud contour of section 1-1 guide vane at different moments (1.0Qd).
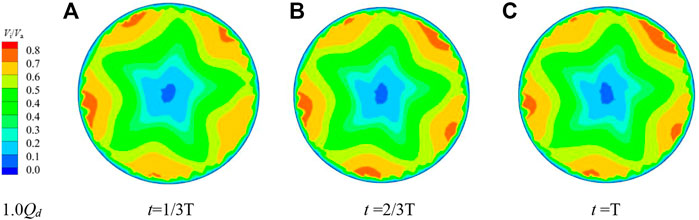
FIGURE 9. Velocity cloud contour of section 2-2 bulb body outlet at different moments (1.0Qd).
The deflection of the flow velocity at the guide vane body and bulb body outlet needs to be statistically analyzed. The deflection angles of the flow at the two characteristic sections of the guide vane body outlet and the bulb body outlet at 0.8 Qd, 1.0 Qd, and 1.2 Qd operating conditions were analyzed (Yan et al., 2016), and the calculated equation is shown below.
where
Figure 10 shows the deflected flow angle of section 1-1 at all three characteristic flow rate conditions, and the flow at the outlet of the guide vane body has a certain circumferential flow velocity, among which the deflected flow angle is larger at the low flow rate condition of 0.8 Qd, mainly due to the larger remaining ring volume at the outlet of the guide vane body at the low flow rate condition. Figure 11 shows a cloud diagram of the deflection angle of the bulb body outlet of section 2-2 at different flow rate conditions; the larger deflection area is concentrated in the tail center of the bulb body. With the increase in flow rate, the bulb body inlet to the bulb body outlet angle of deflection is gradually decreasing trend. In the high flow rate condition of 1.2 Qd, section 1-1 and section 2-2 deflected flow angle below 0.3°, the largest region, indicating that in the high flow rate condition, the bulb body outflow pattern is better and the flow line is relatively smoother.
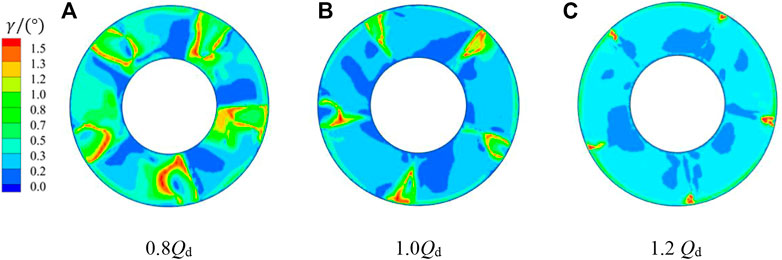
FIGURE 10. Distribution diagram of the deflected flow angle of section 1-1 under different conditions.
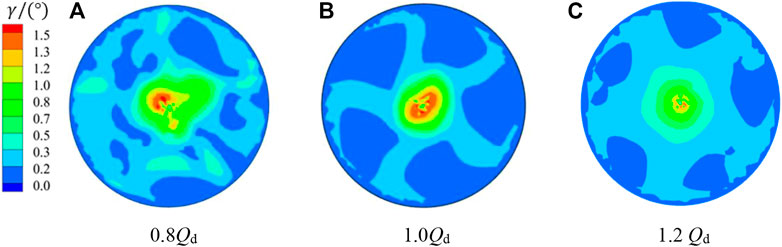
FIGURE 11. Distribution diagram of the deflected flow angle of section 2-2 under different conditions.
Considering the unsteady sequential interference between the impeller and the guide vane, the pressure in the pump will change rapidly with time; that is, the pressure pulsation is generated. Monitoring points are set up at the inlet and outlet of the impeller and between the impeller and the guide vane to analyze the variation of pressure pulsation. Due to the sealing characteristics of the submersible tubular electric pump device and the limitation of the test method, the monitoring points of the model test can only be arranged on the wall surface of the pump device. In order to facilitate the comparison between the numerical simulation results and the pulsation test results, three pressure pulsation monitoring points were arranged near the wall surface. At three different flow rate conditions (0.8 Qd, 1.0 Qd, and 1.2 Qd), pressure pulsation in the zone of the impeller and guide vane body was analyzed spectrally and in the temporal domain. Three pressure pulsation monitoring points were set separately at the impeller inlet, impeller outlet, and guide vane body outlet, and the location of each monitoring point is shown in Figure 12. Three monitoring points are set at the impeller inlet: the distance from monitoring points P01–P03 to the pump axis is 0.092D, 0.117D, and 0.143D, respectively. Between the impeller and the body of the guiding vane, the distance from monitoring points P04–P06 to the pump axis is 0.078D, 0.112D, and 0.149D, respectively. Three monitoring points are set at the guide vane body outlet: the distance from monitoring points P07–P09 to the pump axis is 0.078D, 0.112D, and 0.149D, respectively. The distance from P07–P09 to the pump axis is 0.242D, 0.256D, and 0.272D, respectively.
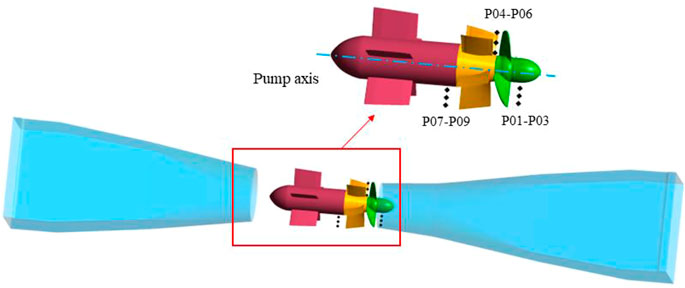
FIGURE 12. Schematic diagram of the pressure pulsation monitoring point.
Frequency domain and time domain techniques are frequently used in pressure pulsation analysis. In the process of time domain analysis, in order to eliminate disturbances, the instantaneous pressure needs to be dimensionless, and the pressure coefficient CP is calculated as shown below (Widmer et al., 2011):
where P is the instantaneous pressure,
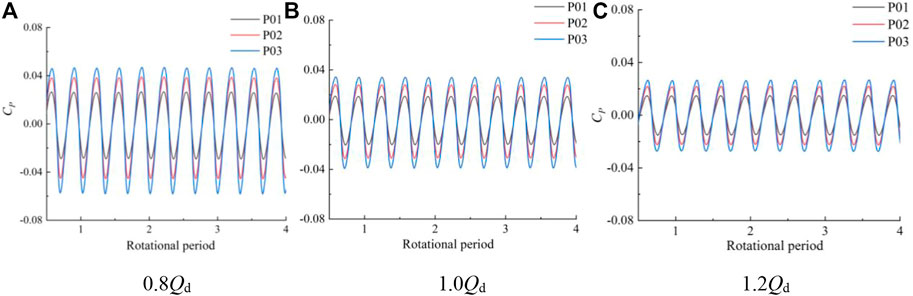
FIGURE 13. Time domain diagram of the impeller inlet monitoring points at different flow rate conditions.
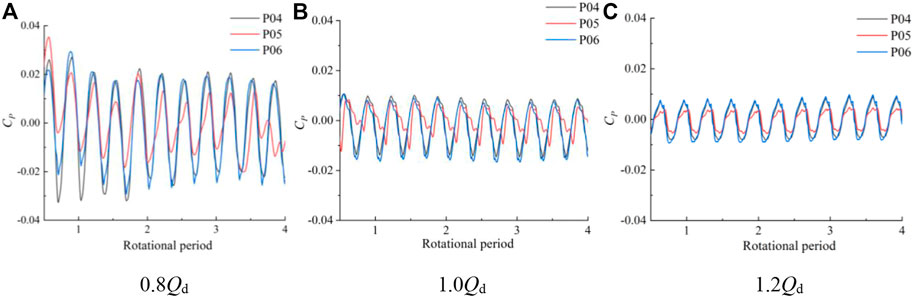
FIGURE 14. Time domain diagram of pressure pulsation at the monitoring point between the impeller and guide vane body at different flow rate conditions.
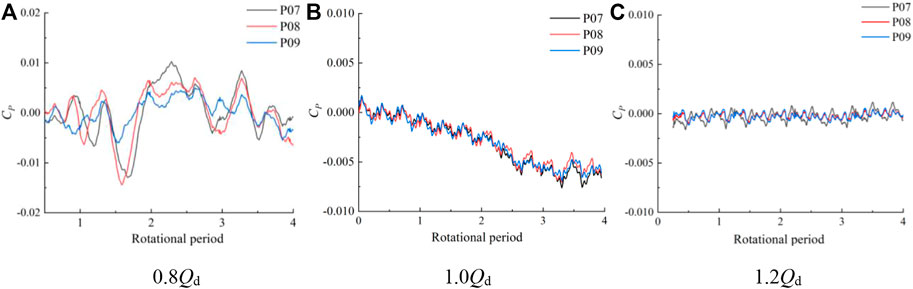
FIGURE 15. Time domain diagram of pressure pulsation at the outlet of the guide vane body at different flow rate conditions.
After the initial analysis of the data with obvious features in the time domain, it is found that some signals with the same time domain parameters have differences in other parameters, so the concept of frequency domain is introduced here for further analysis of the signal. FFT can characterize the overall nature of the signal, but when it is necessary to understand the local characteristics of the signal, FFT is used to select a window function of limited length and divide the signal into many small intervals, and Fourier analysis is performed on the signal at each time interval. In this study, the FFT is used to convert the pressure pulsation time domain signal into frequency domain signal, and the pressure pulsation spectrum of each pressure pulsation monitoring point is obtained. In Figure 16, Figure 17, and Figure 18, the X-axis is the ratio of frequency to rotational frequency (rotational frequency
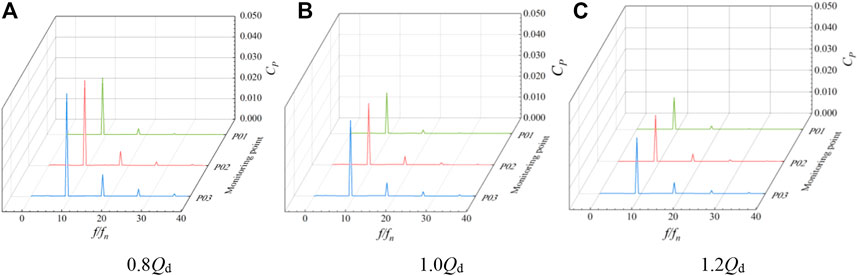
FIGURE 16. Pressure pulsation spectrum of impeller inlet monitoring points 1–3 at different flow rate conditions.
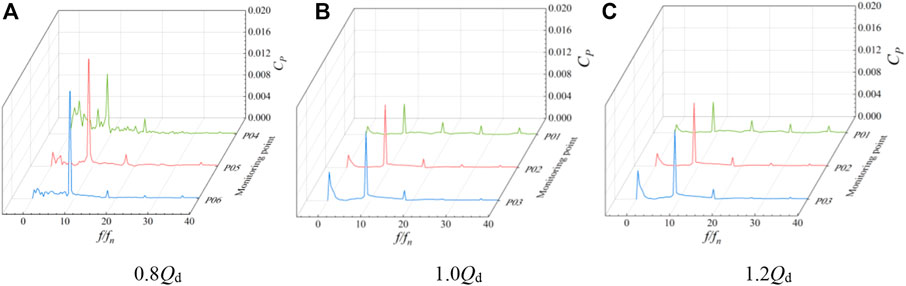
FIGURE 17. Pressure pulsation spectrum of monitoring points 4–6 between the impeller and guide vane body at different flow rate conditions.
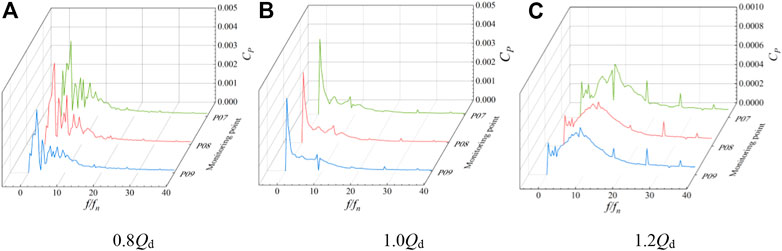
FIGURE 18. Pressure pulsation spectrum of monitoring points 7–9 between guide vane body outlets at different flow rate conditions.
The frequency spectrum of pressure pulsation at monitoring points P01–P03 of the impeller inlet under various flow rate conditions is shown in Figure 16. The pressure pulsation amplitude increases from the hub to the rim, and the main frequency of each monitoring point is situated at three times the rotating frequency. Under various flow rate conditions, the pressure pulsation frequency at the impeller’s input section is identical, indicating that the inlet section of the impeller domain is significantly influenced by the rotation of the impeller. With a rise in flow rate, each monitoring point’s pressure pulsation amplitude reduces to varying degrees, and the pressure pulsation amplitude at the wheel edge at 1.2 Qd operating condition decreases about 34 compared with the small flow rate at 0.8 Qd operating condition. The main frequency amplitude of each monitoring point is P03, P02, and P01 in descending order, which indicates that the pressure fluctuation at the wheel edge of the impeller domain is greater. Figure 17 shows the pressure pulsation spectrum of monitoring points P04–P06 between the impeller and guide vane body. The main frequency is still visible at three times the rotational frequency, and the number of impeller blades has no effect on the pulsation at any monitoring point. In the 1.2 Qd condition, the difference of the pressure pulsation amplitude at the hub and the wheel rim is not large, and the pressure pulsation amplitude value increases from the hub to the wheel rim and the overall value decreases. Figure 18 shows the pressure pulsation spectrum of monitoring points P07–P09 between the guide vane body outlets. In 0.8 Qd and 1.0Qd conditions, the pressure pulsation coefficient of each monitoring point dominates the corresponding frequency multiplier in the leaf frequency, and the spectrum of each monitoring point has no obvious similarity compared with other sections.
The highest pressure that can be obtained at that monitoring point in the calculation cycle is reflected by the pressure pulsation peak-to-peak value, which describes the pulsation pattern of the pulsation signal in one rotational period. Using 97% confidence interval for pressure pulsation peak value (Li et al., 2017; Yang et al., 2019), remove the first 1.5 and after 1.5 of the data samples; the maximum and minimum values of the remaining data are used to find the difference to obtain the peak pressure pulsation for further analysis of the impeller inlet, impeller and guide body, and guide body outlet pressure pulsation fluctuations; the monitoring points P01–P09 have been calculated for the peak. Figure 19 shows the peak values of pressure pulsation at each monitoring point under different working conditions. At the impeller inlet, due to the influence of the impeller blade rotation, the flow pattern is unstable and generates large fluctuations, and the peak value of pressure pulsation gradually increases from the wheel edge to the wheel hub. Due to the guide body rectification recovery effect, the water flows through the guide body, the pulsation pressure is reduced, the pressure gradient is reduced, and the corresponding peak value is reduced. At 0.8 Qd working condition, pressure pulsation reaches its maximum at the impeller’s intake wheel edge, where it reaches a peak value of 0.112, and at the guide body’s exit wheel edge, where it reaches a peak value of 0.015, which is reduced by 88.46.
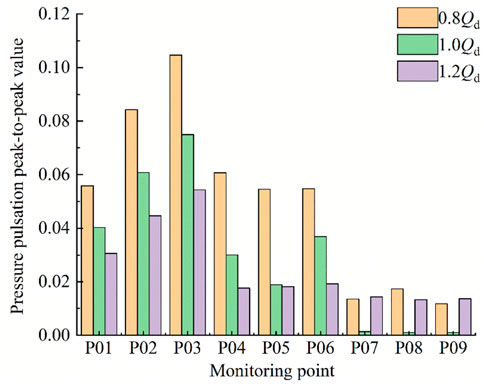
FIGURE 19. Pressure pulsation peak-to-peak.
The reliability and validity of the numerical calculation were verified by physical model tests, and the variation law of the transient characteristics of the internal flow of the impeller and guide vane of the submersible tubular electric pump device was studied. By establishing monitoring points and conducting a time–frequency domain analysis of pressure pulsation, the features of this pump device’s pressure pulsation under various flow rate conditions are better explored, and the following results are drawn.
1) The long strip vortex structure inside the guide vane body is mainly divided into the hub and guide vane body outlet area. As the flow rate increases, the size and number of vortex structures gradually decrease at different moments, and the number of vortex structures gradually increases from the inlet to the outlet of the guide vane, but the volume of the vortex structures gradually decreases, and the turbulence energy is significantly reduced. The deflected flow angle of the guide vane body outlet is mainly concentrated in the edge area of the guide vane. Thus, for each flow rate condition, there is a specific transverse flow velocity at the guide vane body’s exit surface. The relative velocity at the exit of the guide vane body and bulb body does not change significantly in one rotational period.
2) Each monitoring point at the impeller inlet is in a rotational period, and the number of peaks and troughs of the pressure fluctuation time domain curve is three. The number of peaks and troughs is consistent with the number of impeller blades. The pressure fluctuation has strong periodicity and large fluctuation amplitude. The pressure fluctuation amplitude gradually increases with the increase of the distance between the monitoring point and the pump axis. With the increase of flow rate, the pressure fluctuation amplitude of each monitoring point at the impeller outlet decreases obviously. The pressure pulsation value of the farthest monitoring point from the pump shaft decreased by about 62.3%, and the pressure pulsation fluctuation is more obvious in the case of small flow rate, and the pressure pulsation fluctuation tends to be regular as the flow rate increases. The pressure pulsation amplitude at each monitoring point of the guide vane body outlet differs less, and the section mainly bears low-frequency pulsation and appears with more obvious irregular fluctuations. As the flow rate increases, the pressure pulsation amplitude at each section from the impeller inlet to the guide vane body outlet monitoring points obviously appears in different degrees of reduction.
3) The pressure pulsation peak value is greatest under the influence of impeller rotation at each monitoring point of the impeller inlet under the same flow rate conditions. Water flows through the guide vane body; because of the guide vane body rectification and diffusion effects, the pressure pulsation peak values at the guide vane body outlet monitoring points are lower than those of the guide vane body inlet monitoring points. Each monitoring point on the section surface shows a diminishing trend as the flow rate rises in terms of the peak value of pressure pulsation, and the peak value of pressure pulsation at each monitoring point of the impeller exit section is more influenced by the flow rate change. At the low flow rate 0.8 Qd, the peak value of pressure pulsation at the monitoring point of the hub is 3.5 times higher than that at the high flow rate 1.2 Qd.
The raw data supporting the conclusions of this article will be made available by the authors, without undue reservation.
Conceptualization: FY; software, writing original draft: YL; formal analysis: YL and PD; methodology: PD and YL; funding: FY and JL; investigation: JL and HG; resources: FY and FT; supervision: FY and FT; visualization: YL and PD; writing–review and editing: HG and FT. All authors have read and agreed to the published version of the manuscript.
This research was funded by the National Natural Science Foundation of China (Grant No. 51609210), the Major Projects of the Natural Science Foundation of the Jiangsu Higher Education Institutions of China (Grant No.20KJA570001), the Technology Project of the Water Resources Department of Jiangsu Province (Grant No. 2022074), the Science and Technology Plan Project of Yangzhou City (Grant No. YZ2022192), and the Scientific Research Program of Jiangsu Hydraulic Research Institute (Grant No. 2021).
HG was employed by the company Yangzhou Surveying and Design Institute Co., Ltd. FY was employed by the Yangzhou University.
The remaining authors declare that the research was conducted in the absence of any commercial or financial relationships that could be construed as a potential conflict of interest.
All claims expressed in this article are solely those of the authors and do not necessarily represent those of their affiliated organizations, or those of the publisher, the editors, and the reviewers. Any product that may be evaluated in this article, or claim that may be made by its manufacturer, is not guaranteed or endorsed by the publisher.
δ, relative error; ε, absolute error; H, head; η, efficiency; n, rotational velocity; Qd, design flow rate; D, nominal impeller diameter; T, rotational period; Cp, pressure coefficient; P, instantaneous pressure;
Al-Obaidi, A. R. (2020). Investigation of the influence of various numbers of impeller blades on internal flow field analysis and the pressure pulsation of an axial pump based on transient flow behavior. Heat. Transf. 49 (4), 2000–2024. doi:10.1002/htj.21704
Arocena, V. M., Abuan, B. E., Reyes, J. G. T., Rodgers, P. L., and Danao, L. A. M. (2021). Numerical investigation of the performance of a submersible pump: Prediction of recirculation, vortex formation, and swirl resulting from off-design operating conditions. Energies 14 (16), 5082. doi:10.3390/en14165082
Chalghoum, I., Elaoud, S., Kanfoudi, H., and Akrout, M. (2018). The effects of the rotor-stator interaction on unsteady pressure pulsation and radial force in a centrifugal pump. J. Hydrodyn. 30 (4), 672–681. doi:10.1007/s42241-018-0073-y
Choi, Y. D., Lim, J. I., Kim, Y. T., and Lee, Y. H. (2008). Effect of blade angle on the performance of a cross-flow hydro turbine. J. Korean Soc. Mar. Eng. 32 (3), 413–420. doi:10.5916/jkosme.2008.32.3.413
Chu, S., Dong, R., and Katz, J. (1995). Relationship between unsteady flow, pressure fluctuations, and noise in a centrifugal pump - part B: Effects of blade-tongue interactions. J. Fluids Eng. 117 (1), 30–35. doi:10.1115/1.2816814
Hunt, J. C., Wray, A. A., and Moin, P. (1988). “Eddies, streams, and convergence zones in turbulent flows,”. Studying turbulence using numerical simulation databases.Proceedings of the summer program, Stanford, CA.
Jeong, J., and Hussain, F. (1995). On the identification of a vortex. J. Fluid Mech. 285, 69–94. doi:10.1017/s0022112095000462
Ji, L., Li, W., Shi, W., Zhou, L., and Agarwal, R. (2020). Experimental study of pressure pulsation in a mixed-flow pump with different tip clearances based on wavelet analysis. Shock Vib. 2020, 1–15. doi:10.1155/2020/9041686
Ji, D., Lu, W., Lu, L., Xu, L., Liu, J., Shi, W., et al. (2021). Study on the comparison of the hydraulic performance and pressure pulsation characteristics of a shaft front-positioned and a shaft rear-positioned tubular pump devices. J. Mar. Sci. Eng. 10 (1), 8. doi:10.3390/jmse10010008
Jin, Y., He, X., Zhang, Y., Zhou, S., Chen, H., and Liu, C. (2019). Numerical and experimental investigation of external characteristics and pressure fluctuation of a submersible tubular pumping system. Processes 7 (12), 949. doi:10.3390/pr7120949
Khalifa, A. E., Al-Qutub, A. M., and Ben-Mansour, R. (2011). Study of pressure fluctuations and induced vibration at blade-passing frequencies of a double volute pump. Arab. J. Sci. Eng. 36 (7), 1333–1345. doi:10.1007/s13369-011-0119-8
Li, W., Zhou, L., Shi, W. D., Ji, L., Yang, Y., and Zhao, X. (2017). PIV experiment of the unsteady flow field in mixed-flow pump under part loading condition. Exp. Therm. Fluid Sci. 83, 191–199. doi:10.1016/j.expthermflusci.2017.01.009
Li, W., Zhang, Y., Shi, W., Ji, L., Yang, Y., and Ping, Y. (2018). Numerical simulation of transient flow field in a mixed-flow pump during starting period. Int. J. Numer. Methods Heat. Fluid Flow. 28 (4), 927–942. doi:10.1108/hff-06-2017-0220
Li, W., Li, S., Ji, L., Zhao, X., Shi, W., Agarwal, R. K., et al. (2021). A study on the cavitation and pressure pulsation characteristics in the impeller of an LNG submerged pump. Machines 10 (1), 14. doi:10.3390/machines10010014
Liu, C., Wang, Y., Yang, Y., and Duan, Z. (2016). New omega vortex identification method. Sci. China Phys. Mech. Astron. 59 (8), 684711–684719. doi:10.1007/s11433-016-0022-6
Lu, Z., Wang, C., Qiu, N., Shi, W., Jiang, X., Feng, Q., et al. (2018). Experimental study on the unsteady performance of the multistage centrifugal pump. J. Braz. Soc. Mech. Sci. Eng. 40 (5), 1–10. doi:10.1007/s40430-018-1157-x
Miyabe, M., Maeda, H., Umeki, I., and Jittani, Y. (2006). Unstable head-flow characteristic generation mechanism of a low specific speed mixed flow pump. J. Therm. Sci. 15 (2), 115–120. doi:10.1007/s11630-006-0115-6
Munih, J., Hočevar, M., Petrič, K., and Dular, M. (2020). Development of CFD-based procedure for 3d gear pump analysis. Eng. Appl. Comput. Fluid Mech. 14 (1), 1023–1034. doi:10.1080/19942060.2020.1789506
Shi, L., Yuan, Y., Jiao, H., Tang, F., Cheng, L., Yang, F., et al. (2021). Numerical investigation and experiment on pressure pulsation characteristics in a full tubular pump. Renew. Energy 163, 987–1000. doi:10.1016/j.renene.2020.09.003
Smirnov, P. E., and Menter, F. R. (2009). Sensitization of the SST turbulence model to rotation and curvature by applying the Spalart–Shur correction term. J. Turbomach. 131 (4), 041010. doi:10.1115/1.3070573
Sun, Z., Yu, J., and Tang, F. (2021). The influence of bulb position on hydraulic performance of submersible tubular pump device. J. Mar. Sci. Eng. 9 (8), 831. doi:10.3390/jmse9080831
Tao, R., Xiao, R., Yang, W., and Wang, F. (2014). A comparative assessment of Spalart-Shur rotation/curvature correction in RANS simulations in a centrifugal pump impeller. Math. Problems Eng. 2014, 1–9. doi:10.1155/2014/342905
Wang, C., Hu, B., Zhu, Y., Wang, X., Luo, C., and Cheng, L. (2019). Numerical study on the gas-water two-phase flow in the self-priming process of self-priming centrifugal pump. Processes 7 (6), 330. doi:10.3390/pr7060330
Wang, L., Zheng, Z. Y., Cai, W. H., and Li, W. Y. (2019). Extension Omega and Omega-Liutex methods applied to identify vortex structures in viscoelastic turbulent flow. J. Hydrodyn. 31 (5), 911–921. doi:10.1007/s42241-019-0045-x
Wang, F. J. (2020). Analysis method of flow in pumps and pumping stations. Beijing, China: China Water & Power Press.
Widmer, C., Staubli, T., and Ledergerber, N. (2011). Unstable characteristics and rotating stall in turbine brake operation of pump-turbines. J. Fluids Eng. 133 (4), 041101. doi:10.1115/1.4003874
Xiao, Z., Tan, J., Wang, S., Yu, Z., and Wu, W. (2019). PIV experimental study on the flow field characteristics of axial flow blood pump under three operating conditions. J. Eng. (Stevenage). 13, 155–158. doi:10.1049/joe.2018.9003
Xie, W. D., Fang, G. L., Liu, J. L., and Liu, R. H. (2010). Study on the hydraulic characteristics of submersible tubular pumping device in Gubei and Shannan pumping stations. China Water Resour. 2010(16), 13–15.
Yan, H., Liu, M. Q., Zhao, W. S., Lin, P., and Wu, Y. W. (2016). Effect of velocity loop volume on hydraulic performance of large axial flow pumping station. J. Central South Univ. Nat. Sci. Ed. 47 (6), 2125–2132.
Yang, J., Liu, J., Liu, X., and Xie, T. (2019). Numerical study of pressure pulsation of centrifugal pumps with the compressible mode. J. Therm. Sci. 28 (1), 106–114. doi:10.1007/s11630-018-1071-7
Yang, F., Zhang, Y., Yuan, Y., Liu, C., Li, Z., and Nasr, A. (2021). Numerical and experimental analysis of flow and pulsation in hump section of siphon outlet conduit of axial flow pump device. Appl. Sci. 11 (11), 4941. doi:10.3390/app11114941
Yang, F., Li, Z., Yuan, Y., Liu, C., Zhang, Y., and Jin, Y. (2021). Numerical and experimental investigation of internal flow characteristics and pressure fluctuation in inlet passage of axial flow pump under deflection flow conditions. Energies 14 (17), 5245. doi:10.3390/en14175245
Yang, X., Tian, D., Si, Q., Liao, M., He, J., He, X., et al. (2022). Flow loss analysis and optimal design of a diving tubular pump. Machines 10 (3), 175. doi:10.3390/machines10030175
Yang, F., Li, Z., Fu, J., Lv, Y., Ji, Q., and Jian, H. (2022). Numerical and experimental analysis of transient flow field and pressure pulsations of an axial-flow pump considering the pump–pipeline interaction. J. Mar. Sci. Eng. 10 (2), 258. doi:10.3390/jmse10020258
Yang, F., Chang, P., Jian, H., Lv, Y., Tang, F., and Jin, Y. (2022). Numerical analysis of unsteady internal flow characteristics of impeller-guide vane in a vertical axial flow pump device. Front. Energy Res. 1002, 935888. doi:10.3389/fenrg.2022.935888
Zhang, Y., Wang, X., Ding, P., and Tang, X. (2014). Numerical analysis of pressure fluctuation of internal flow in submersible axial-flow pump. J. Drain. Irrig. Mach. Eng. 32, 302–307. doi:10.3969/j.issn.1674-8530.13.0207
Keywords: submersible tubular electric pump, pump device, flow field, pressure pulsation, numerical simulation
Citation: Lv Y, Ding P, Liu J, Ge H, Yang F and Tang F (2023) Numerical analysis of the internal flow and pressure pulsation characteristics of a submersible tubular electric pump device. Front. Energy Res. 10:1104248. doi: 10.3389/fenrg.2022.1104248
Received: 21 November 2022; Accepted: 01 December 2022;
Published: 05 January 2023.
Edited by:
Leilei Ji, Jiangsu University, ChinaReviewed by:
Kan Kan, College of Energy and Electrical Engineering, ChinaCopyright © 2023 Lv, Ding, Liu, Ge, Yang and Tang. This is an open-access article distributed under the terms of the Creative Commons Attribution License (CC BY). The use, distribution or reproduction in other forums is permitted, provided the original author(s) and the copyright owner(s) are credited and that the original publication in this journal is cited, in accordance with accepted academic practice. No use, distribution or reproduction is permitted which does not comply with these terms.
*Correspondence: Fan Yang, ZmFueWFuZ0B5enUuZWR1LmNu
Disclaimer: All claims expressed in this article are solely those of the authors and do not necessarily represent those of their affiliated organizations, or those of the publisher, the editors and the reviewers. Any product that may be evaluated in this article or claim that may be made by its manufacturer is not guaranteed or endorsed by the publisher.
Research integrity at Frontiers
Learn more about the work of our research integrity team to safeguard the quality of each article we publish.