 Tang Xinfa
 Zhong Tian1*
 Li Dan
95% of researchers rate our articles as excellent or good
Learn more about the work of our research integrity team to safeguard the quality of each article we publish.
Find out more
ORIGINAL RESEARCH article
Front. Energy Res. , 12 January 2023
Sec. Sustainable Energy Systems
Volume 10 - 2022 | https://doi.org/10.3389/fenrg.2022.1104007
This article is part of the Research Topic Enabling technologies and business models for energy communities View all 15 articles
In order to manage the construction schedule risk of power supply and distribution engineering, a construction schedule risk evaluation model, namely the Monte Carlo simulation method - Analytic Hierarchy Process (MCS-AHP) model, is proposed. In this model, the Monte Carlo simulation method is adopted to improve the analytic Hierarchy Process (AHP), and the normal distribution interval is used to replace the specific value when constructing the fuzzy complementary judgment matrix, to reduce the risk of fuzzy thinking and incomplete information or scattered data in the process of investigation and judgment and improve the scientific evaluation. This paper takes a power supply and distribution project in Guangdong Province as an example uses the MCS-AHP model to measure the key factors limiting the project progress, and uses the AHP method for comparative analysis, to verify the feasibility of the MCS-AHP model. The analysis shows that the key influencing factors are material and equipment procurement, production and arrival, installation of 10 kv high voltage switchboard, electrical acceptance and single machine commissioning, installation of low-voltage switchboard and DC switchboard, and foundation construction of power station equipment, etc., which are consistent with the actual situation. Therefore, it is feasible to construct the MCS-AHP model, which can provide a new way of thinking for schedule risk management analysis.
In recent years, with the rapid improvement of modernization and urbanization, the demand for electricity supply in the production and life of people in modern society has shown a trend of increasing year by year (Albogamy et al., 2022). The state is paying more and more attention to the investment and construction of electric power projects, and the scale and the voltage level of electric power projects have reached a historical peak (Venkatesh et al., 2022; Zhang and Kang, 2022). As the energy market transformation gradually unfolds, electric energy’s supply and demand situation is also changing dramatically, which puts forward higher requirements for the construction of electric power projects (Sun et al., 2022). The power balance between power companies and consumers is crucial (Ali et al., 2022). Therefore, with the increase in power demand, the accelerated progress of power engineering construction will put great pressure on the different stages involved in power engineering construction projects. It also easy to causes the problem of delayed progress in power engineering construction (Sharma et al., 2022). Therefore, it is necessary to study the schedule risk management of power engineering projects.
Before the research on the schedule risk management of power engineering projects, we found that the research on the schedule risk of other construction project management has achieved many research results. In terms of identifying the risk factors of the project schedule, Cheng and Darsa, (2021) established the construction schedule risk assessment model (CSRAM) and identified 22 risk factors. Chen et al. (2020) identified construction schedule risks from the perspective of the dialectical systems at the industry level; Muneeswaran et al. (2020) Statistical analysis using relative importance index and fuzzy ranking was used to identify risks; Chen L et al. (2021) used the decomposition structure method (RBS) to classify the schedule risks of high arch dam concrete projects. In terms of the theory and method of project schedule risk management, Chen M et al. (2021) constructed a critical risk network, including key risks and links. Li X et al. (2020) used the BN-PERT risk assessment model to evaluate the project schedule risk. Cheng et al. (2019) developed a fuzzy Bayesian Network-Monte Carlo simulation (FBN-MCS) to determine the correlation between risk and project duration. In terms of risk management information management, Sami Ur Rehman et al. (2020) established a factor-characteristic matrix to discuss the role of BIM in providing effective solutions for progress management. Lin et al. (2021) uses critical chain technology and combine FMEA management tool with BIM technology to manage the risks in construction projects. Song et al. (2022) used the information to extend project control methods for resource-constrained projects. This paper studies the schedule risk management of construction projects based on previous research on the schedule risk management of power engineering projects.
In the process of research on schedule risk management of power engineering projects, it is found that the research in recent years mainly focuses on construction quality, safety and multi-dimensional risk management. For example, in the aspect of quality risk management of power engineering, Sami Ur Rehman et al. (2020) use the FUCOM method to determine the risk assessment standard. Sun (2020) uses case analysis to identify quality risk factors that significantly impact the quality of power engineering. In terms of power engineering safety risk management, Li (2021) analyzes and evaluates safety risk factors based on the fundamental theories of safety risk management. Bao et al. (2021) put forward a comprehensive risk assessment technique for digital instrumentation and control (DI&C for short) system (IRADIC technique) and put forward opinions and suggestions for risk management. In the aspect of risk analysis of power engineering construction, Shaktawat and Vadhera, (2021) take sensitivity analysis as the primary method to evaluate essential risk factors; Li Y. C et al. (2020) adopted the risk matrix method to assess the risks in the construction process of giant hydropower projects; Zheng et al. (2021) used an improved precise diffusion algorithm to solve the two-stage distributed optimization problem. In terms of multi-dimensional risk management; Liu and Xu, (2022) conducted power engineering risk management from the perspectives of economy, management, society and environmental coordination; Lotfi et al. (2022) studied the robust time-cost-quality-energy-environment trade-off with resource-constrained in project management. After consulting relevant data, it is found that the research results of various risk factors of power engineering are relatively wealthy, only schedule risk management is less studied, and schedule risk is one of the main threats to power engineering project management. Schedule risk control of power engineering construction is also vital to ensure the project objectives’ realisation (Huang et al., 2018; Wu et al., 2022). Therefore, it is necessary to carry out relevant research.
Throughout the literature at home and abroad, it is found that the research methods of schedule risk management of power engineering are still in an earlier period, such as the interpretive structural model (ISM) method (Rao et al., 2014), AHP-RII combined method model (Hossen et al., 2015), PERT/CPM simulation model (Lee et al., 2018), etc. The research on the schedule risk of power projects often needs to solve the difficulties of establishing evaluation index systems and evaluation models. AHP is a multi-criteria decision-making tool (Dhingra et al., 2022; Raghav et al., 2022), and MCS can accurately predict through simulation (Khosravi et al., 2022; Ullah et al., 2022). Combining AHP (Li and Xu, 2021) with the MCS method (Koulinas et al., 2021) can well solve the problems of poor evaluation index system setting, complex set evaluation index standard weighting, and unquantifiable qualitative index evaluation. The main contribution of this paper is that the MCS-AHP model built can solve the above problems, and can effectively reduce the subjectivity so that the weight calculated and the relationship between them is more scientific. The MCS-AHP model is a mathematical method which is applicable to the research of power engineering schedule management and can be applied to the research of other projects and can be used for project location problems and project decision-making problems. The construction schedule risk evaluation index system of power supply and distribution engineering can also provide a reference for the research of schedule risk management of power engineering projects worldwide.
Based on the discussion, the rest of the organizational structure of this paper is as follows: In the second section, mainly introduces how to build the MCS-AHP model and its calculation steps. The third section is mainly about the model application. Based on the construction schedule risk assessment index system of power supply and distribution engineering, the MCS-AHP model is used to calculate the key influencing factors, and the traditional AHP model is used for comparative analysis to verify the feasibility of the MCS-AHP model. The fourth section summarizes the research results of this paper and the prospect for the future.
With the growing scale of power supply and distribution engineering construction projects, the construction period continues to extend, how to scientifically and effectively manage and control the progress of this long-term construction phase of power supply and distribution engineering project management has always been an enduring topic. The main reason is that power supply and distribution engineering is often restricted by various factors during construction, and this restriction factor often causes the actual progress of the project to deviate significantly from the expected progress. Once such tendency factors accumulate to a certain extent and exceed its risk pre-control ability, the project progress will be difficult to achieve its desired purpose. Thus it is easy to cause the project schedule the accident. Therefore, it is necessary to strengthen the dynamic tracking and monitoring of the construction progress of the power supply and distribution projects to complete the project and obtain higher economic benefits.
In this section, we propose an MCS-AHP model to evaluate the construction schedule risk of power supply and distribution engineering, which has received little attention in previous studies. It is of great significance to determine, classify and measure the risk factors that bring adverse effects to the progress of the project, and to manage and monitor them effectively on this basis.
The standard distribution curve is high in the middle and low at the ends. μ is the centre of the normal distribution preference, and σ is the width, indicating the uncertainty present.
Define the average distribution affiliation function as:
The method proposed in this paper will be compared with the triangular fuzzy number, as shown in Figure 1.
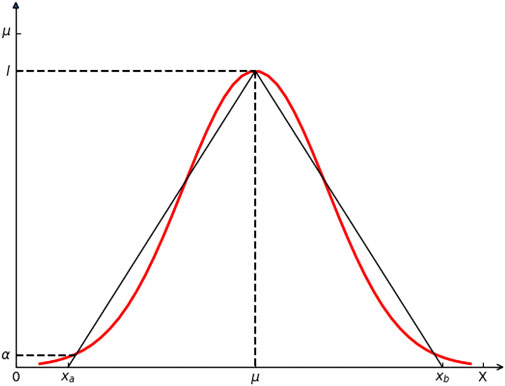
FIGURE 1. Normally distributed fuzzy numbers and triangular fuzzy numbers.
(The curve represents the normal distribution membership function, and the line represents the trigonometric function).
Figure 1 explains the description of the alpha value. Eqs. 5, 6 explain the definition of a customarily distributed fuzzy number as a transformed form of a triangular fuzzy number. It is assumed that Ti is the triangular fuzzy number and Gi is the element of the preference matrix after performing the triangular approximation.
where,
To obtain a representative approximation of the triangle, the value of α is set to 0.01. This means that a normal distribution funtion approximates 99% of the values:
where,
Will be transformed into an asymmetric normal distribution of fuzzy numbers as follows:
Let
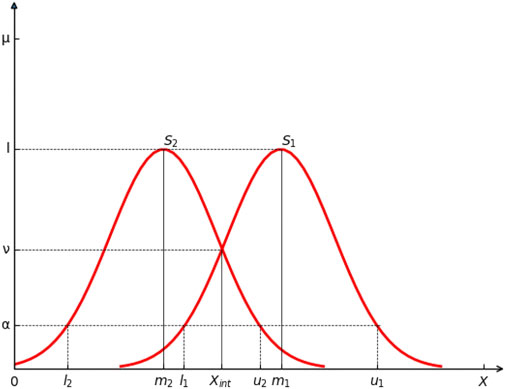
FIGURE 2. The intersection of two normally distributed membership functions.
The degree of probability of
Where
The Analytic hierarchy process is one of the multi-criteria decision-making methods that simplify the decision-making process and enables the evaluation of qualitative and quantitative criteria (Alelaiwi, 2019). The calculation steps of the hierarchical analysis method are as follows:
In-depth analysis of practical problems, top-down hierarchical analysis of relevant factors, the construction of index layer, factor layer and other index systems.
The two factors of the same layer are compared and analyzed, and the fuzzy judgment matrix is constructed according to the scale of the fuzzy judgment matrix. The relative importance of each factor is judged within the range of the set judgment scale, and the fuzzy judgment matrix is obtained.
Calculate the weight value of all factors in the fuzzy judgment matrix, Method 1: Root value method
The first step, the matrix
The second step, the matrix
The third step, the weight vector is obtained by normalization processing, namely:
Method two: Sum method.
The first step is to normalize the column vectors to obtain the matrix
The second step, add the lines of the normalized matrix
The third step, the row sum of the added matrix
In the risk assessment of the power supply and distribution project construction schedule, in addition to the index weight calculated according to expert scores, consistency index CI and consistency ratio CR should also be investigated. The matrix’s maximum characteristic roots
Since the fuzzy judgment matrix presents inconsistency in most cases, in order to measure the consistency index CI value, we need to introduce the random consistency index RI value, which depends on the matrix order:
When
Monte Carlo simulation (Qazi et al., 2021) is used to improve on the fuzzy hierarchical analysis method to quantify the degree of influence of schedule risk factors for power supply and distribution projects. In Monte Carlo simulation, the normal distribution is used as the most appropriate distribution model to approximate the probability distribution functions of the criteria and factors. The method is mainly based on fuzzy hierarchical analysis, using fuzzy hierarchical analysis as the general framework and using regular distribution intervals instead of specific values when constructing fuzzy complementary judgement matrices to reduce the risk of probabilistic uncertainty, as well as to reduce the risk of people’s fuzzy thinking and incomplete information or scattered data in the process of investigation and judgement, to avoid the results. The specific steps are as follows.
Establish a hierarchical decision structure for construction schedule risk management for power supply and distribution projects, using objective layer A, criterion layer B, and factor layer C to complete the structure. This paper describes that objective layer A is the most essential factor in determining criterion layer B and factor layer C. The attributes of the decision target layer A, criterion layer B and factor layer C should be developed based on the actual project.
The expert interview method and other statistical methods can produce the results of expert scoring and obtain the vital information of each criterion level and factor level, respectively, then use Saaty’s scale method for preliminary assessment and then decide the normal distribution range according to the expert scoring results.
The results of each expert’s score are listed to make a reasonable judgement on the construction schedule of the power supply and distribution project. In general, the total standard deviation σ is uncertain, and we can use the sampling standard deviation s as the point estimate of the total standard deviation to predict the overall parameters, using the sampling standard deviation s as the total standard deviation σ. The sampling means as the total mean μ. A normal distribution is evaluated by sorting the data in a spreadsheet to determine the normal distribution curve’s lowest, most likely and highest values. Eq. 28 gives the probability distribution function for a standard distribution curve, and Eqs. 29, 30 determine the independent typical distribution properties. The interval estimates under large samples when σ and μ are unknown are,
When s is used instead of σ, the interval estimate at the time of substitution is,
Where:
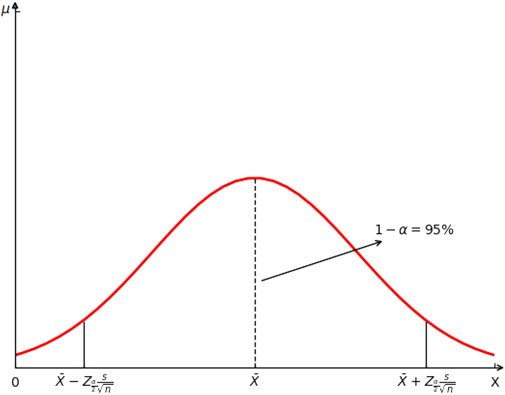
FIGURE 3. Normal distribution curve interval when confidence degree 1-α = 95%.
A standard distance fuzzy number is generated by generating a random variable for
Random Monte Carlo numbers can be generated by plotting input variables (X) ranging from 0 to 100, generating random variables from i = 1 to 100 times, and storing the results as columns of random variables. Eqs. 38–40 are then used to determine the Monte Carlo normal distribution mean and standard deviation to account for the values of a, b and c.
Where
This paper used P-P plots and the Kolmogorov-Smirnov test to test the normality of all judgement data.
For the P-P plot, the actual data cumulative rate of the data distribution, when assumed to be normally distributed, must first be calculated; this is then represented as a split scatter plot, with the X-axis representing the actual cumulative percentage and the Y-axis representing the cumulative percentage of the assumed normal distribution. Because of the normal distribution assumed for the figures, the cumulative percentage of the hypothetical normal distribution is the same as the cumulative percentage of the accurate figures.
The KS test was used to test the normality of the statistics, using the upper exact bound (the maximum value of the difference) between the cumulative distribution function
Where
Using a two-by-two comparison matrix of normally distributed fuzzy numbers instead of the fuzzy complementary judgment matrix of the traditional hierarchical analysis method, construct a comparison matrix E=(
Like the traditional fuzzy analytic hierarchy process, consistency analysis is required for each fuzzy judgment matrix to ensure that the fuzzy pairwise comparison matrix is adequate for evaluation. Once it is inconsistent, the relevant fuzzy pairwise comparison matrix needs to be adjusted. Since the interval scale is used to replace the point scale, uing the traditional consistency analysis. Some scholars (Ramík and Korviny, 2010) proposed a new consistency index (NI) to measure the consistency of pairwise comparison matrix with fuzzy ternary interval.
Where,
Where,
Normalize the two-by-two comparison matrix to obtain the matrix
The fuzzy weight values were obtained using Buckley’s geometric averaging method FAHP to calculate the fuzzy weights of each fuzzy matrix. The fuzzy weight values were calculated by geometric averaging for each row using Eq. 54.
Method two: Sum method
It is consistent with the calculation steps of the analytic hierarchy process
The fuzzy final value is calculated by computing the total hierarchical ranking.
The power supply and distribution project selected in this paper is XX Power Supporting Phase II Project, and the construction site is XX Road, XX District, XX City, Guangdong Province. The construction scope of this project is 2# plant construction, 3# plant construction and power station construction.
The essential step in the risk analysis of power supply and distribution project construction is to set up the risk assessment index system of progress. Progress risk assessment index system should be scientific and accurate, include all factors that may affect the construction progress of power supply and distribution projects, and pay attention to redundancy and contradiction among all factors while eliminating human interference factors. Combined with the actual power supply and distribution project situation, this paper summarizes the construction progress evaluation index system of the power supply and distribution project. As shown in Table 1 below.
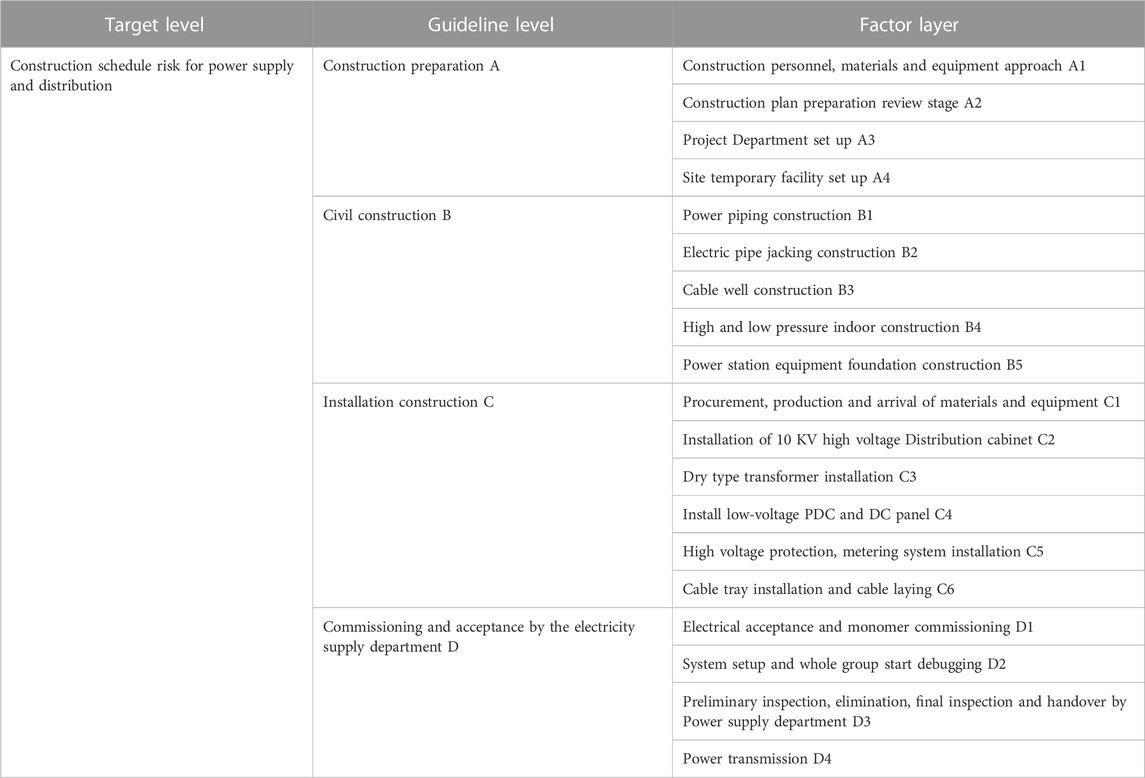
TABLE 1. Construction schedule risk evaluation system for power supply and distribution.
Sixteen experts were invited to evaluate the evaluation index system, including the project leader, deputy project manager, technical person, safety person and full-time safety officer to evaluate all the index factors. In order to construct A fuzzy pairwise comparison matrix, the two factors are compared. For example, the civil construction criterion B is compared with the construction preparation criterion A, and the importance between the two is compared according to the 1-9 scale method proposed by Professor Saaty (Kieu et al., 2021). Details of the expert scores for the guideline and factor tiers are detailed in Supplementary Appendices S1–S5.
The mean and standard deviation can be calculated based on the experts’ ratings of the two comparison factors. In order to reduce the bias caused by subjective factors, this paper selects a large sample of data to evaluate the construction risk of power supply and distribution projects. However, if the questionnaire method is used to calculate the extensive sample data, there may be a significant error. On this basis, 100 random variables were generated by applying the Monte Carlo random generation number principle. For this purpose, the standard deviation s of the sample was used as the point estimate of the total standard deviation for the prediction of the overall parameters, using the sample standard deviation s as the total standard deviation σ and the sample mean
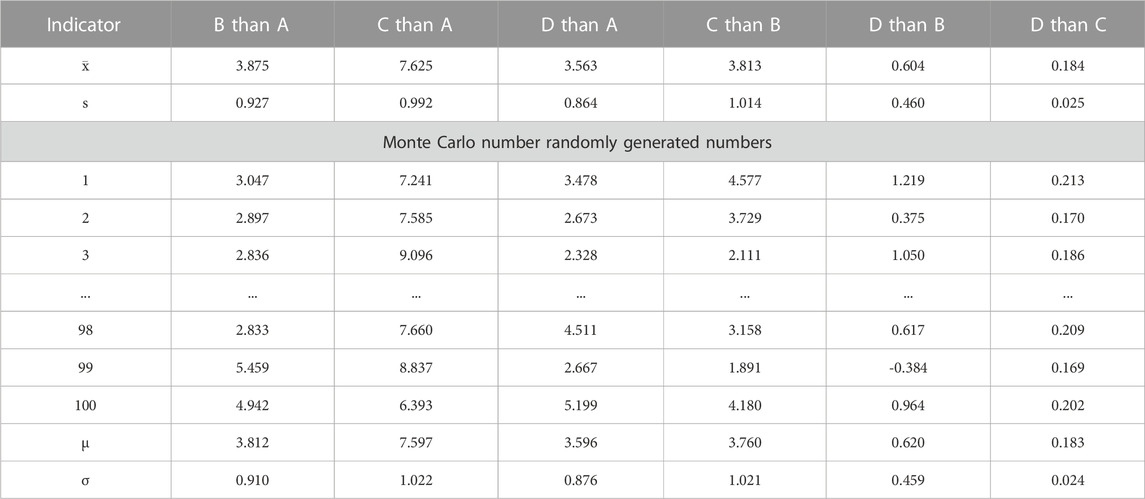
TABLE 2. Monte Carlo random generation number of criterion layer.
After generating Monte Carlo random numbers, it is also necessary to test the normality of the data. There are many methods to test for normality, and this paper takes P-P plots and K-S test tables for verification, the basic principles of which are referred to in Eqs. 41–43. To simplify the calculation and improve the calculation efficiency, this paper mainly uses the software spss for testing. According to the criterion layer, K-S test, Table 3 shows that when all values of asymptotic significance are more excellent than 0.05, so the criterion layer data conforms to a normal distribution. According to Figures 4–7 and Supplementary Appendix S10, the hypothesised cumulative ratios of the normal distribution are consistent with the cumulative ratios of the actual data, so the criterion layer data are consistent with a normal distribution. The data in each factor layer also conform to normal distribution. Due to space limitations, the K-S test and P-P plot for each factor layer will not be developed in detail here.
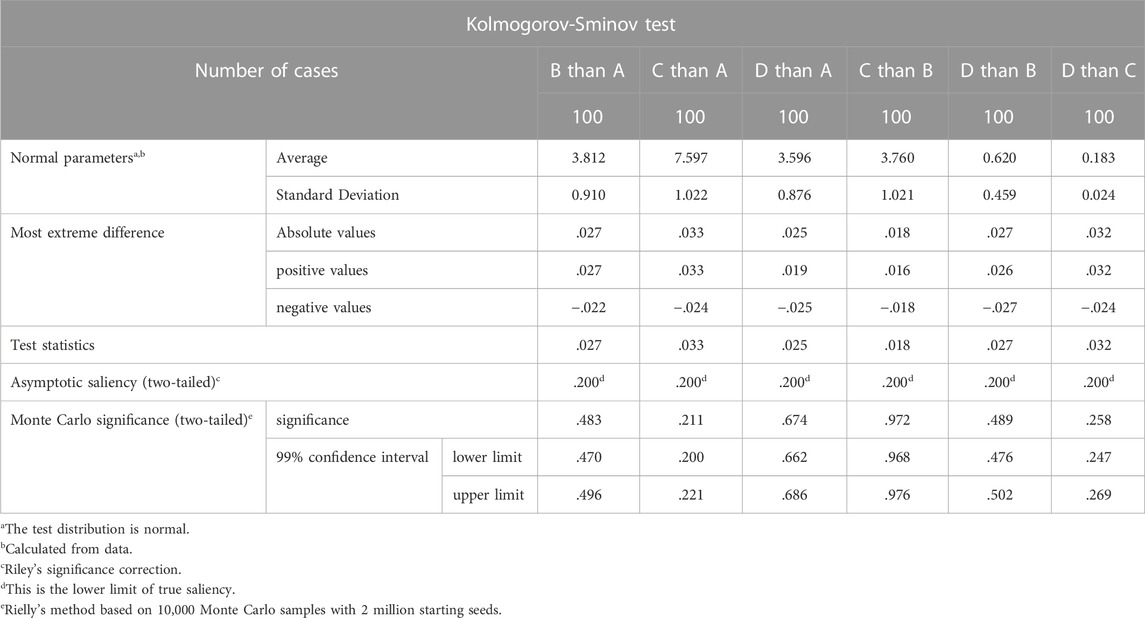
TABLE 3. K-S test of criterion layer.
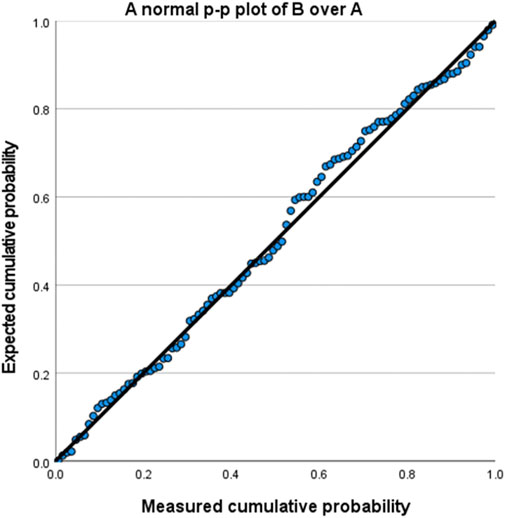
FIGURE 4. A normal p-p plot of B over A.
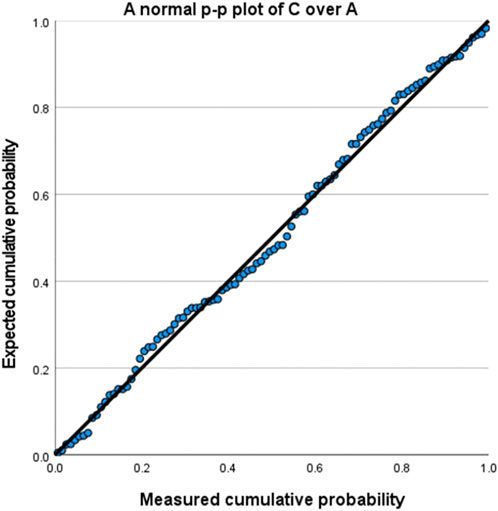
FIGURE 5. A normal p-p plot of C over A.
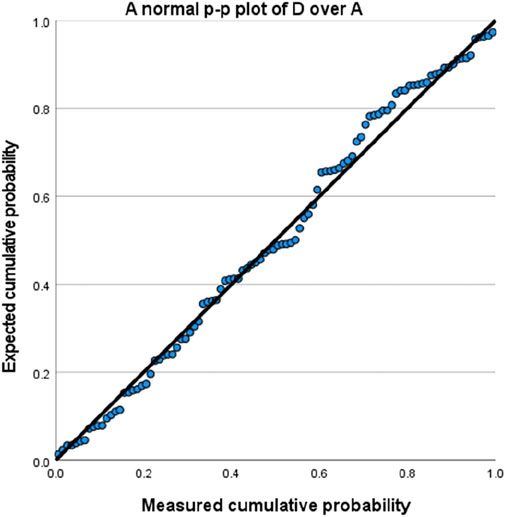
FIGURE 6. A normal p-p plot of D over A.
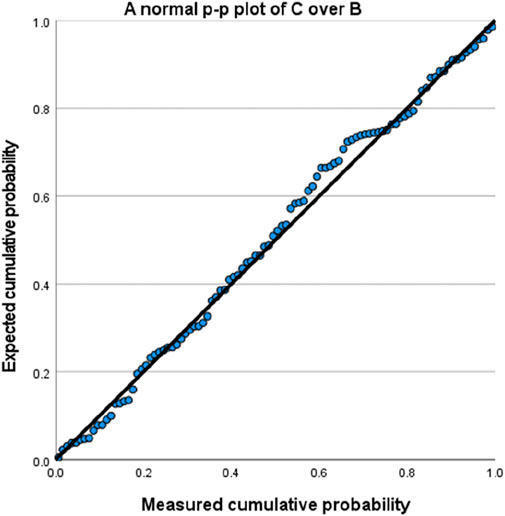
FIGURE 7. A normal p-p plot of C over B.
The population mean μ and the population standard deviation σ of the sample can be determined according to the random numbers generated by the pair comparison of factors. Eqs. 35–37 are used to determine the lower limit a, the most probable value b, and the upper limit c of the fuzzy pair-to-pair comparison matrix. The fuzzy pair-to-pair comparison matrix can be constructed by using Eq. 44, and the constructed pair-to-pair comparison matrix is shown in Tables 4–Tables 8 (In order to distinguish the results calculated by using AHP model, MCS-AHP is added to the table, representing the results calculated by using MCS-AHP model):
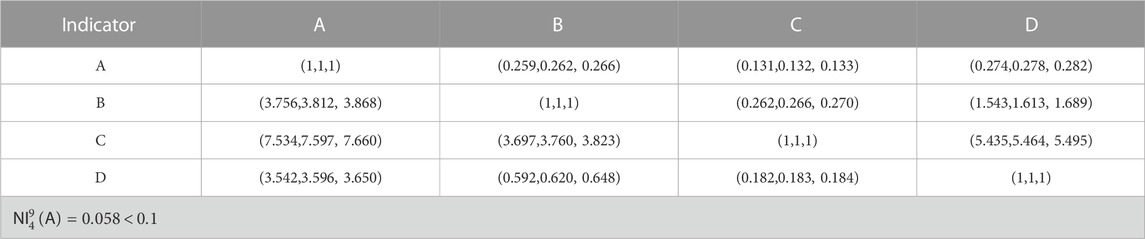
TABLE 4. Pairwise comparison matrix of criterion layer (MCS-AHP).
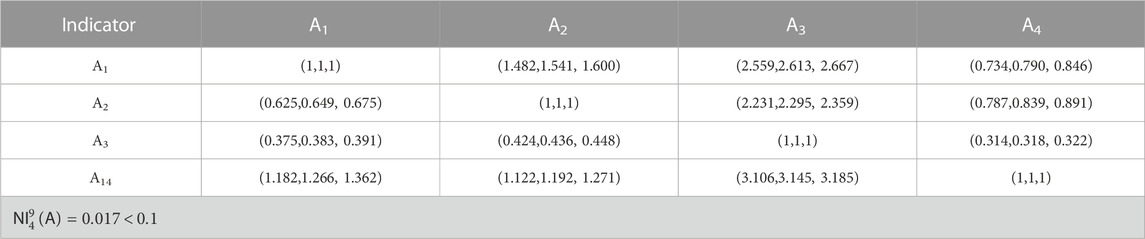
TABLE 5. Pairwise comparison matrix of construction preparation factor layer (MCS-AHP).
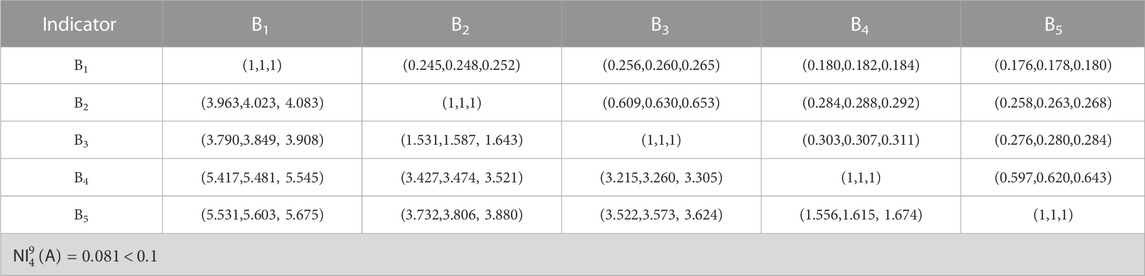
TABLE 6. Pairwise comparison matrix of civil construction factor layer (MCS-AHP).
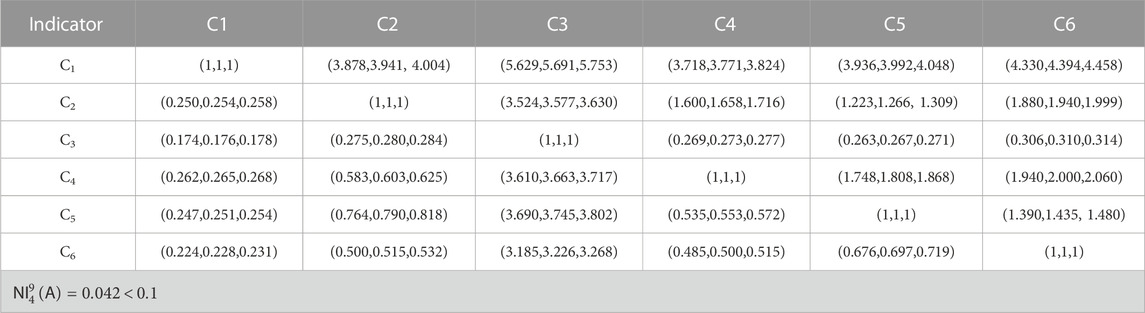
TABLE 7. Pairwise comparison matrix of installation and construction factor layer (MCS-AHP).
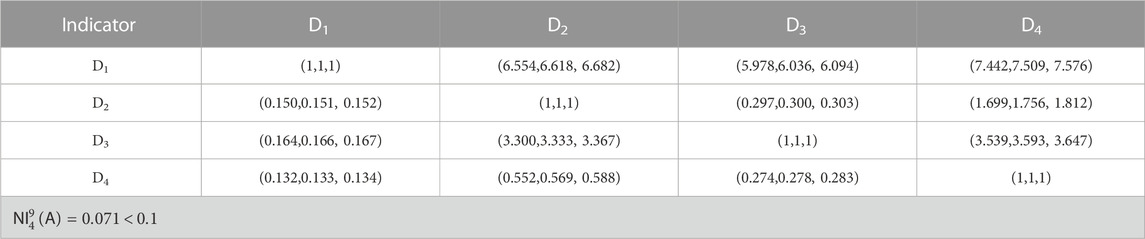
TABLE 8. Pairwise comparison matrix of factor layer of commissioning and acceptance of power supply department (MCS-AHP).
According to Eqs. 45–52, a consistency test can be performed on the pair-to-pair comparison matrix of the criterion layer. Combined with Table 4, it can be calculated as follows:
Because
Based on the fuzzy pair-to-pair comparison matrix and Eqs. 53–55, the normalized matrix and standard weight of the criterion layer and factor layer can be calculated to determine the objects that should be paid the most attention to, as shown in Tables 9, 14 below (In order to distinguish the results calculated by using AHP model, MCS-AHP is added to the table, representing the results calculated by using MCS-AHP model):
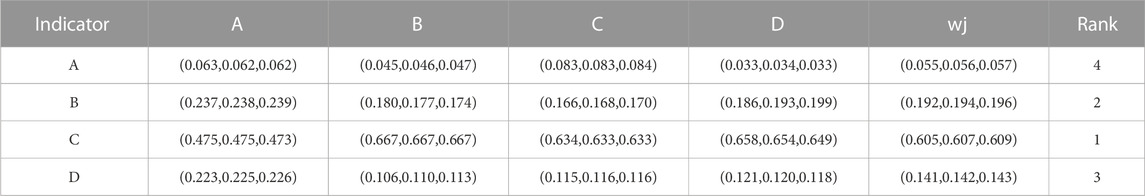
TABLE 9. Standard weight and ranking of criteria layer (MCS-AHP).
As seen from Table 9, installation construction has the most significant weight. Civil construction, commissioning and acceptance of the power supply department has the third weight, and construction preparation has the least weight. Therefore, installation construction and civil construction should be the critical criteria layer. According to the standard weight and ranking Table 10 of the construction preparation factor layer, it can be seen that the construction of temporary facilities on site has the most significant weight, followed by the construction personnel, materials and equipment entering the site, the construction plan preparation and review stage has the third weight. The construction department has the least weight. Therefore, the critical factors in the criterion layer of construction preparation are the establishment of temporary facilities on site and the entry of construction personnel, materials and equipment. It can be seen from the standard weight and ranking Table 11 of the civil construction factor layer that the weight of power station equipment foundation construction is the first, the weight of high and low-pressure indoor foundation construction is the second, the weight of cable well construction is the third, the weight of power pipe jack construction is the fourth, and the weight of power pipe row construction is the fifth. Therefore, power station equipment foundation construction and high and low-pressure indoor foundation construction are the key factors in the criteria of civil construction. As can be seen from the standard weight and ranking Table 12 of the installation and construction factor layer, the purchase of materials and equipment, production and arrival of goods have the most significant weight. The installation of a 10 kv high voltage distribution cabinet has the second weight, the installation of low voltage distribution cabinet and DC panel has the third weight, and the installation of high voltage protection and the metering system has the fourth weight. The weight of cable tray installation and cable laying ranks fifth, and the weight of dry transformer installation is the least. Therefore, in the criterion layer of installation and construction, we should focus on the procurement, production and arrival of materials and equipment, installing a 10 kv high-voltage distribution cabinet, low-voltage distribution cabinet and DC screen installation. According to the standard weight and ranking Table 13 of the acceptance factor layer of the commissioning and power supply department, the weight of electrical test and single commissioning are the highest, followed by the weight of acceptance and handover of the power supply department, the weight of system commissioning. The whole group starting commissioning is the third, and the weight of power transmission is the least. Therefore, in the criterion layer of commissioning and acceptance of the power supply department, emphasis should be placed on the two factors of electrical test, unit commissioning and acceptance and handover of the power supply department.
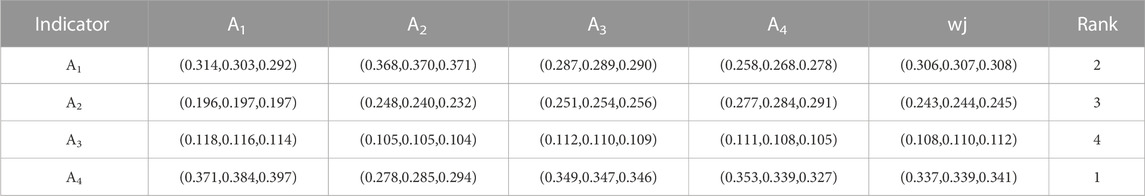
TABLE 10. Standard weight and ranking of construction preparation factor layer (MCS-AHP).

TABLE 11. Standard weight and ranking of civil construction factor layer (MCS-AHP).
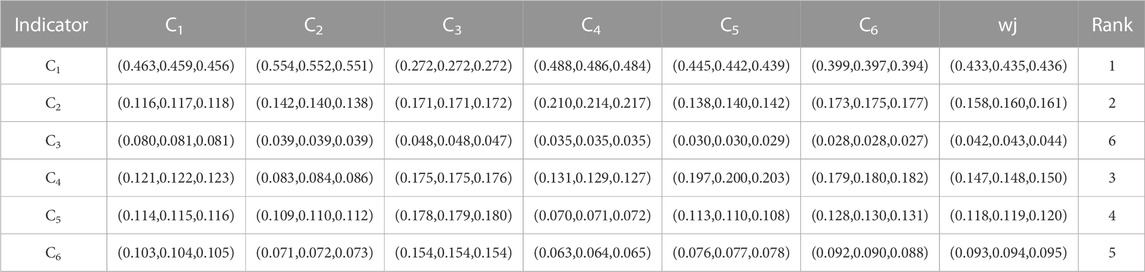
TABLE 12. Standard weight and ranking of installation and construction factor layers (MCS-AHP).
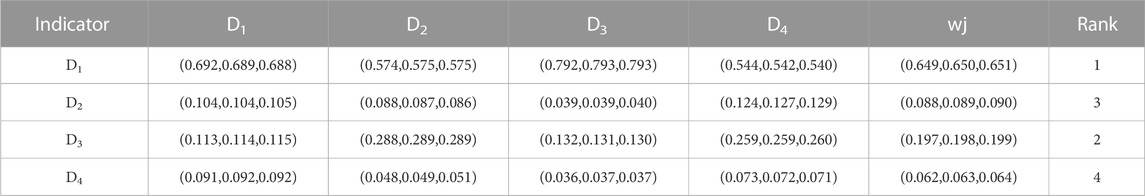
TABLE 13. Standard weight and ranking of factor layer for commissioning and acceptance of power supply department (MCS-AHP).
Based on Tables 9–Tables 14 can be obtained. Based on the comprehensive analysis of the standard weights and the overall ranking of all factors, it can be concluded that the purchase of materials and equipment, production and arrival of goods take the first place, the installation of 10 kv high-voltage power distribution cabinet takes the second place, electrical acceptance and single commissioning takes the third place, and the installation of low-voltage power distribution cabinet and DC panel takes the fourth place. The weight of power station equipment foundation construction is the fifth, and the weight of high-pressure protection and metering system installation is the sixth. Therefore, in the risk management of the entire construction schedule of the power supply and distribution project, the most important factors should be the control of materials and equipment procurement, production and arrival, installation of 10 kv high-voltage distribution cabinet, electrical acceptance and single commissioning, installation of low-voltage distribution cabinet and DC panel, equipment foundation construction of power station and installation of high-voltage protection metering system.
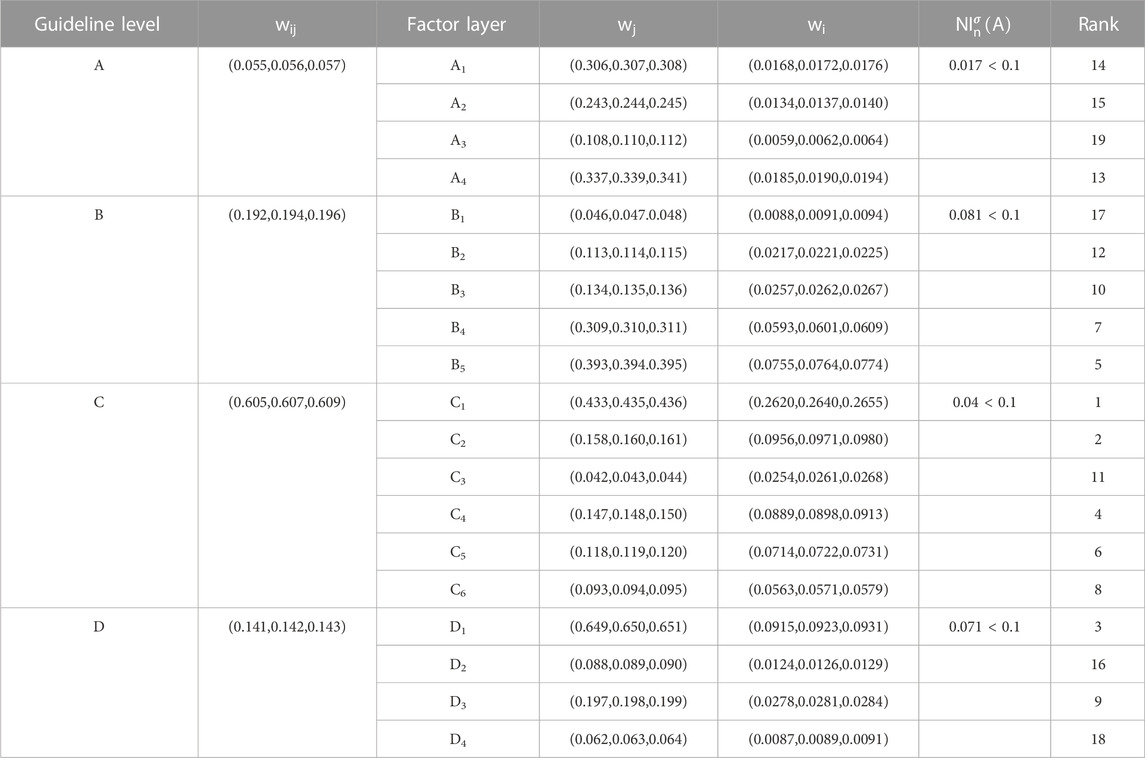
TABLE 14. Standard weight and total ranking of target layer (MCS-AHP).
Based on the results of the expert questionnaire, fuzzy two-by-two comparison matrices were constructed for the guideline layer, the construction preparation factor layer, the civil construction factor layer, the installation construction factor layer and the commissioning and power supply department acceptance factor layer, and the weights were calculated and ranked as shown in Tables 15–Tables 19 (to distinguish the results calculated by the MCS-AHP model, AHP was added to the table to indicate the results calculated by the AHP model):
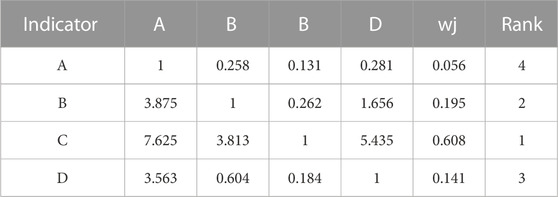
TABLE 15. Pairwise comparison matrix of criterion layer (AHP).
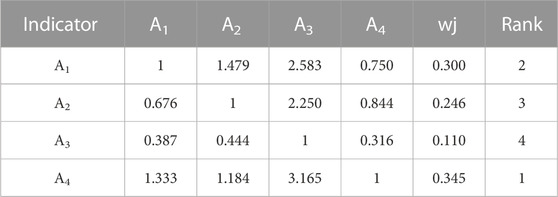
TABLE 16. Pairwise comparison matrix of construction preparation factor layer (AHP).
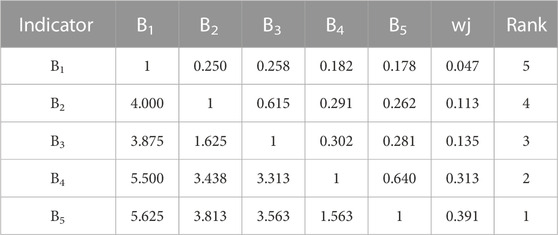
TABLE 17. Pairwise comparison matrix of civil construction factor layer (AHP).
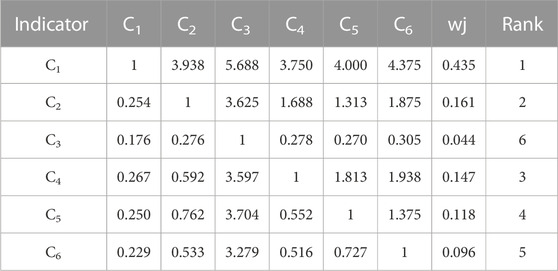
TABLE 18. Pairwise comparison matrix of installation construction factor layer (AHP).
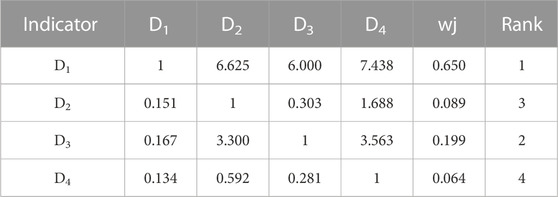
TABLE 19. Pairwise comparison matrix of acceptance factor layer of commissioning and power supply department (AHP).
Since experts may have a large subjective deviation when scoring the schedule risk of power supply and distribution engineering, it is necessary to conduct a consistency test on all pairwise mutual judgment matrices. Firstly, the consistency test is carried out on the pairwise mutual judgment matrix of the criterion layer. The specific steps are as follows:
Consistency test of the pairwise matrix of criterion layer
Step 1 Eq. 23 can be used to calculate the maximum characteristic root
Step 2 the consistency index can be calculated using Eq. 24.
Step 3 the consistency ratio is calculated using Eq. 25, where the value of RI depends on the order of the matrix, and the pairwise matrix of the criterion layer has an order of 4. Checking the RI value (Chen, 2018) shows that when n = 4, RI = 0.89
Therefore, the pairwise matrix of the criterion layer passes the consistency test, and the weight calculated meets the requirements. The calculation steps of consistency test for each factor layer are the same. Due to space limitation, the calculation will not be carried out in detail.
According to the weights of each indicator calculated from Tables 15, 19 and the consistency ratios, the final weights can be calculated as shown in Table 20 below:
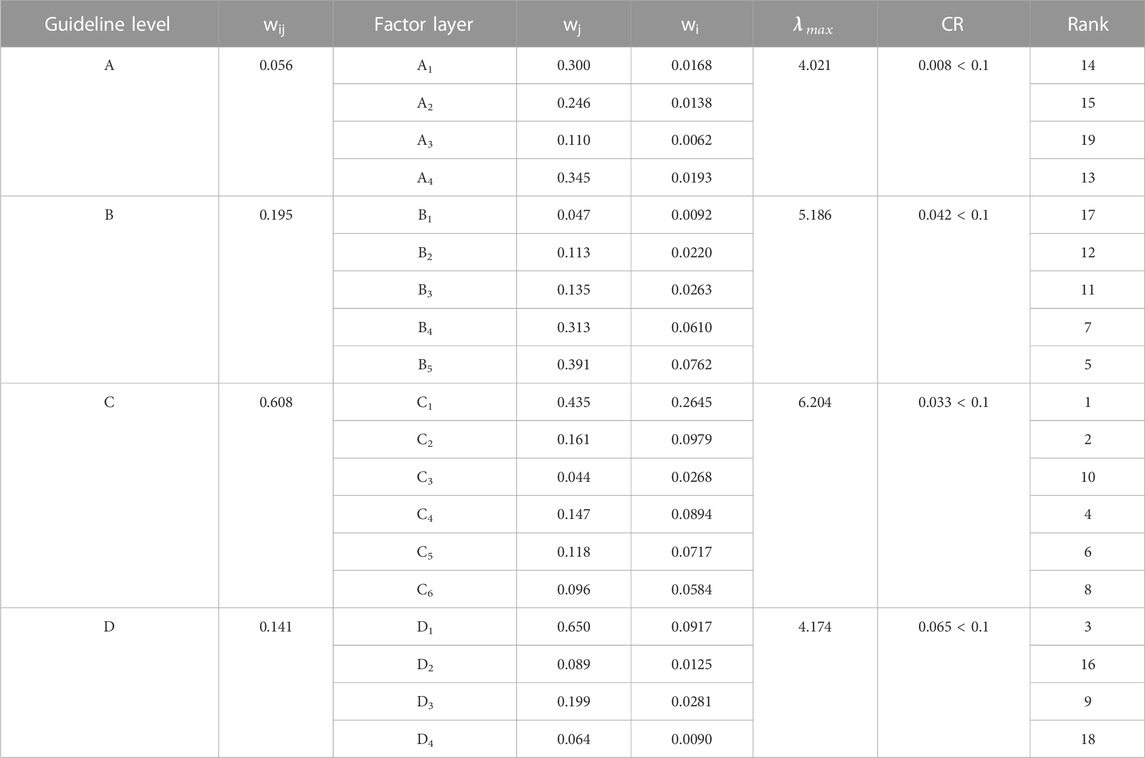
TABLE 20. Standard weight and total ranking of target layer (AHP).
From the target layer standard weight and Total Ranking (AHP) Table 20, it can be seen that the results calculated by the AHP model are as follows: C1 ranks first in the weight of material and equipment purchased, production and arrival, C2 ranks second in the weight of installation of 10 KV high voltage switchboard, and D1 ranks the third in the weight of electrical acceptance and mono commissioning. C4 installation of low-voltage PDC and DC panel ranks fourth, B5 installation of power station equipment foundation ranks fifth, and C5 installation of high-voltage protection and metering system ranks sixth. In preventing risks in the construction schedule of power supply and distribution engineering, these factors should be paid the most attention to.
According to the standard Weight and Total Ranking (MCS-AHP) Table 14 of the target layer, C1 has the highest weight of material equipment purchase, production and arrival, which has the greatest impact on the construction progress of power supply and distribution project and is the absolute factor that should be paid the most attention to. C2 10 kv high voltage switchboard installation takes the second place, D1 electrical acceptance and single commissioning takes the third place, and C4 low voltage switchboard and DC panel installation take the fourth place, but these three have more overlapping weights and have a similar impact on the progress. They are all factors that should be paid attention to. The emphasis on electrical acceptance, unit commissioning and installation of low-voltage PDC and DC panel should not be lower than that of installation of 10 kv high-voltage PDC. The weight of B5 power station equipment foundation construction is the fifth, and the weight of C5 high-voltage protection and metering system installation is the sixth. There are many overlapping parts between the two, which should have the same impact on the schedule. Therefore, in the risk management of the entire construction schedule of the power supply and distribution project, the most important factors should be the control of materials and equipment procurement, production and arrival, installation of 10 kv high-voltage distribution cabinet, electrical acceptance and single commissioning, installation of low-voltage distribution cabinet and DC panel, equipment foundation construction of power station and installation of high-voltage protection metering system. There are many overlapping parts of weight between some factors, so it is not simple to sort a single process, which should be dealt with comprehensively.
In short, according to the final calculation results of the MCS-AHP model and the AHP model, the following conclusions can be drawn:
(1) The results calculated using the traditional AHP are consistent with those calculated by MCS-AHP, so the effectiveness of the improved AHP can be verified.
(2) The difference between the two methods is that the result calculated by traditional AHP is a specific value, while the result calculated by MCS-AHP is an interval. It can be concluded that risk factors are not simply ranked to judge the degree of impact on the schedule risk of power supply and distribution projects, and there may be much overlap between some factors. Therefore, the influence relationship between the two factors on the schedule should be considered comprehensively. If the traditional AHP is only used to single rank the schedule risk of power supply and distribution projects, It may ignore the degree of influence of some factors on the construction schedule. Therefore, the improved MCS-AHP is adopted to study the construction schedule risk of power supply and distribution engineering, which can effectively reduce the subjectivity and make the calculated weights and the relationship between them more scientific.
The following conclusions were drawn from a study of construction schedule risk factors for power supply and distribution projects.
(1) A complete evaluation index system for schedule risk management of power supply and distribution projects is constructed by determining 4 criterion layers and 19-factor layers to manage the schedule risk of this project in multiple dimensions and levels. With the fuzzy hierarchical analysis method as the general framework, the average distribution interval is used instead of specific values when constructing the two-two comparison matrix to reduce the subjective probability as well as to reduce the risk of people’s fuzzy thinking during investigation and evaluation, which effectively solves the problem of greater subjectivity in the traditional fuzzy hierarchical analysis method, thus avoiding the influence on the results of the construction schedule risk evaluation index system of power supply and distribution projects and making the schedule The risk management is more scientific and reasonable.
(2) Taking a power-supporting Phase II project (construction) in Guangdong Province as an example, the results show that we should focus on controlling the procurement of materials and equipment, production and arrival of goods, installation of 10 kv high voltage distribution cabinet, electrical acceptance and single commissioning, installation of low voltage distribution cabinet and DC screen, equipment foundation construction of power station and installation of high voltage protection metering system. The results of schedule risk analysis are consistent with reality. The MCS-AHP model constructed has great significance for the risk analysis of power engineering and provides a reference for the risk analysis of other projects.
Although this paper has made certain research results on the research of construction schedule risk management of power supply and distribution engineering, due to its own theoretical knowledge is not perfect. Therefore, there are limitations and shortcomings in the research results, which are manifested in the following aspects.
(1) Since the actual construction process of power supply and distribution engineering projects is more complex and changeable than the theoretical construction process, and there are certain other risk factors, the construction schedule evaluation index system of power supply and distribution engineering constructed is relatively rough and not comprehensive enough. In the future, we can consider adding some other dynamic risk factors to make the evaluation index system more perfect.
(2) This paper mainly adopts the Monte Carlo simulation method to improve the traditional AHP, using intervals instead of specific values to reduce the subjectivity of the evaluation, but does not consider that certain risk factors may affect each other in connection with each other, so in the future, we should adopt some quantitative methods to study the coupling relationship between risk factors to optimize the evaluation model, and can also adopt some newer research methods for power engineering projects.
The original contributions presented in the study are included in the article/Supplementary Material; further inquiries can be directed to the corresponding authors.
All authors listed have made a substantial, direct, and intellectual contribution to the work and approved it for publication.
This work was financially supported by the Science and Technology Research Project of Jiangxi Education Department: Research on mechanism construction of carbon neutral technology innovation in key carbon emission industries.
HX was employed by the company of State Grid Jiangxi Electric Power Co., Ltd.
The remaining authors declare that the research was conducted in the absence of any commercial or financial relationships that could be construed as a potential conflict of interest.
All claims expressed in this article are solely those of the authors and do not necessarily represent those of their affiliated organizations, or those of the publisher, the editors and the reviewers. Any product that may be evaluated in this article, or claim that may be made by its manufacturer, is not guaranteed or endorsed by the publisher.
The Supplementary Material for this article can be found online at: https://www.frontiersin.org/articles/10.3389/fenrg.2022.1104007/full#supplementary-material
Albogamy, F. R., Khan, S. A., Hafeez, G., Murawwat, S., Khan, S., Haider, S. I., et al. (2022). Real-time energy management and load scheduling with renewable energy integration in smart grid. Sustainability 14 (3), 1792. doi:10.3390/su14031792
Alelaiwi, A. (2019). Evaluating distributed IoT databases for edge/cloud platforms using the analytic hierarchy process. J. Parallel Distributed Comput. 124, 41–46. doi:10.1016/j.jpdc.2018.10.008
Ali, S., Ullah, K., Hafeez, G., Khan, I., Albogamy, F. R., and Haider, S. I. (2022). Solving day-ahead scheduling problem with multi-objective energy optimization for demand side management in smart grid. Eng. Sci. Technol. Int. J. 36, 101135. doi:10.1016/j.jestch.2022.101135
Bao, H., Zhang, H., Shorthill, T., and Chen, E. (2021). Quantitative risk analysis of high safety significant safety-related digital instrumentation and control systems in nuclear power plants using IRADIC technology (No. INL/EXT-21-64039-Rev000). Idaho Falls, United States: Idaho National Lab.
Chen, L., Lu, Q., Li, S., He, W., and Yang, J. (2021). Bayesian Monte Carlo simulation-driven approach for construction schedule risk inference. J. Manag. Eng. 37 (2). 1943–5479. doi:10.1061/(ASCE)ME.1943-5479.0000884
Chen, L., Lu, Q., and Zhao, X. (2020). Rethinking the construction schedule risk of infrastructure projects based on dialectical systems and network theory. J. Manag. Eng. 36 (5), 04020066. doi:10.1061/(ASCE)ME.1943-5479.0000829
Chen M, M., Huang, J. W., Tan, C. S., Xiong, X., Zhou, Y. H., and Xiao, L. (2021). A system dynamics-based risk evolution model for concrete construction schedule of high arch dams. Hydropower Energy Sci. (02), 59–68.
Chen, S. Z. (2018). “Research on construction schedule risk management of guangzhou metro line X track engineering project,” (Guangzhou, China: South China University of Technology). Master's Thesis.
Cheng, M. Y., and Darsa, M. H. (2021). Construction schedule risk assessment and management strategy for foreign general contractors working in the Ethiopian construction industry. Sustainability 13 (14), 7830. doi:10.3390/su13147830
Cheng, M. Y., Wu, Y. F., Wu, Y. W., and Ndure, S. (2019). Fuzzy Bayesian schedule risk network for offshore wind turbine installation. Ocean. Eng. 188, 106238. doi:10.1016/j.oceaneng.2019.106238
Dhingra, T., Sengar, A., and Sajith, S. (2022). A fuzzy analytic hierarchy process-based analysis for prioritization of barriers to offshore wind energy. J. Clean. Prod. 345, 131111. doi:10.1016/j.jclepro.2022.131111
Hossen, M. M., Kang, S., and Kim, J. (2015). Construction schedule delay risk assessment by using combined AHP-RII methodology for an international NPP project. Nucl. Eng. Technol. 47 (3), 362–379. doi:10.1016/j.net.2014.12.019
Huang, W. J., Cai, J. J., and Xiong, C. H. (2018). The application of earned value analysis in power engineering schedule control--a 1000 kV substation as an example. J. Wuhan Univ. Eng. Ed. (1), 387–392.
Khosravi, M., Afsharnia, S., and Farhangi, S. (2022). Stochastic power management strategy for optimal day-ahead scheduling of wind-HESS considering wind power generation and market price uncertainties. Int. J. Electr. Power & Energy Syst. 134, 107429. doi:10.1016/j.ijepes.2021.107429
Kieu, P. T., Nguyen, V. T., Nguyen, V. T., and Ho, T. P. (2021). A spherical fuzzy analytic hierarchy process (SF-AHP) and combined compromise solution (CoCoSo) algorithm in distribution center location selection: A case study in agricultural supply chain. Axioms 10 (2), 53. doi:10.3390/axioms10020053
Koulinas, G. K., Demesouka, O. E., Sidas, K. A., and Koulouriotis, D. E. (2021). A TOPSIS—Risk matrix and Monte Carlo expert system for risk assessment in engineering projects. Sustainability 13 (20), 11277. doi:10.3390/su132011277
Lee, H. C., Lee, E. B., and Alleman, D. (2018). Schedule modeling to estimate typical construction durations and areas of risk for 1000 MW ultra-critical coal-fired power plants. Energies 11 (10), 2850. doi:10.3390/en11102850
Li, P., and Xu, G. N . (2021). Safety condition assessment of overhead cranes using improved fuzzy hierarchical analysis. Mech. Des. Res. (05), 219–223. doi:10.13952/j.cnki.jofmdr.2021.0209
Li, Q. (2021). “Research on safety risk management of power maintenance engineering,” (Guangzhou, China: South China University of Technology). Master's thesis.
Li, X., Hu, Z. G., Yang, G., and Song, Z. D. (2020). Schedule risk analysis of metro projects based on BN-PERT schedule risk analysis model. Urban Rail Transit Res. (06), 10–18. doi:10.16037/j.1007-869x.2020.06.003
Li, Y. F., Liu, Y. C., Hu, D. S., Guo, J. Y., and Wang, X. Q. (2020). Research on risk classification assessment method of hydropower station project based on risk matrix - taking Wudongde hydropower station as an example. China Sci. Technol. Saf. Prod. (01), 130–134. doi:10.11731/j.issn.1673-193x.2020.01.021
Lin, W., Zhang, Y. X., Zhao, X. Y., Chen, S., and Sun, Y. (2021). Project schedule risk management based on BIM-CCM. People's Chang. (S2), 335–340. doi:10.16232/j.cnki.1001-4179.2021.S2.079
Liu, L., and Xu, J. (2022). Multi-objective generation scheduling towards grid-connected hydro–solar–wind power system based the coordination of economy, management, society, environment: A case study from China. Int. J. Electr. Power & Energy Syst. 142, 108210. doi:10.1016/j.ijepes.2022.108210
Lotfi, R., Yadegari, Z., Hosseini, S., Khameneh, A., Tirkolaee, E., and Weber, G. (2022). A robust time-cost-quality-energy-environment trade-off with resource-constrained in project management: A case study for a bridge construction project. J. Industrial Manag. Optim. 18 (1), 375. doi:10.3934/jimo.2020158
Muneeswaran, G., Manoharan, P., Awoyera, P. O., and Adesina, A. (2020). A statistical approach to assess the schedule delays and risks in Indian construction industry. Int. J. Constr. Manag. 20 (5), 450–461. doi:10.1080/15623599.2018.1484991
Qazi, A., Shamayleh, A., El-Sayegh, S., and Formaneck, S. (2021). Prioritizing risks in sustainable construction projects using a risk matrix-based Monte Carlo Simulation approach. Sustain. Cities Soc. 65, 102576. doi:10.1016/j.scs.2020.102576
Raghav, L. P., Kumar, R. S., Raju, D. K., and Singh, A. R. (2022). Analytic hierarchy process (AHP)–swarm intelligence based flexible demand response management of grid-connected microgrid. Appl. Energy 306, 118058. doi:10.1016/j.apenergy.2021.118058
Ramík, J., and Korviny, P. (2010). Inconsistency of pair-wise comparison matrix with fuzzy elements based on geometric mean. Fuzzy Sets Syst. 161 (11), 1604–1613. doi:10.1016/j.fss.2009.10.011
Rao, R., Zhang, X., Shi, Z., Luo, K., Tan, Z., and Feng, Y. (2014). A systematical framework of schedule risk management for power grid engineering projects’ sustainable development. Sustainability 6 (10), 6872–6901. doi:10.3390/su6106872
Sami Ur Rehman, M., Thaheem, M. J., Nasir, A. R., and Khan, K. I. A. (2022). Project schedule risk management through building information modelling. Int. J. Constr. Manag. 22 (8), 1489–1499. doi:10.1080/15623599.2020.1728606
Shaktawat, A., and Vadhera, S. (2021). Risk management of hydropower projects for sustainable development: A review. Environ. Dev. Sustain. 23 (1), 45–76. doi:10.1007/s10668-020-00607-2
Sharma, H., Mishra, S., Dhillon, J., Sharma, N. K., Bajaj, M., Tariq, R., et al. (2022). Feasibility of solar grid-based industrial virtual power plant for optimal energy scheduling: A case of Indian power sector. Energies 15 (3), 752. doi:10.3390/en15030752
Song, J., Martens, A., and Vanhoucke, M. (2022). Using earned value management and schedule risk analysis with resource constraints for project control. Eur. J. Operational Res. 297 (2), 451–466. doi:10.1016/j.ejor.2021.05.036
Sun, D. Y., Guan, L., Hu, C. X., Luo, Z. Q., Wang, D. L., Yu, Z., et al. (2022). Design and exploration of inter-provincial power spot trading mechanism. Power Grid Technol. (02), 421–429. doi:10.13335/j.1000-3673.pst.2021.2118
Sun, H. L. (2020). Quality risk identification and response strategies for power engineering projects. Power Surv. Des. (03), 76–80. doi:10.13500/j.dlkcsj.issn1671-9913.2020.03.015
Ullah, K., Khan, T. A., Hafeez, G., Khan, I., Murawwat, S., Alamri, B., et al. (2022). Demand side management strategy for multi-objective day-ahead scheduling considering wind energy in smart GridRisk assessment and mitigation for electric power sectors: A developing country's perspective. EnergiesInternational J. Crit. Infrastructure Prot. 1536 (19), 6900100507. doi:10.3390/en15196900
Venkatesh, B., Sankaramurthy, P., Chokkalingam, B., and Mihet-Popa, L. (2022). Managing the demand in a micro grid based on load shifting with controllable devices using hybrid WFS2ACSO technique. Energies 15 (3), 790. doi:10.3390/en15030790
Wu, Y., Li, X., Zhang, L., Liu, C., Zhao, W., and Zhang, T. (2022). Machine learning–driven deduction prediction methodology for power grid infrastructure investment and planning. Front. Energy Res. 532. doi:10.3389/fenrg.2022.893492
Zhang, Z. G., and Kang, C. Q. (2022). Challenges and prospects for building new power systems under the carbon neutrality target. Chin. J. Electr. Eng. (08), 2806–2819. doi:10.13334/j.0258-8013.pcsee.220467
Keywords: power supply and distribution engineering, schedule risk management, MCS-AHP model, Monte Carlo simulation, normal distribution of fuzzy numbers
Citation: Xinfa T, Tian Z, Xingwu H and Dan L (2023) Research on construction schedule risk management of power supply and distribution projects based on MCS-AHP model. Front. Energy Res. 10:1104007. doi: 10.3389/fenrg.2022.1104007
Received: 21 November 2022; Accepted: 16 December 2022;
Published: 12 January 2023.
Edited by:
Michal Jasinski, Wrocław University of Science and Technology, PolandReviewed by:
Grigorios L. Kyriakopoulos, National Technical University of Athens, GreeceCopyright © 2023 Xinfa, Tian, Xingwu and Dan. This is an open-access article distributed under the terms of the Creative Commons Attribution License (CC BY). The use, distribution or reproduction in other forums is permitted, provided the original author(s) and the copyright owner(s) are credited and that the original publication in this journal is cited, in accordance with accepted academic practice. No use, distribution or reproduction is permitted which does not comply with these terms.
*Correspondence: Tang Xinfa, eGluZmF0YW5nQHNpbmEuY29t; Zhong Tian, MjQzNDIxNjk3OUBxcS5jb20=
Disclaimer: All claims expressed in this article are solely those of the authors and do not necessarily represent those of their affiliated organizations, or those of the publisher, the editors and the reviewers. Any product that may be evaluated in this article or claim that may be made by its manufacturer is not guaranteed or endorsed by the publisher.
Research integrity at Frontiers
Learn more about the work of our research integrity team to safeguard the quality of each article we publish.