 Kan Zhang
 Xin Liang
94% of researchers rate our articles as excellent or good
Learn more about the work of our research integrity team to safeguard the quality of each article we publish.
Find out more
METHODS article
Front. Energy Res., 24 January 2023
Sec. Nuclear Energy
Volume 10 - 2022 | https://doi.org/10.3389/fenrg.2022.1102997
This article is part of the Research TopicDynamics and Control for Nuclear EnergyView all 8 articles
The performance of shielding materials directly affects the radiation protection effect and plays a very important role in the process of ensuring the safety of nuclear energy. Therefore, this paper introduces the performance evaluation of composite shielding materials, which firstly points out the disadvantages of the traditional TOPSIS method, proposes a weighted projection model of composite shielding materials under extended TOPSIS theory, and clarifies the principle of projection dimensional reduction and algorithm implementation. Secondly, this paper also introduces the basic assumption of non-linear mapping relationship between index dimensions, and scientifically determines the weight of index system based on ANP structural model, so as to form an improved TOPSIS-ANP composite shielding material performance evaluation method based on gray relational projection algorithm with coupling characteristics. The empirical results show that the improved TOPSIS-ANP composite shielding material evaluation method proposed in this paper is consistent with the conclusion of the ratio of lead-boron-polyethylene shielding materials optimized based on genetic algorithm, which proves the effectiveness of the evaluation method proposed in this paper. Meanwhile, the evaluation index system of this method is more comprehensive, and the evaluation method is more efficient and scientific as well, which has a good promotion prospects and application advantages.
In the process of nuclear fission, reactor may produce various radiation rays, including particle
The basic principle of radiation shielding protection is shown as Figure 1.
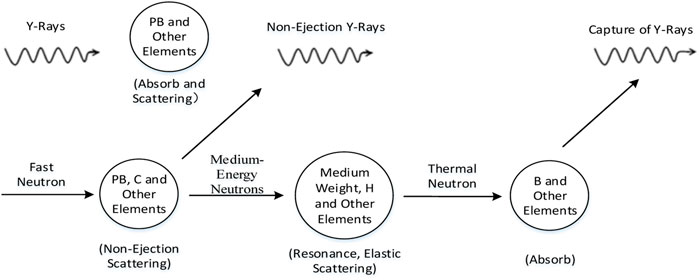
FIGURE 1. Schematic diagram of shielding principle for common shielding materials.
In 1981, C.L. Hwang and K. Yoon first proposed the concept of ideal solution (Hwang and Yoon, 1981) (Technique for Order Preference by Similarity, TOPSIS), which examines the closeness between the scheme to be decided and the ideal scheme by constructing positive and negative ideal solutions to multi-index decision-making problems, so as to take the result as a basis for judging the advantages and disadvantages of the evaluation scheme. However, as the research continues, the disadvantages of the traditional TOPSIS method are becoming more and more obvious. Literature (Li et al., 2015a) believes that the traditional TOPSIS ideal solution is unstable, and the evaluation efficiency is defined and limited by the influence of multi-dimensional spatial distance change, literature (Huang and Zheng, 2001) points out that due to the existence of relative ideal points, the use of TOPSIS method will produce reverse order problems, and must be eliminated by constructing GTOPSIS method.
On the basis of the studies above, the traditional TOPSIS method is difficult to adapt to the complex evaluation environment, so effective improvement of the traditional TOPSIS method shall be an important way to improve the scientific evaluation effect. By introducing the interval number theory, reference (Jahanshahloo et al., 2005) and reference (Jahanshahloo et al., 2008) solve the uncertainty of data index observation when TOPSIS is applied to multi-index decision-making problem to a certain extent. Reference (Li et al., 2021a) pointed out that since the ideal solution concept of interval number proposed by Jahanshahlo in reference (Jahanshahloo et al., 2005) and reference (Jahanshahloo et al., 2008) is a virtual exact solution, there exists a risk of error ordering. In order to solve this problem, it is necessary to use the direct interval number ideal solution method to evaluate and improve. Reference (Opricovic and Tzeng, 2004) and (Opricovic and Tzeng, 2007) has applied the extended VIKOR method on multi-index decision-making problems with interval number, extending the effective application scope of TOPSIS.
For this reason, this paper defines a basic problem of performance evaluation of composite shielding materials in line with the real environment, takes the feasibility study of TOPSIS extension method (Chen and Zhang, 2015; Ke and Wang, 2020) as the premise, puts forward the concept of gray correlation projection angle based on gray correlation theory, and establishes a TOPSIS performance evaluation model based on gray correlation projection algorithm. On this basis, this paper takes the basic assumption that there is a multivariate non-linear interaction between each index. Analytic Network Process (ANP) has the advantage in the construction of non-linear network (Yu et al., 2020; Li et al., 2021b; Li, Zhou), and the non-linear weighting of index set is realized by taking multiple non-linear interaction effects among indicators as the basic assumption. Finally, an improved TOPSIS-ANP material performance evaluation model based on gray relational projection algorithm was formed.
The so-called weighting problem of composite shielding materials refers to the establishment of performance evaluation index system panel data on the basis of the establishment of performance evaluation indicators of composite shielding materials, together with the formation of composite two-dimensional plane data composed of evaluation objects and multi-level performance evaluation index systems. Based on this, the weight determination research problem is carried out under the comprehensive action of the object and the multi-level performance evaluation composite index.
Definition 1. The vector formed by a given set of evaluation objects is
Definition 2. Given that
In this case, the metric set weight is
In the above equation, finding a reasonable weight
The improved TOPSIS-ANP evaluation method based on gray relational projection algorithm is derived from the extension of the classical TOPSIS method. By normalizing the decision matrix, this method finds out the positive ideal solution and the negative ideal solution of the problem to be evaluated. Then, with the help of the mathematical projection relation, calculates the projection closeness between the feasible solution and the positive and negative ideal solution under the influence of non-linear weight, and transforms the complex weighting problem into dimension reduction (Yu, 2020), so as to evaluate the advantages and disadvantages of each feasible scheme. The algorithm implementation steps are as follows:
STEP 1. Evaluation object data preprocessing. Using the 0–1 extreme value treatment method (Xu and Li, 2020), the dimensional and order of magnitude influence between indicators are eliminated to ensure comparability between indicators. The basic formulas are as follows:
In the (Eqs 3–6) equation above, the 0-1 extreme value conversion formula of positive indicators, negative indicators, intermediate indicators and comment (interval) indicators are represented in order. Where,
STEP 2. Define the ideal solution. With reference to time
STEP 3. Establish an ideal gray correlation coefficient matrix. Referring to the grey correlation analysis principle, taking the positive ideal scheme
Where,
Where,
STEP 4. DETERMINE THE INDICATOR SET. The use of ANP to determine the index set requires the establishment of an ANP structure model, including the control layer and the network layer. Then, the index weight
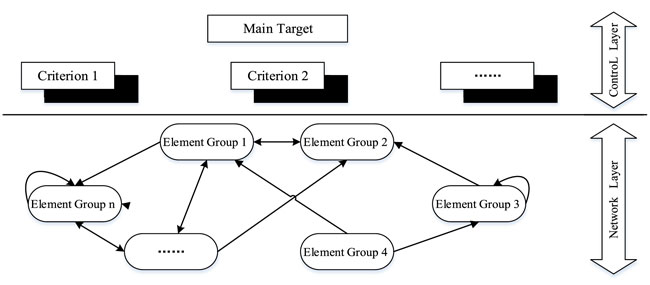
FIGURE 2. ANP network structure principle.
STEP 5. Calculate gray projection closeness. Considering the influence of the index set weights on the original coefficient matrix, let
Where
Let the angle between the two row vectors
The projected value of
Based on this, the positive and negative ideal gray correlation projection values are obtained and simply written as:
In equation
Therefore, the closeness degree of gray relation projection is:
Where, the value of
The comprehensive performance of composite shielding materials shall include a number of quantifiable evaluation indexes, which can be divided into level 1 indexes, level 2 indexes and level 3 indexes according to the level of influence. The level 1 indexes include basic properties, physical properties and chemical properties. The level 2 indexes are further divided into seven evaluation dimensions: density properties, process properties, shielding properties, mechanical properties, thermal properties, flame retardant properties and tolerance. The level 3 indicators select the most representative one to three observable quantitative indicators of each dimension for quantitative evaluation and focus on reflecting the comprehensive performance of composite shielding materials. The specific indicator system is shown in Table 1.
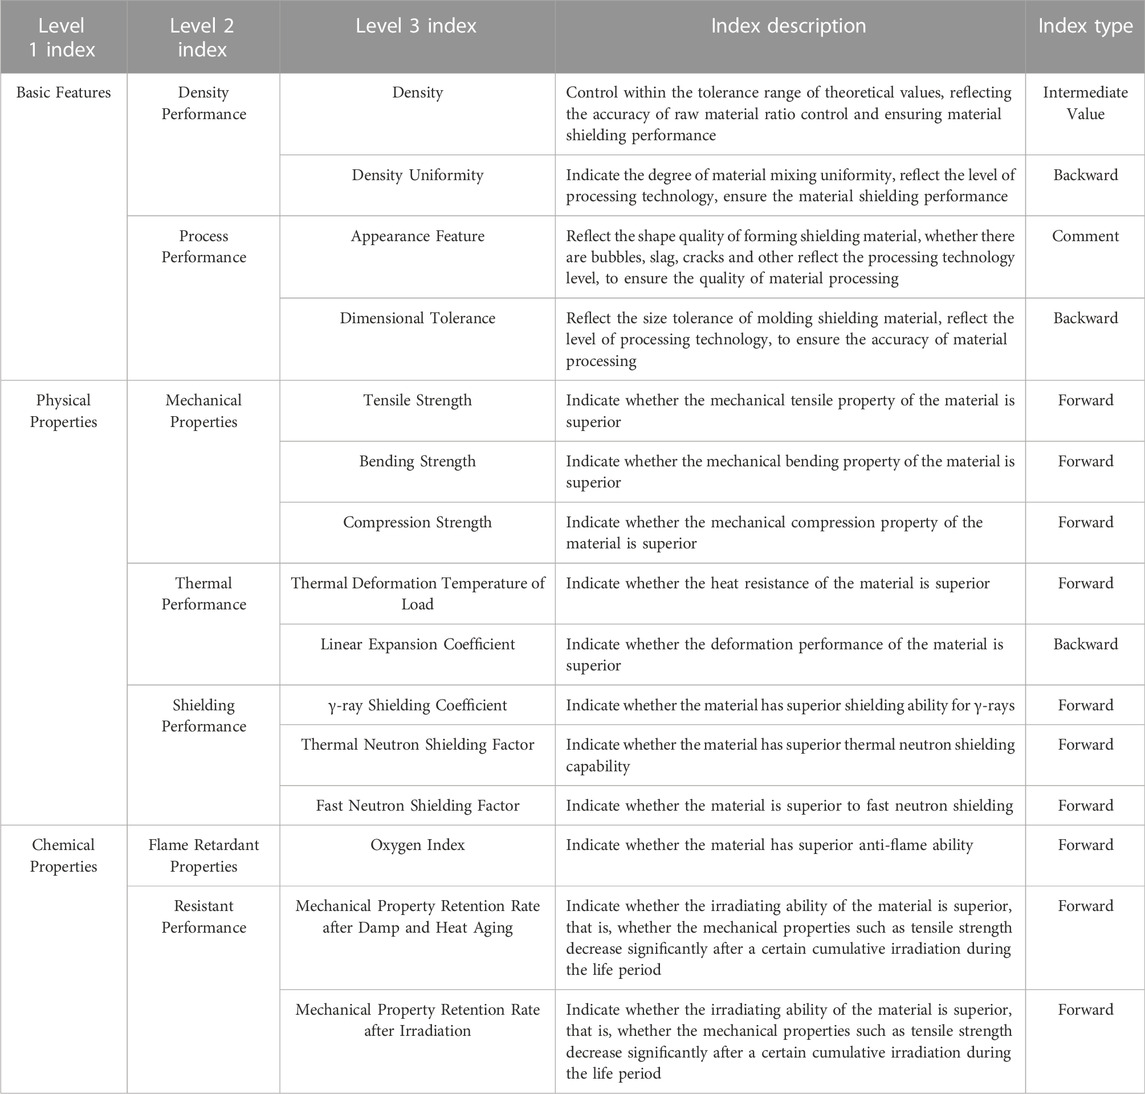
TABLE 1. Composite shielding material performance evaluation index system and index description.
This section uses a lead-boron polyethylene composite shielding material as an example to verify the applicability of the improved TOPSIS-ANP evaluation model of the gray correlation projection algorithm. In order to ensure the comparability of the research, five domestic suppliers A, B, C, D and E with the production capacity of lead-boron-polyethylene composite shielding materials in 2022 are selected as the research objects. The performance characteristics of their lead-boron-polyethylene shielding materials are investigated, and the advantages and disadvantages are compared. According to the basic idea of composite shielding material performance evaluation index system established in Table 1, some indexes were refined to design the performance evaluation index system of marine lead-boron-polyethylene composite shielding material, which completely covered the specific content of all aspects of the performance of the composite shielding material, and defined the reference value range of each indexe in level 3. According to the source term characteristics of PWR reactor, based on theoretical design and engineering application experience, a comprehensive optimization index of lead boron polyethylene composite shielding material is proposed. See Table 2 for details.
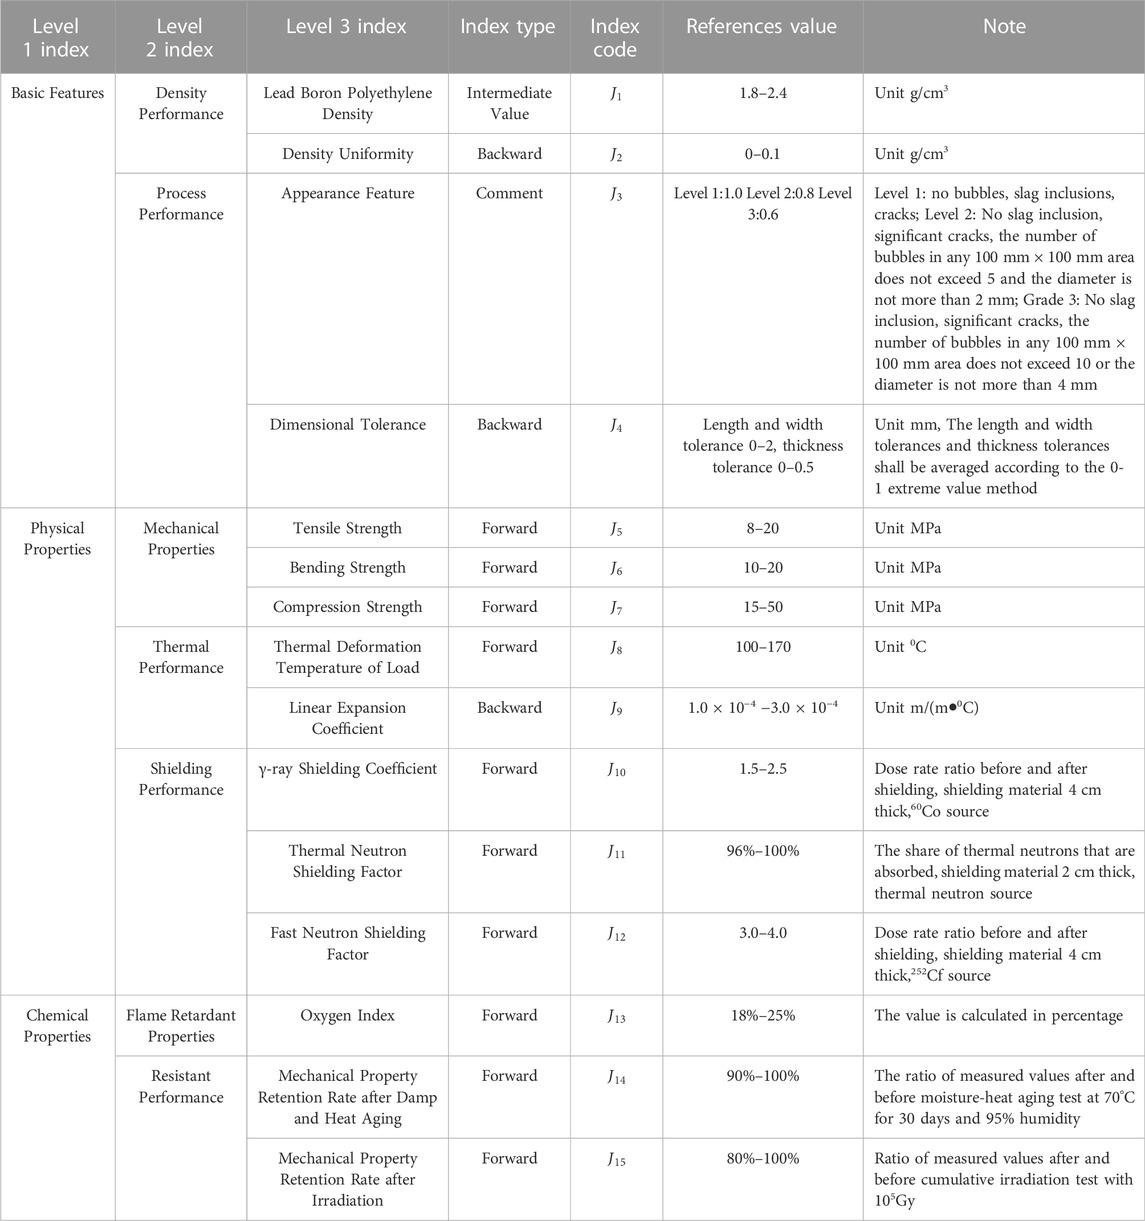
TABLE 2. Performance evaluation index system and numerical reference standard of PB-PE composite shielding materials.
In 2022, the shielding material products provided by 5 domestic lead-boron polyethylene composite shielding material suppliers were sampled and tested, the original data was collected, sorted out and summarized, and the data was processed in advance according to the 0-1 extreme value treatment method given in Eqs 3–6, and the original data and processed results in advance are detailed in Table 3.

TABLE 3. Data collection and processing of lead-boron polyethylene composite shielding material products provided by five suppliers.
Therefore, the ideal scheme and the correlation coefficient matrix of the scheme to be evaluated were determined, and the positive, negative ideal scheme and the ideal gray correlation coefficient matrix were calculated.
The ANP network structure model for performance evaluation of composite shielding materials with the core architecture of “Control Layer—Network Layer” is established by using ANP for index weighting. The basic structure is described as follows: the control layer is a first-level indicator, the network layer is a binary structure, the second-level indicator is set as a group, and the third-level indicator is set as a node. Each group and node is an internal network relationship that influences each other and is controlled by the control layer. The ANP network was constructed under the main interface of the Super Decision software, the connection direction and dominance relationship between each group and node were established, and the index weight was determined after the ultimate super matrix was calculated. The visualization interface of related processes was shown in Figures 3, 4. Using the principle of gray projection Angle, the positive and negative ideal gray correlation projection values are calculated, and then the gray correlation projection closeness is obtained. The specific values are shown in Table 4.
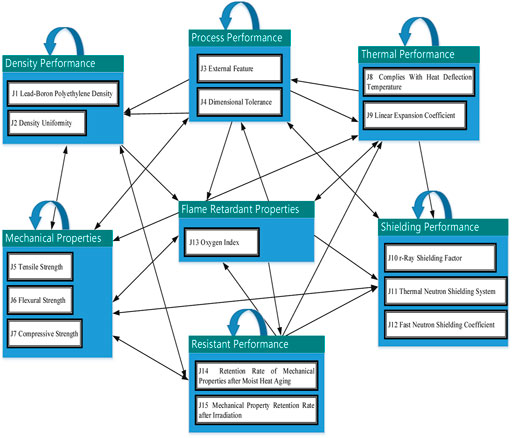
FIGURE 3. ANP network structure of composite shielding material performance evaluation.
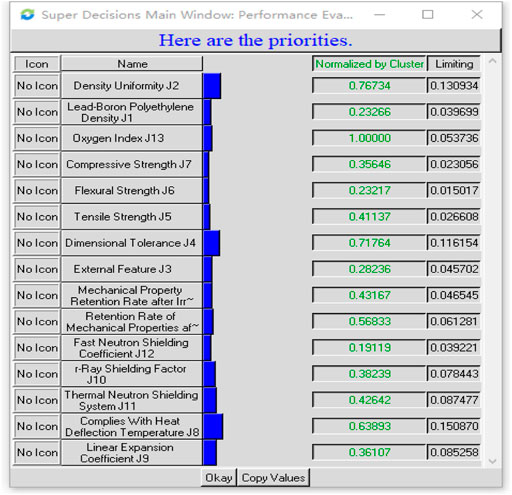
FIGURE 4. Priority level of indicators under limit super-matrix (centralized weight of indicators).
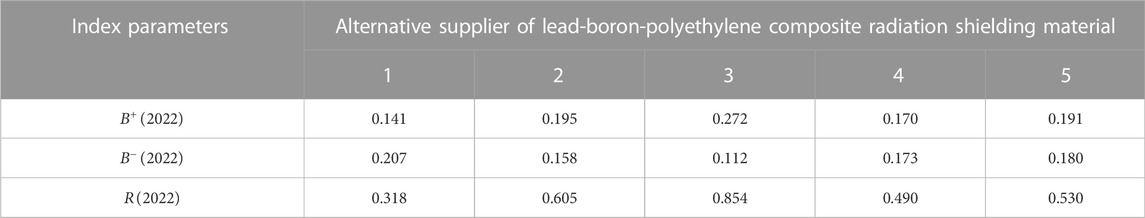
TABLE 4. Comparison of TOPSIS-ANP grey relational projection values and closeness.
According to the data shown in Table 4,
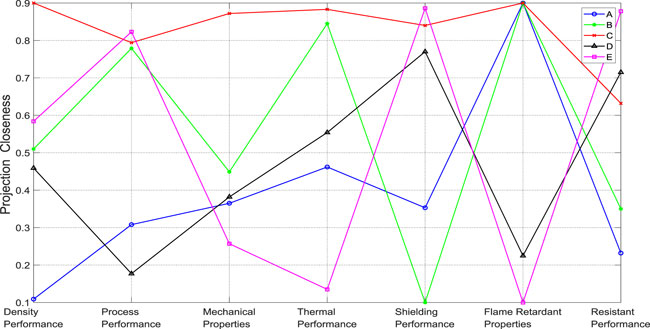
FIGURE 5. Performance Comparison of Five Lead-Boron Polyethylene Composite Radiation Shielding Materials (as seven dimensions).
Figure 5 shows the differences in the performance of five lead-boron-polyethylene composite radiation shielding materials in seven dimensions. Although the shielding material provided by supplier C is the best solution, from the perspective of sub-indexes, supplier C still has a large room for improvement in the two indexes of process performance and tolerance of the shielding material.
The basic idea of validity test is to compare the results of the traditional composite shielding material performance evaluation method with the proposed algorithm, so as to prove the superiority of the proposed algorithm. The matching design of composite shielding materials is a multi-objective optimization problem with constraints. As an effective random search method, genetic algorithm has the characteristics of global optimum, good consistency and convergence, etc, which has good adaptability to solve the multi-objective optimization problem with constraints, and has been widely used in many fields with better results. Some achievements have been achieved in the design of lead-boron-polyethylene composite shielding materials with this method (Li et al., 2015b). Therefore, this section adopts the optimization design of shielding materials based on genetic algorithm for example verification, and compares the results with those of the improved TOPSIS-ANP algorithm to demonstrate the rationality and reliability of this method.
Genetic algorithm (Holland, 1975) is a computer random global search and optimization method developed by imitating the biological evolution mechanism in nature. In the process of implementing genetic algorithm, the commonly used tools for optimizing the design of lead-boron-polyethylene composite shielding materials are GENOCOP program (Michalewicz and Nazhiyath, 1995; Michalewicz and JanikowGENOCOP, 1996) and MCNP program (X-5 Monte Carlo Team, 2003).
In this case, GENOCOPⅢ is used, which combines the feasible solution search method with the genetic algorithm to solve the optimization problem of the composition ratio of constrained composite shielding materials based on the repair of the infeasible solution, improving the computational efficiency and accuracy of the calculation results of the genetic algorithm. Also in this case, MCNP five is used to calculate the equivalent dose rate of neutron and γ-rays after passing through lead-boron-polyethylene composite shielding material.
According to the characteristics of PWR reactor source, the shielding thickness and the composition ratio of Pb/BPE composite shielding material were optimized for the combination of Pb/BPE composite shielding material.
In the input file of MCNP software, the flux-dose conversion factor of rays is added to make the results in the output file output with the dose value, and the dose value is extracted as the objective function of the genetic algorithm. The shielding design is to minimize the dose generated after the rays pass through the material through the optimal design of the components and structure of the shielding material, which can be expressed by Eq. 24. In the formula, the thermal conductivity of the material, the mechanical properties of the material and the weight of the whole multi-layer shield are considered, namely:
In equation:
Equation 23 through Eq.26 are the constraint conditions:
Where, Eq. 23 represents that the sum of material components of each layer is 1; Eq. 24 indicates that the sum of the thickness ratio of each layer is 1; Eq. 25 indicates that the mass fraction of each material is between 0 and 1; Eq. 26 The ratio between the thickness of each layer and the total thickness is between 0.01 and 1.00.
The key of multi-objective optimization design is to make clear the relationship between each sub-objective: independent or interrelated. In the initial research, by referring to the existing research basis and reasonable assumptions, the functional relationship between the weight factor of each sub-target and the related sub-target was given. The design reference parameter selects the performance parameter of the existing radiation shielding material with excellent performance or predicts the optimal value of the single performance of the material. Finally, an optimized overall objective is determined by dimensionless and weighted summation of the sub-objectives.
After each sub-objective is dimensionless, Eq. 20 becomes:
The mechanical model is based on the Kerner method, which is commonly used to predict the particle reinforced composites, and the reinforced boron carbide is spherical and uniformly dispersed. The volume modulus, shear modulus, Poisson’s ratio and elastic modulus are shown in Eqs 28, 29.
Where:
Thermal conductivity indicates the thermal conductivity of a material. Materials with high thermal conductivity are easy to release heat. Generally speaking, for shielding materials, the higher the thermal conductivity, the better. In this example, the Nielsen-Lewis model was used as the sub-target to optimize the thermal conductivity, and the Nielsen model was shown in Eqs 32–34.
Where,
In equation: A ——correlation constant of particle shape and orientation; B —— thermal conductivity constant of each component;
The e multi-objective optimization design process of lead-boron-polyethylene composite shielding material is shown in Figure 6.
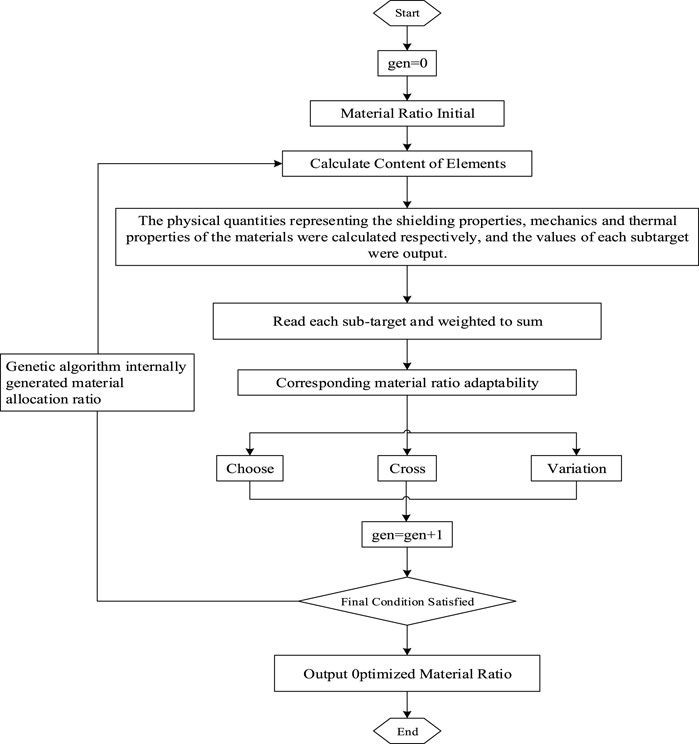
FIGURE 6. Flow chart of integrated optimization design of shielding component structure.
According to the flow chart shown in Figure 6, the multi-objective optimization design of the material was carried out. Assuming that the total thickness of the Pb + Pb boron-polyethylene composite shielding material was 20 cm, when the 235U induced fission energy spectrum was taken as the radiation source, the result was: thickness ratio of 0.375: 0.625, that is, the thickness of the first layer of lead plate is 7.5 cm, and the thickness of the second layer of lead-boron-polyethylene composite shielding material is 12.5 cm. Meanwhile, the mass fraction of lead and boron carbide in the lead-boron-polyethylene composite shielding material is 55.3% and 8%, respectively, and the density is 2.11 g/cm3.
In summary, the density of a lead-boron-polyethylene composite shielding material optimized based on genetic algorithm is about 2.11 g/cm3, which is consistent with the results of the improved TOPSIS-ANP evaluation method. However, the optimal design results based on the genetic algorithm only considered the neutron and γ-ray shielding properties, density, mechanical properties, thermal conductivity and other factors, while the composite shielding material evaluated by the TOPSIS-ANP method based on the improved gray relational projection algorithm is more comprehensive and easier to calculate.
This paper introduces an improved TOPSS-ANP evaluation method based on gray relational projection algorithm, which takes five main suppliers of lead boron-polyethylene composite shielding materials in China in 2022 as the research object, so as to conduct a comprehensive evaluation of the performance of lead boron-polyethylene composite shielding materials. From the characteristics of the method, the method is designed according to the principle of gray projection angle, and the non-linear weighting idea is used to determine the quality of indicators by examining the relationship between the projection of each indicator dimension and the target value. Because the manufacturing process and industrial technology of shielding materials are not involved in the performance evaluation process, this method is widely used and can be extended to the performance evaluation of other composite shielding materials. The evaluation index system is comprehensive and objective, the evaluation process is scientific and reasonable, and the final evaluation conclusion has strong credibility as well.
The original contributions presented in the study are included in the article/Supplementary Material, further inquiries can be directed to the corresponding authors.
KZ proposed a weighted projection model of composite shielding materials based on the extended TOPSIS theory, clarified the principle and algorithm implementation of projection dimension reduction, and carried out an empirical test. XL, HW, SL, KS are responsible for the collection of original data, the collation and analysis of calculation results.
Foundation item: National Social Science Foundation of China (19CGL073).
The authors declare that the research was conducted in the absence of any commercial or financial relationships that could be construed as a potential conflict of interest.
All claims expressed in this article are solely those of the authors and do not necessarily represent those of their affiliated organizations, or those of the publisher, the editors and the reviewers. Any product that may be evaluated in this article, or claim that may be made by its manufacturer, is not guaranteed or endorsed by the publisher.
Celli, M., Grazzi, F., and Zoppi, M. (2006). A new ceramic material for shielding pulsed neutron scattering instruments. Nucl. Instrum. methods Phys. reserarch 565 (A565), 861–863. doi:10.1016/j.nima.2006.05.234
Chen, Y. H., and Zhang, H. (2015). Approach to COA selection based on PSO and extend TOPSIS. Syst. Eng. — Theory & Pract. 25 (8), 2144–2151.
Courtney, E. H. (2008). High density polyethylene/boron containing composites for radiation shielding applications. Ann Arbor, Ml, USA: ProQuest LLC.
Hayashi, T., Tobita, K., Nakamori, Y., and Orimo, S. (2009). Advanced neutron shielding material using zirconium borohydride and zirconium hydride. J. Nucl. Mater. 386, 119–121. doi:10.1016/j.jnucmat.2008.12.073
Holland, J. H. (1975). Adaptation in natural and artificial systems. Ann ArborMl, USA: University of Michigan Press.
Huang, D. C., and Zheng, H. R. (2001). Study on the problem and elimination of rank reversal existing in ideal point multiple attribute decision making. Syst. Eng. Electron. 23 (12), 80–83.
Hwang, C. L., and Yoon, K. (1981). Multiple attribute decision making: Methods and applications, a state of the art survey. Berlin, Germany: Springer-Verlag.
Jahanshahloo, G. R., Lotfi, F. H., and Davoodi, A. R. (2008). Extension of TOPSIS for decision-making problems with interval data: Interval efficiency. Math. Comput. Model. 49 (5), 1137–1142. doi:10.1016/j.mcm.2008.07.009
Jahanshahloo, G. R., Lotfi, F. H., and Izadikhah, M. (2005). An algorithmic method to extend TOPSIS for decision-making problems with interval data. Appl. Math. Comput. 175 (2), 1375–1384. doi:10.1016/j.amc.2005.08.048
Ke, W. J., and Wang, J. (2020). Evaluation of urban higher education resource carrying capacity based on entropy weight TOPSIS model. Statistics Decis. 18 (18), 50–53.
Koichi, O. (2005). Neutron shielding material based on colemanite and epoxy resin. Radiat. Prot. Dosim. 115 (1-4), 258–261. doi:10.1093/rpd/nci154
Lacey, M. (2021). What is “Energy Transition” and why does it matter to investors. [EB/OL].https://www.schroders.com/en/insights/economics/what-is-energy-transition-and-why-does-it-matter-to-investors/ (Accessed June 18, 2022).
Li, C. B., Zhang, J. Y., Gu, Y. D., and Qi, Z. Q. (2015a). Method for fuzzy-stochastic multi-criteria decision-making based on prospect theory and improved TOPSIS with its application [j]. Operations Res. Manag. Sci. 24 (2), 92–100.
Li, J. W., Zhao, D. Q., Wang, D. M., Cai, C. C., Jia, X. X., and Zhang, L. T. (2021b). A quality evaluation method for wavelet denoising based on combinatorial weighting method. J. Beijing Univ. Aeronautics Astronautics 48 (9), 1–10.
Li, M. J., Pan, Y. X., Xu, L. M., and Lu, J. C. (2021a). Improved dynamic TOPSIS evaluation method of interval numbers. J. Syst. Sci. Math. Sci. 41 (7), 1891–1904.
Li, W., and Zhou, Q. Z. (2017). Research on evaluation of oil support capability and scope based on ANP[J]. Mil. Operations Res. Syst. Eng. 31 (2), 48–53.
Li, X., Yu, F., Sun, L., Wu, R., Chen, Y., and Zuo, L. (2015b). Optimal design of composition ratio of lead-boron polyethylene composite shielding Material[J]. Ship Sci. Technol. 37 (12), 148–154.
Liao, L. (2010). Optimum design of component content of shielding materials. Hengyang, China: University of south China.
Lu, J., and Chen, J. (1994). High effective shielding material lead-boron polyethylene. Nucl. Power Eng. 15 (4), 370–374.
Michalewicz, Z., and JanikowGENOCOP, C. (1996). A genetic algorithm for numerical optimization problem with Linear constrains. Commun. ACM 39 (12), 175–201. doi:10.1145/272682.272711
Michalewicz, Z., and Nazhiyath, G. GenocopⅢ:A co-evolutionary algorithm for numerical optimization problems with nonlinear constraints. IEEE Int. Conf. Evol. Comput. Perth, Australia, 1995:647-651.
Opricovic, S., and Tzeng, G. H. (2004). Compromise solution by mcdm methods: A comparative analysis of VIKOR and TOPSIS. Eur. J. Operational Res. 156 (2), 445–455. doi:10.1016/s0377-2217(03)00020-1
Opricovic, S., and Tzeng, G. H. (2007). Extended VIKOR method in comparison with outranking methods. Eur. J. Operational Res. 178 (2), 514–529. doi:10.1016/j.ejor.2006.01.020
Sun, H. C., Tian, P., and Wang, L. F. (2011). Network analytic hierarchy process and decision science. Beijing, China: National Defense Industry Press.
Sun, Y., Li, M., Wang, C., Han, Y., and Li, G. (2021). Evaluation of X/γ-ray shielding properties of heavy metal oxide glass. Mater. Rev. 35 (S2), 101–106,126.
Wang, L., Zhao, M., and Chen, Z. (2021). Research progress of nuclear radiation shielding and materials. Chin. J. Appl. Chem. 38 (12), 1576–1587.
X-5 Monte Carlo Team, (2003). Mcnp: A general Monte Carlo N-particle transport code, version 5. Los Alamos, NM: Los Alamos National Laboratory. LA-UR-03-1987 April 24.
Xu, L. M., and Li, M. J. (2020). A data preprocessing method in dynamic comprehensive evaluation. Chin. J. Manag. Sci. 28 (1), 162–169.
Yu, L. P. (2020). Structural equation dimensionality reduction: A new method of dimensionality reduction for academic evaluation indexes. J. Inf. Resour. Manag. 65 (5), 76–84.
Yu, M. G., Yu, X. H., Quan, J. C., and Kang, K. (2020). Task-oriented and ANP-based requirement satisfactory degree analysis method for net-centric information system-of-systems [j]. Syst. Eng. — Theory & Pract. 40 (3), 795–806.
Keywords: composite shielding material, nuclear radiation protection, TOPSIS, grey relational projection algorithm, network hierarchy analysis
Citation: Zhang K, Liang X, Wei H, Liu S and Su K (2023) An improved TOPSIS-ANP composite shielding material performance evaluation method based on gray relational projection algorithm. Front. Energy Res. 10:1102997. doi: 10.3389/fenrg.2022.1102997
Received: 19 November 2022; Accepted: 07 December 2022;
Published: 24 January 2023.
Edited by:
Xinyu Wei, Xi’an Jiaotong University, ChinaReviewed by:
Zhaobin Chen, Changchun Institute of Applied Chemistry (CAS), ChinaCopyright © 2023 Zhang, Liang, Wei, Liu and Su. This is an open-access article distributed under the terms of the Creative Commons Attribution License (CC BY). The use, distribution or reproduction in other forums is permitted, provided the original author(s) and the copyright owner(s) are credited and that the original publication in this journal is cited, in accordance with accepted academic practice. No use, distribution or reproduction is permitted which does not comply with these terms.
*Correspondence: Kan Zhang, NzE5MjczMzU2QHFxLmNvbQ==; Kai Su, a2VwcGVsc3VlQDE2My5jb20=
Disclaimer: All claims expressed in this article are solely those of the authors and do not necessarily represent those of their affiliated organizations, or those of the publisher, the editors and the reviewers. Any product that may be evaluated in this article or claim that may be made by its manufacturer is not guaranteed or endorsed by the publisher.
Research integrity at Frontiers
Learn more about the work of our research integrity team to safeguard the quality of each article we publish.