 Siyuan Liu1,2,3
 Yongqiang Zhang
 Yong Zhu
95% of researchers rate our articles as excellent or good
Learn more about the work of our research integrity team to safeguard the quality of each article we publish.
Find out more
ORIGINAL RESEARCH article
Front. Energy Res. , 09 January 2023
Sec. Process and Energy Systems Engineering
Volume 10 - 2022 | https://doi.org/10.3389/fenrg.2022.1096633
This article is part of the Research Topic Design, Simulation and Optimization of Hydraulic Machinery, Volume II View all 9 articles
In practical engineering, it is very difficult to obtain data on the slipper wear of hydraulic pumps, especially under high-speed, high-pressure conditions, which limits the development of fault diagnosis technology for hydraulic pumps. At present, a test method that can accurately simulate the operating state of the slipper pair under high-speed and high-pressure conditions does not exist. The reliable load-bearing design of the slipper pair is difficult to carry out effectivetest verification, which limits the development of high-speed and high-pressure piston pumps. Therefore, an experimental design method was proposed to directly simulate the high-speed, high-pressure friction state of the slipper pair based on the change law of reprinting residual pressing force.
The hydraulic pump is the core power component of major hydraulic equipment fields, such as aerospace (Zhang et al., 2021), large engineering and construction machinery (Tang et al., 2021a), and ships (Du et al., 2021). Once failure occurs, the system will be paralyzed, causing potentially serious consequences of destruction and even death. At present, scholars attach great importance to the fault diagnosis of high-speed, high-pressure hydraulic pumps, which has become an important research direction in the field of fault diagnosis (Tang et al., 2022a; Zhu et al., 2022). As a moving component with the most complex motion mechanism and the most severe working environments (Chao et al., 2018; Wang and Shi, 2021), the slipper pair easily leads to wear failure (Wu and Yu, 2018; Guo et al., 2020). However, due to the closure of the hydraulic pump structure, the fault concealment is extremely strong, and the fault data are difficult to obtain, especially under high-speed and high-pressure conditions (Tang et al., 2021b; Tang et al., 2022b; Tang et al., 2022c). At present, fault data are mostly acquired by collecting the fault signals during the actual operation of the pump, resulting in the required fault data collection being difficult and rare. An effective simulation method for slipper wear faults could be designed to simulate the friction state of slipper wear and obtain the complete characteristic information of slipper wear faults. The difficulty of obtaining slipper wear fault data in high-speed, high-pressure piston pumps is reduced to solve the problem of uneven sample data in fault diagnosis of the hydraulic pumps.
Much research has been performed on the design and development of piston pump slipper pair test rigs. Iboshi and Yamaguchi proposed a rotating swashplate test rig to measure oil film thickness and the pressure between the slipper and the swashplate at a pressure of 7 MPa (Iboshi and Yamaguchi, 1982). Markus and Koskinen from Finland built a test rig in the field of water hydraulics and investigated the relationship between oil film thickness and swashplate tilt angle (Markus et al., 2008). In Korea, Hong and Kwon designed a test bench simulator with a similar height to the actual pump swashplate and investigated the power loss, leakage, and friction characteristics of the swashplate at a low-speed range (Hong and Kwon, 2014). Hashemi et al. designed a single plunger pump test bench to test and analyze the friction characteristics at 500 rpm and 17 MPa (Hashemi et al., 2017). A new test rig was designed at Purdue University, USA, to maintain a high degree of similarity to a real pump and to measure the oil film thickness of the slipper pair at 1,000–2000 rpm (Schenk, 2014; Spencer, 2014; Ivantysyn and Weber, 2016; Beale, 2017). Zhang et al. built a test rig to detect the spin of the sliding shoe based on a conventional pump and creatively measured the spin of the slipper pair (Zhang et al., 2017). J. H. Jiang et al. designed a test rig for friction power loss between the slipper and the swashplate and analyzed the influence of slipper microstructure on the lubrication performance of the slipper–swashplate interface in depth (Jiang et al., 2020). Tang of Wenzhou University and colleagues improved the original structure of the slipper pair and swashplate of the piston pump to measure the oil film thickness and temperature of the slipper pair (Tang et al., 2016a; Tang et al., 2016b; Tang et al., 2018). Ai of Zhejiang University and others built a test bench to explore the lubrication characteristics of the slipper pair by simulating the real pump structure. The formation and variation of lubrication film at 31.5 MPa and 3,000 rpm were investigated (Ai et al., 2004). Chao et al. designed a piston structure with a cover that can effectively alleviate the problems of volume loss, pressure fluctuation and cavitation during the operation of a high-speed, high-pressure axial piston pump (Chao et al., 2023). This investigation found that the high-speed, high-pressure state of the pump will lead to a very high compression force of the slipper pair, and the simulation of this high pressure is difficult. In the current research, the working conditions of the high-speed, high-pressure slipper pair test bed are set between 3000 rpm and 31.5 MPa, and there is still a lack of simulation test devices with higher pressure and speed (Zhou and Jing, 2020).
Much of the current research on frictional pairs has been focused on the direct simulation of their frictional state for load-bearing and lubrication characterization (Belov et al., 2021; Liang and Yang, 2021; Wang et al., 2022). Szczypinski-Sala et al. simulated the sleeve-bearing friction pair using ring specimens from Poland and investigated the lubrication performance of a TiB2 coating under different oil lubrication conditions by comparing the variation curve of the friction coefficient with the relative movement speed of the friction pair (Szczypinski-Sala and Lubas, 2018). Mao et al. from Tsinghua University used the UMT-3 tribometer to conduct steel/copper and steel/steel friction tests to investigate the tribological properties of graphene as a lubricant additive for friction substrates (Mao et al., 2021). J. Wang et al. from the China University of Geosciences measured the friction coefficients of PDC bearings under different operating conditions and proposed a theoretical model for friction measurement (Wang et al., 2020). X. Wang et al. from Shanghai Jiaotong University studied the load bearing and lubrication performance of CuAl10Fe3 sliding bearings under chromium plating and diamond-like carbon coating by comparing the torque and friction coefficient parameters (Wang et al., 2019). The afore-mentioned tests were conducted by directly simulating the friction state of the friction pair to study their tribological properties. The research is still lacking on the experimental methods and devices used to simulate high-pressure and high-speed conditions through the friction state of the slipper pair.
In this study, a friction-state simulation test rig of the slipper pair is built through the tribometer based on the change rule of the residual pressing force of the slipper pair based on the static pressure balance principle. In this test, the test piece is designed to undulate in the circumferential direction of the friction area, and several convex peaks and valleys are artificially processed. Using the mutual conversion of peaks and valleys, the periodic high-pressure difference alternating process of the residual pressing force in the suction area and the oil discharge area is simulated under the high-pressure condition of the actual pump. By increasing the number of peaks, the impact frequency of each week of rotation of the specimen increases, and the alternating frequency of the residual pressing force in the suction and drainage area is simulated under the high-speed condition. The test rig is verified to reproduce the alternating law of residual pressing force of the slipper pair of the real high-speed, high-pressure piston pump and can accurately simulate the friction state of the slipper pair under high-speed, high-pressure conditions.
The test rig is divided into three main parts: the oil supply system for a stable oil source, the slipper pair friction-state simulation device, and the data acquisition system. The test rig and its schematic diagram are shown in Figures 1, 2. The stable pressure oil supply system provides a constant pressure oil source for the test bed to ensure that the test results are not affected by a change in oil supply pressure. The data acquisition system is equipped with an eddy current displacement sensor and torque sensor to collect the displacement, friction torque, and other data.
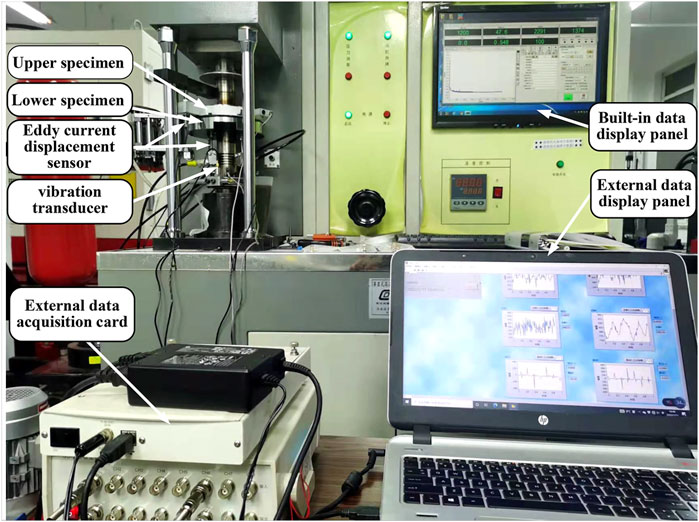
FIGURE 1. Test rig.
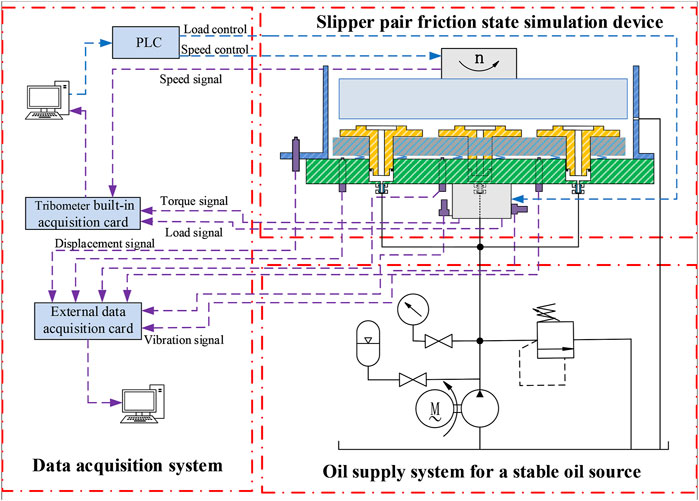
FIGURE 2. Schematic diagram of the test rig.
The slipper pair friction simulation device mainly consists of the upper specimen and the lower specimen, shown in Figure 3. The upper specimen is a surface simulation piece of the plunger pump swashplate, shown in Figure 4. The contact surface of the annular area is designed perpendicular to the surface direction, and the trajectory is a periodically changing surface structure. The lower specimen component is the slipper simulation specimen, shown in Figure 5. When it is in contact with the upper specimen and along the upper specimen’s concave and convex surface relative sliding process, the vertical direction of the force relationship is shown in Figure 6, from which the remaining compression relationship between the force
where
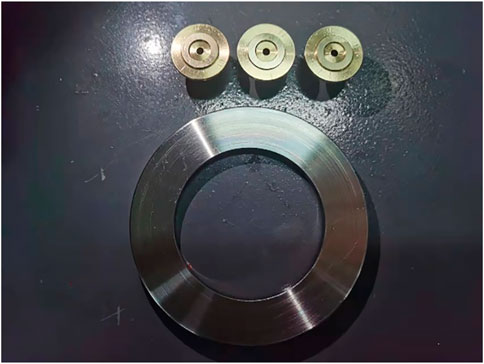
FIGURE 3. Specimen for simulation.
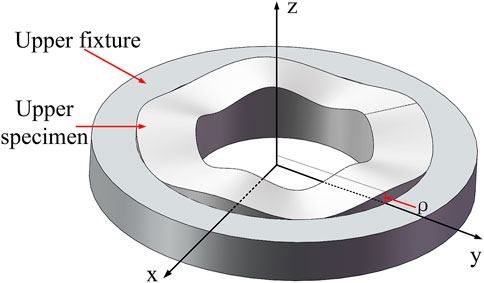
FIGURE 4. Upper specimen assembly.
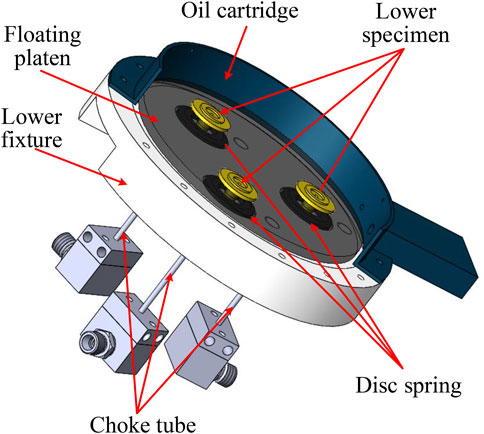
FIGURE 5. Lower specimen assembly.
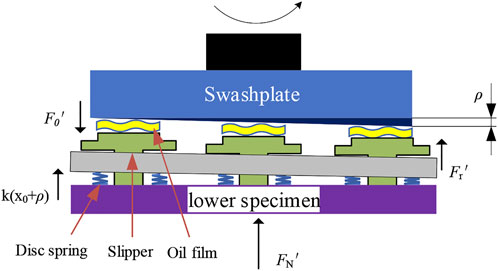
FIGURE 6. Schematic diagram of the residual pressing force simulation.
The compression force
The relationship between the frictional force Ff and the residual pressing force
where
The test rig is designed and theoretically calculated for the friction-state simulation specimen based on the variation law of the residual pressing force of the real slipper. The correctness of the simulation method will be verified by fitting the numerical simulation to the test results for comparison.
The following assumptions are made to solve the residual pressing force of the slipper pair of a real pump without considering the pressure pulsation of the plunger during the movement of the oil discharge area.
1) Each plunger chamber remains under constant pressure as the plunger moves in the suction and discharge state.
2) The plunger chamber pressure only changes with the change of suction and discharge state.
The force analysis of the slipper and plunger is shown in Figure 7.
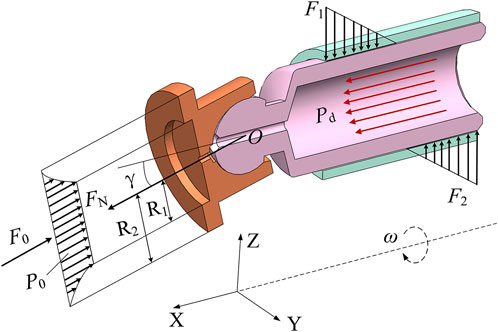
FIGURE 7. Force analysis of the slipper and plunger assembly.
It can be seen from Figure 7 that the main forces on the slipper are the axial thrust at the plunger end and the hydraulic counter thrust, while the secondary forces, such as spring force, frictional force and inertia force F′, are relatively small. This gives the magnitude of the residual pressing force as follows (Liu et al., 2017):
where
where
As the primary force is much greater than the secondary force, the oil pressure is higher at high pressure, and the switching speed is faster at high speed. The secondary force will be ignored when designing the test rig. Thus, Eq. 3 can be further simplified as
The real pump slipper pair residual pressing force variation law is obtained through the afore-mentioned comparison. The test specimen structure is designed as a concave and convex ring surface using the unevenness of the slanting disc. The height difference between the convex peak and the concave valley was used to simulate the alternating changes of the residual pressing force in the suction and discharge area, as shown in Figure 8. The trajectory equation for the amount of curve undulation variation within the concave and convex annular surface concerning the displacement of the actual slipper pair along the cylinder bore axis direction relative to the swashplate surface is assumed to be
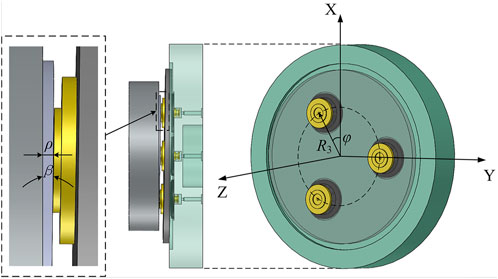
FIGURE 8. Contact diagram of two specimens at q = 1.
The maximum amount of undulation is
where
From Eq. 1, it follows that
where
According to Eq. 9, the magnitude of the residual pressing force can be simulated by varying the amount of undulation change
Combining Eq. 8 with Eq. 9 yields
The relationship between the residual pressing force Fr, the compression force FN, and the oil film support force F0 in the real pump (as in Figure 8) is
Figure 9 shows that the increase in compression force and oil film support force is much greater than the increase in the residual pressing force as the working pressure increases. When the working pressure is 16 MPa, 31.5 MPa, and 60 MPa, respectively, the pump clamping force is 10,359 N, 20,394 N, and 3,846 N, while the residual clamping force is only 60 N, 1,222 N, and 2,327 N. Therefore, although it is difficult to directly simulate the working pressure of the larger system, an estimate can be generated by simulating the smaller residual pressing force.
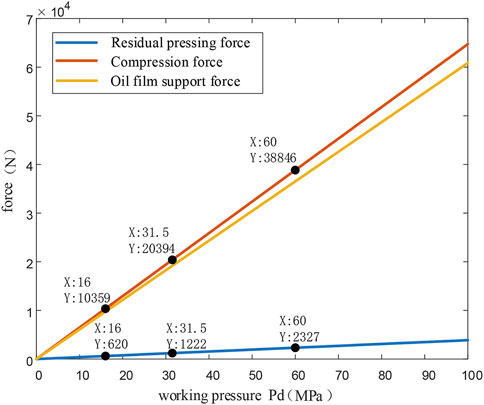
FIGURE 9. Relationship between residual pressing force, compression force, oil film support force, and working pressure.
The rated speed of the motor of the test device is set to n1. The swashplate is driven to simulate the rotation of the specimen for 1 week, then the number of changes in the undulation of the curve ρ in the concave and convex ring surface is q times. At this point, the corresponding simulated speed of the slipper is
Taking the Rexroth A11VLO190 swashplate axial piston pump as an example, the numerical simulation analysis is used to compare the proposed simulation method with the results of the actual pump.
The key structural parameters of the A11VLO190 swashplate axial piston pump slipper pair are shown in Table 1.
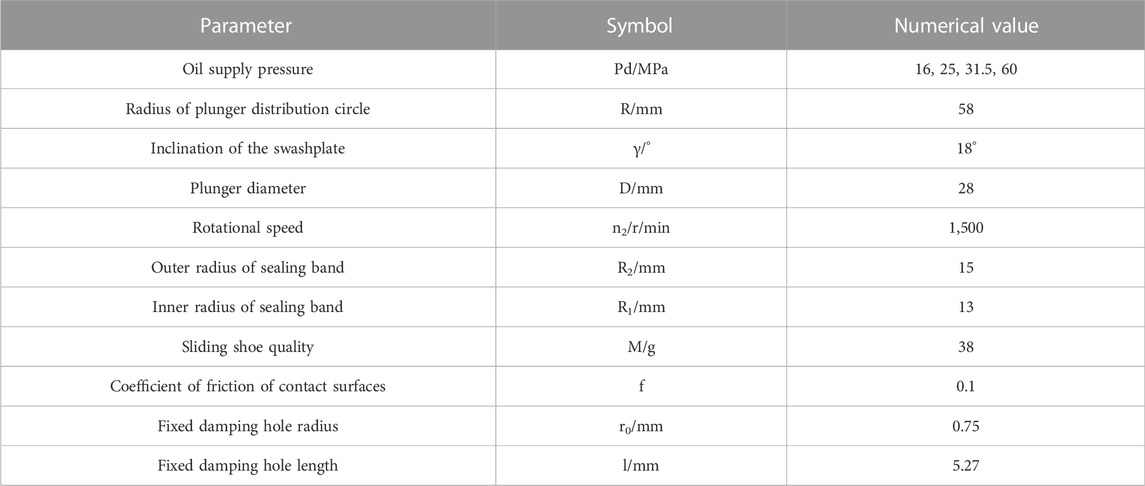
TABLE 1. Main operating parameters of the slipper pair of the Rexroth A11VLO190 swashplate axial piston pump.
According to Eq. 5, the oil chamber pressure P0 should be determined before the numerical simulation of the pump residual pressing force. The pressure drop through the fixed damping is first simulated according to the A11VLO190 swashplate axial piston pump structure, and the oil chamber pressure P0 is determined in conjunction with the oil film thickness.
The flow continuity equation gives the relationship between the oil chamber pressure and the supply pressure as
where h is the oil film thickness.
In the slipper pair, the oil film thickness is too small and could cause severe wear, greatly reducing the life of the pump. If the oil film thickness is too large, the oil leakage will be large, and the volumetric efficiency of the hydraulic pump will be reduced. Therefore, the oil film thickness h is generally designed to be between 10 μm and 40 μm. When the oil film thickness is 40 μm, the pore pressure drop with fixed damping is the largest. Eq. 13 is used with an oil film thickness of 40 μm for the simulation. The simulation results are shown in Table 3.
Combining Eq. 5 and the parameters in Tables 1 and 2, the numerical solution is carried out using MATLAB, and the simulation results are shown in Figure 10.
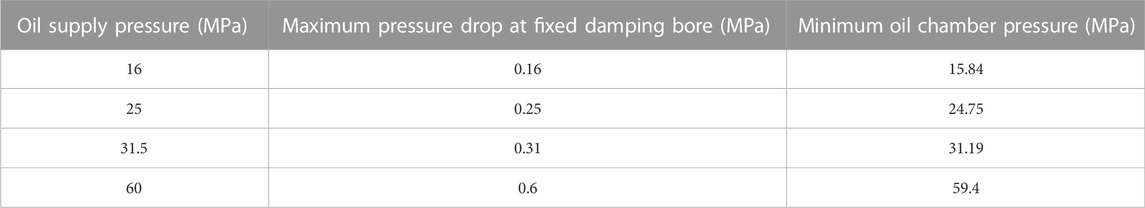
TABLE 2. Fitting parameters.
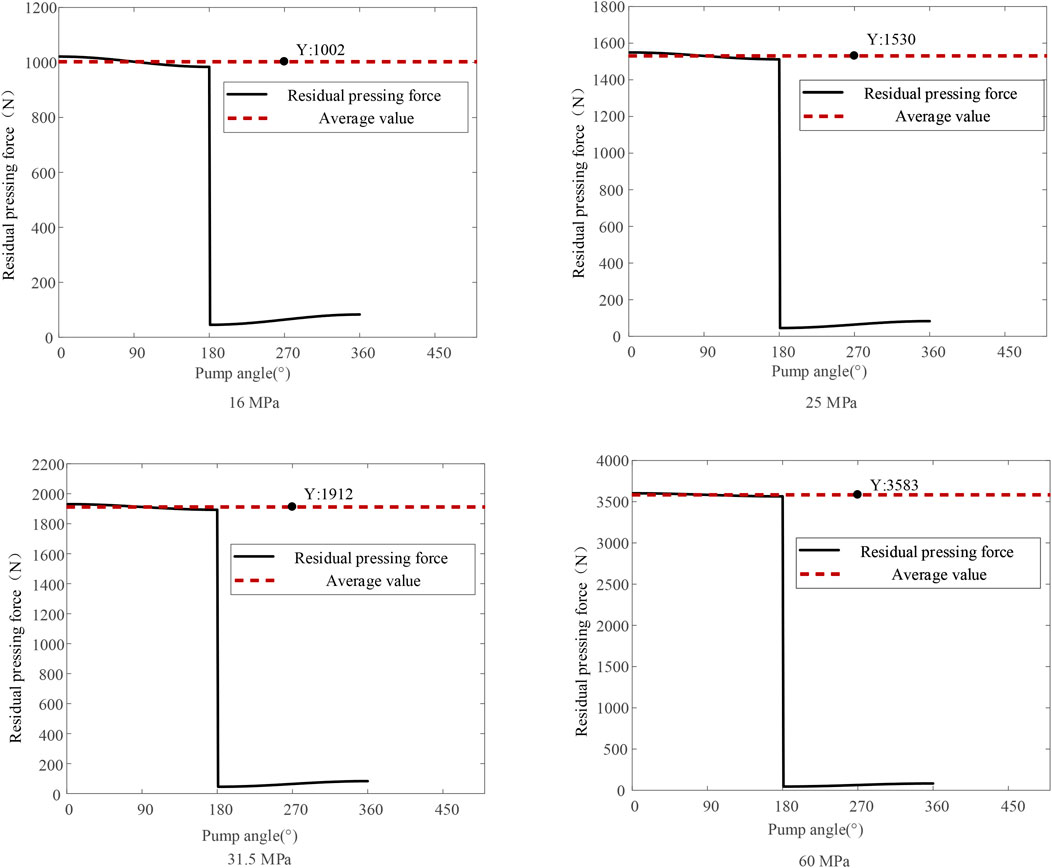
FIGURE 10. A11VLO190 swashplate axial piston pump residual pressing force size and variation pattern.
Figure 10 shows that the average residual pressing force in the oil pressure zone at 16 MPa, 25 MPa, 31.5 MPa, and 60 MPa is 1002 N, 1530 N, 1912 N, and 3583 N, respectively. When the pump rotation angle exceeds 180°, that is, after switching from high to low pressure, the residual pressing force of the pump approaches 0.
The convex peak height of the swash plate was calculated according to the simulation results in Figure 10, and Table 3 was obtained. The simulation and fitting results using MATLAB are shown in Figure 11. When the working pressure is 16 MPa, 25 MPa, 31.5 MPa, and 60 MPa, respectively, the real residual compression force of the pump is 1021 N, 1549 N, 1930 N, and 3602 N, and the maximum simulated residual compression force is 1024 N, 1554 N, 1938 N, and 3610 N. It can be seen that the variation trend of the residual pressing force of the test rig is essentially the same as that of the pump. The simulation results show that the residual pressing force of the real slipper pair can be simulated by appropriately changing the swash plate of the test rig to simulate the height of the convex peak of the specimen.
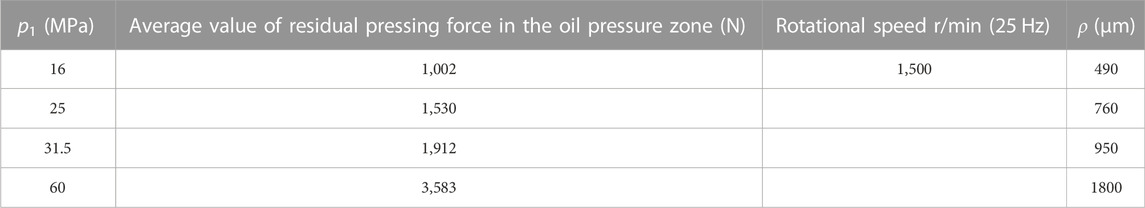
TABLE 3. Height of the convex peak of the simulated specimen on the inclined disc.
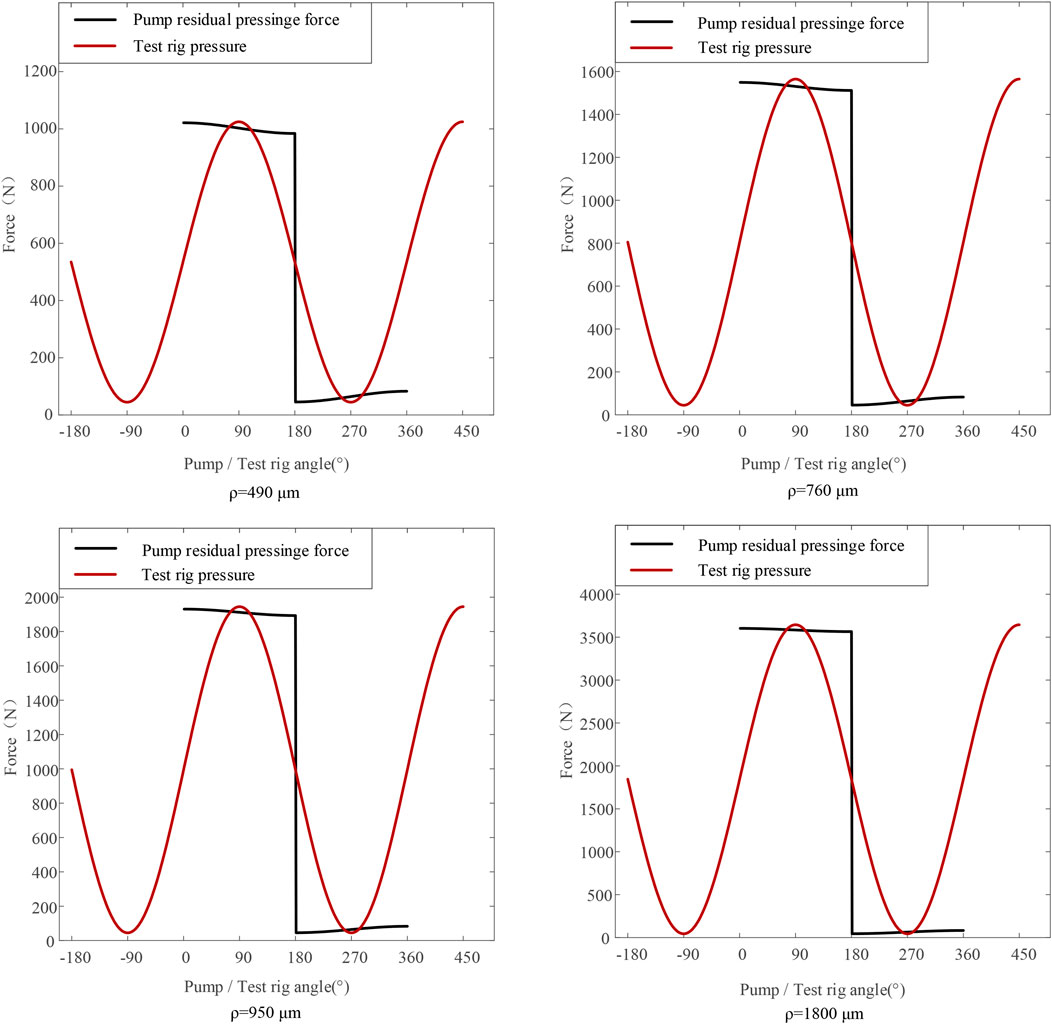
FIGURE 11. Fitted plot of the magnitude and variation of the test setup compression force at q = 1.
The fitting parameters of different pressures are shown in Table 3. The fitting simulation, according to Table 3, is shown in Figure 12. Under different simulated pressures, the variation trend of the real pump residual pressing force is the same as that of the simulated compression force, which can be well fitted.
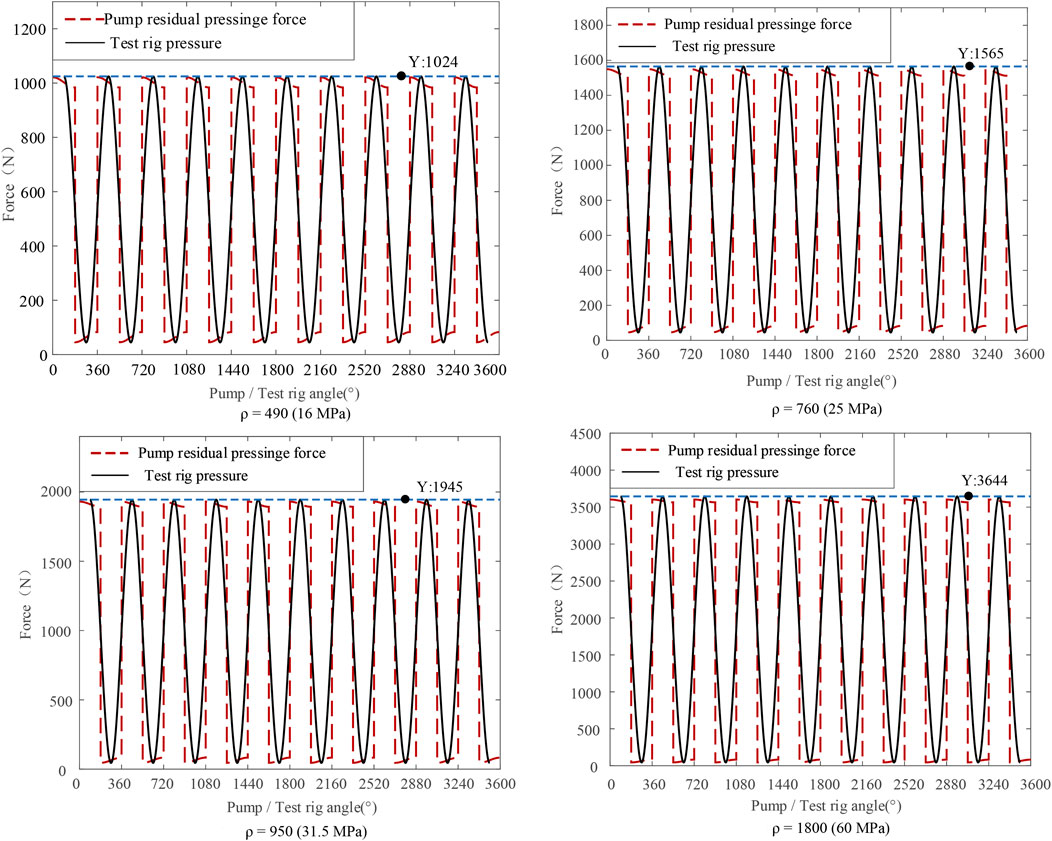
FIGURE 12. Fitted diagram of pump and test set compression force.
From Eq. 9, the test rig is based on the number of convex peaks and troughs of the simulated swashplate specimen to simulate the high speed of the slipper pair. Therefore, with the number of convex peaks q as the independent variable, the simulation was fitted to the change in the residual pressing force and the change in the compression force of the simulated device. The simulation parameters are shown in Table 4, and the results are shown in Figure 13.
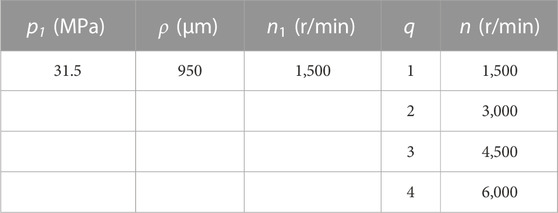
TABLE 4. High-speed simulation parameters.
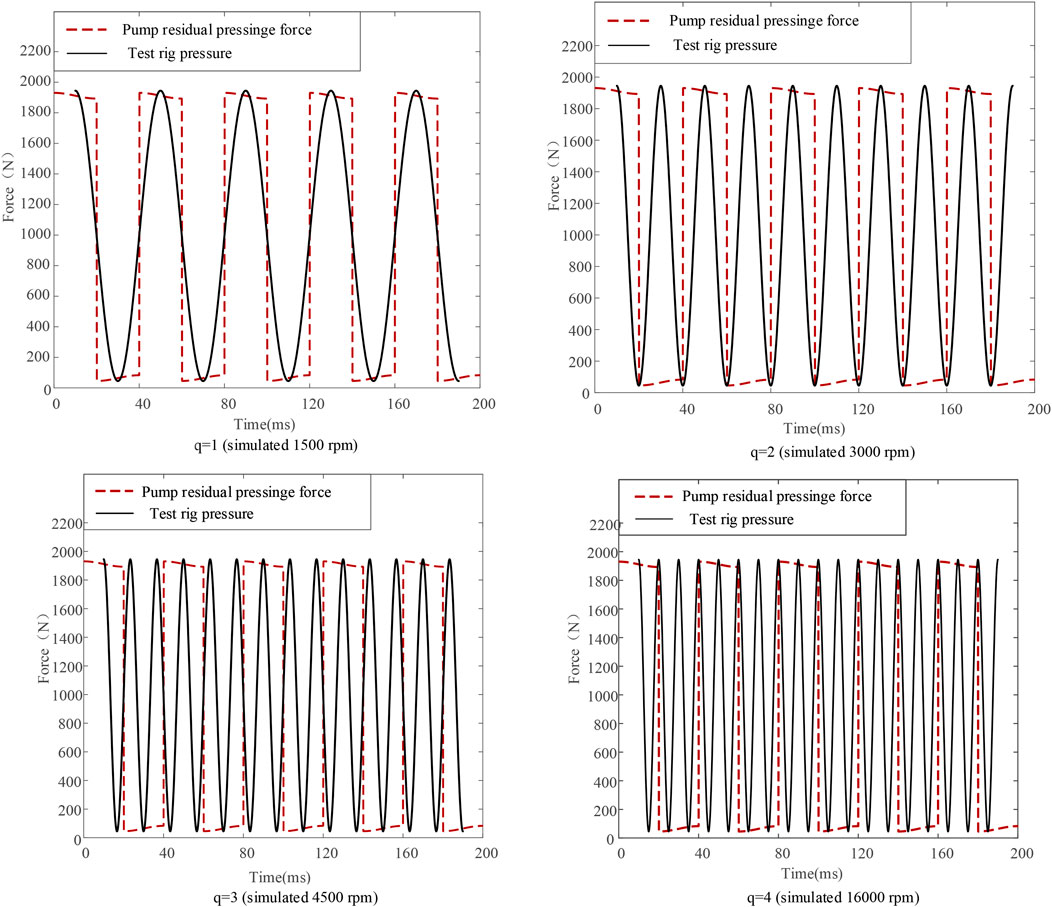
FIGURE 13. High-speed simulation results of the test setup.
As can be seen from Figure 13, as q increases, the residual pressing force alternation period of the simulation device shortens to that of a real pump
The test results for the m = 2 and m = 3 cases using the parameter data in Table 3 are shown in Figure 14.
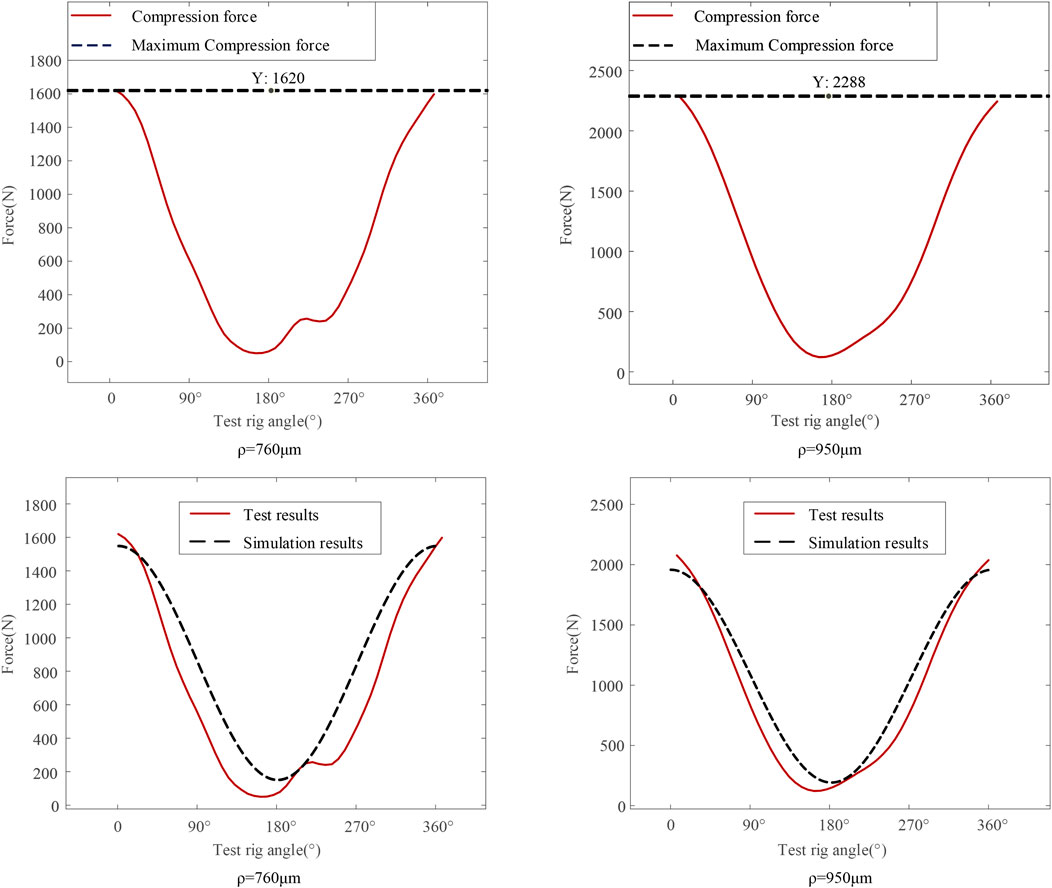
FIGURE 14. Fitted graph of the magnitude and variation of the compression force of the test setup at ρ = 950.
As can be seen from Figure 14, the fit between the test results and the simulation results is better when m = 2 until the turning angle reaches 90°. A phase difference is observed when the turning angle is above 90°, but the trend is the same. When m = 3, the fit between the test results and the simulation results is better until the angle of rotation reaches 180° and then becomes slightly worse after 180°. This result is greatly influenced by the machining accuracy of the test piece.
The different pressure test parameters are shown in Table 5, and the test results fitted to the simulation results are shown in Figure 15.
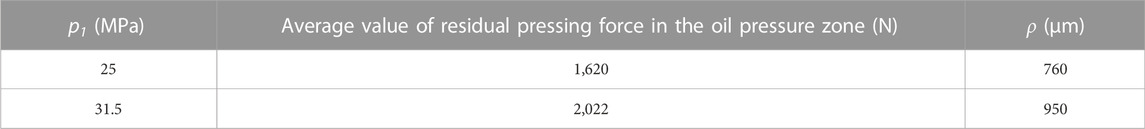
TABLE 5. Test parameters.
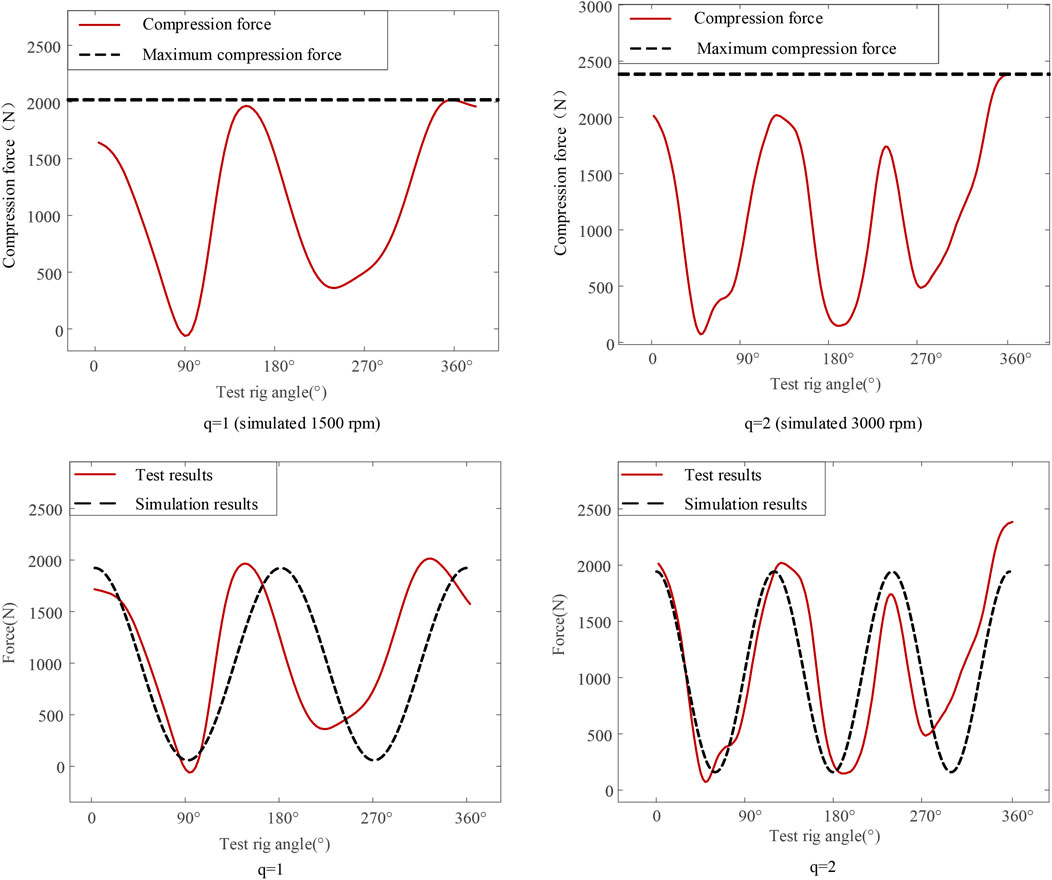
FIGURE 15. Test results on the magnitude and variation pattern of the compression force of the q = 1 test rig.
Figure 15 shows that the trend of the test curve is very close to the simulation curve. However, the test curve shows a small fluctuation after the angle of rotation exceeds 180°. The experimental results are also limited by the precision of the machining of the test piece. The above results show good magnitude fitness between the test rig and the actual pump compression force. Therefore, the test rig can simulate the magnitude of the residual pressing force of the slipper pair and then simulate the friction state of the slipper pair through the relationship between the residual pressing force and the friction force.
This paper proposes an accurate simulation method and test rig that can individually simulate the friction state of the slipper pair under high-speed, high-pressure conditions. Its implementation principle is numerically simulated and experimentally verified, and the specific conclusions are as follows.
1) The different pressure conditions of the slipper pair can be simulated by changing the fluctuation variation
2) By changing the number of convex peaks q of the upper specimen, different speed conditions of the slipper pair can be simulated. The simulation and test results present a high fitting degree with the real pump slipper pair.
3) The simulated pressure of the device can be adjusted arbitrarily by the magnitude of the change in the heave of the upper specimen ρ. The simulated speed can only be varied in q times of the motor speed according to the number of convex peaks q of the upper specimen.
The original contributions presented in the study are included in the article/Supplementary Material; further inquiries can be directed to the corresponding author.
SL: conceptualization, methodology, software, investigation, formal analysis, and writing—original draft; YZ: data curation and writing—original draft; CA: visualization and investigation; YG: resources and supervision; ZL: software and validation; YZ: visualization and writing—review and editing. MH: Writing—review and editing.
This research was sponsored by the National Natural Science Foundation of China (Nos 52275069 and 52175065), the Natural Science Foundation of Hebei Province of China (No. E2022203041), and the Open Foundation of the State Key Laboratory of Fluid Power and Mechatronic Systems (No. GZKF-202009).
The authors declare that the research was conducted in the absence of any commercial or financial relationships that could be construed as a potential conflict of interest.
All claims expressed in this article are solely those of the authors and do not necessarily represent those of their affiliated organizations or those of the publisher, the editors, and the reviewers. Any product that may be evaluated in this article or claim that may be made by its manufacturer is not guaranteed or endorsed by the publisher.
Ai, Q. L., Zhou, H., and Zhang, Z. M. (2004). Development of axial piston pump distribution pair and sliding shoe auxiliary lubrication characteristic test system. Chin. Hydraulics Pneumatics 28 (11), 22–25. [Chinese]. doi:10.3969/j.issn.1000-4858.2004.11.010
Beale, J. (2017). An investigation of the slipper swashplate interface of swashplate-type axial piston machines, PhD Thesis, West Lafayette, Indiana: Purdue University, 26–44.
Belov, D. S., Blinkov, I. V., Anisimov, A. V., Chernogor, A. V., Lishevich, I. V., Sobolev, M. Y., et al. (2021). Surface hardening of steel 20H13 for friction pair with carbon plastic by ion-plasma Ti-Al-N, Ti-Al-Ni-N coatings deposition. J. Phys. Conf. Ser. 1954 (1), 012002. doi:10.1088/1742-6596/1954/1/012002
Chao, Q., Xu, Z., Tao, J., and Liu, C. (2023). Capped piston: A promising design to reduce compressibility effects, pressure ripple and cavitation for high-speed and high-pressure axial piston pumps. Alexandria Eng. J. 62, 509–521. doi:10.1016/j.aej.2022.07.048
Chao, Q., Zhang, J. H., Xu, B., and Wang, Q. (2018). Discussion on the Reynolds equation for the slipper bearing modeling in axial piston pumps. Tribol. Int. 118, 140–147. doi:10.1016/j.triboint.2017.09.027
Du, S., Hong, J., Zhang, H., Zhao, Q., Zhang, T., Xu, X., et al. (2021). Research on cavitation of the rotating-sleeve distributing flow system considering different cam groove profiles. Energies 14 (8), 2139. doi:10.3390/en14082139
Guo, S., Chen, J., Lu, Y., Wang, Y., and Dong, H. (2020). Hydraulic piston pump in civil aircraft: Current status, future directions and critical technologies. Chin. J. Aeronautics 33 (1), 16–30. doi:10.1016/j.cja.2019.01.013
Hashemi, S., Friedrich, H., Bobach, L., and Bartel, D. (2017). Validation of a thermal elastohydrodynamic multibody dynamics model of the slipper pad by friction force measurement in the axial piston pump. Tribol. Int. 115, 319–337. doi:10.1016/j.triboint.2017.05.013
Hong, Y. S., and Kwon, Y. C. (2014). Investigation of the power losses from hydrostatic piston shoe bearings for swash plate type axial piston pumps under mixed friction conditions. Int. J. Precis. Eng. Manuf. 15 (11), 2327–2333. doi:10.1007/s12541-014-0597-1
Iboshi, N., and Yamaguchi, A. (1982). Characteristics of a slipper bearing for swash plate type axial piston pumps and motors : 1st report, theoretical analysis. Bull. JSME 25 (210), 1921–1930. doi:10.1299/jsme1958.25.1921
Ivantysyn, R., and Weber, J. (2016). Transparent pump": Proceedings of the An approach to visualize lifetime limiting factors in axial piston pumps, fpni phd symposium on Fluid power, Florianópolis, SC, Brazi, October 2016, 26–28. doi:10.1115/FPNI2016-1510
Jiang, J., Wang, Z., and Li, G. (2020). The impact of slipper microstructure on slipper-swashplate lubrication interface in axial piston pump. IEEE Access 8, 222865–222875. doi:10.1109/ACCESS.2020.3044081
Liang, X., and Yang, Z. (2021). Experimental study on the influence of friction pair material hardness on the tribological behaviors of water lubricated thrust bearings. Industrial Lubrication and Tribology. 73 6. 929-936. ahead-of-print(ahead-of-print). doi:10.1108/ILT-03-2021-0083
Liu, S. L., Wang, C., Yang, M. X., and Liu, J. (2017). Dynamic characteristic analysis of severe wear process of swashplate pump slipper pair. Chin. Hydraulics Pneumatics. 31 (1), 5. [Chinses]. doi:10.11832/j.issn.1000-4858.2017.01.001
Mao, J., Chen, G., Zhao, J., He, Y., and Luo, J. (2021). An investigation on the tribological behaviors of steel/copper and steel/steel friction pairs via lubrication with a graphene additive. Friction 9 (2), 228–238. doi:10.1007/s40544-019-0327-x
Markus, R., Koskinen, K. T., and Pietola, M. (2008). Study of lubrication conditions in slipper-swashplate contact in water hydrostatic axial piston pump test rig. Proc. 7th JFPS Int. Symposium Fluid Power 2008 (7-1), 91–94. doi:10.5739/isfp.2008.91
Schenk, A. (2014). Predicting lubrication performance between the slipper and swashplate in axial piston hydraulic machines. Ph.D Dissertations & Theses - North Avenue, Atlanta: Gradworks, 1–3.
Spencer, N. A. (2014). Design and development of a novel test method to measure the slipper swashplate interface Fluid film in a positive displacement machine. Ph.D Dissertations & Theses - North Avenue, Atlanta: Gradworks, 8–16.
Szczypinski-Sala, W., and Lubas, J. (2018). The influence of TiB2 coating on the friction parameters in sliding pairs under lubricated friction conditions. IOP Conf. Ser. Mat. Sci. Eng. 421 (3), 032026. doi:10.1088/1757-899X/421/3/032026
Tang, H. B., Fu, Z., and Huang, Y. (2021). A fault diagnosis method for loose slipper failure of piston pump in construction machinery under changing load. Appl. Acoust. 172, 107634. doi:10.1016/j.apacoust.2020.107634
Tang, H. S., Yin, Y. B., and Jing, L. (2016). Lubrication characteristics analysis of slipper bearing in axial piston pump considering thermal effect. Lubr. Sci. 28 (2), 107–124. doi:10.1002/ls.1304
Tang, H. S., Yin, Y. B., Ren, Y., Xiang, J., and Chen, J. (2018). Impact of the thermal effect on the load-carrying capacity of a slipper pair for an aviation axial-piston pump. Chin. J. Aeronautics 31 (2), 395–409. doi:10.1016/j.cja.2017.06.004
Tang, H. S., Yin, Y. B., Zhang, Y., and Li, J. (2016). Parametric analysis of thermal effect on hydrostatic slipper bearing capacity of axial piston pump. J. Cent. South Univ. 23 (2), 333–343. doi:10.1007/s11771-016-3078-0
Tang, S. N., Zhu, Y., and Yuan, S. Q. (2022). A novel adaptive convolutional neural network for fault diagnosis of hydraulic piston pump with acoustic images. Adv. Eng. Inf. 52, 101554. doi:10.1016/j.aei.2022.101554
Tang, S. N., Zhu, Y., and Yuan, S. Q. (2021). An improved convolutional neural network with an adaptable learning rate towards multi-signal fault diagnosis of hydraulic piston pump. Adv. Eng. Inf. 50, 101406. doi:10.1016/j.aei.2021.101406
Tang, S. N., Zhu, Y., and Yuan, S. Q. (2022). Intelligent fault diagnosis of hydraulic piston pump based on deep learning and Bayesian optimization. ISA Trans. 129, 555–563. doi:10.1016/j.isatra.2022.01.01310.1016/j.aei.2022.101554
Tang, S. N., Zhu, Y., and Yuan, S. Q. (2022). Intelligent fault identification of hydraulic pump using deep adaptive normalized CNN and synchrosqueezed wavelet transform. Reliab. Eng. Syst. Saf. 224, 108560. doi:10.1016/j.ress.2022.108560
Wang, H., and Shi, G. (2021). Lubrication characteristics of the worn slipper in the slipper-swashplate pair. Industrial Lubr. Tribol. 73 (7), 1037–1044. doi:10.1108/ILT-07-2021-0241
Wang, J., Xue, Q. L., Liu, B. L., Li, L. X., Li, F. T., Zhang, K., et al. (2020). Experimental measurement on friction performance of PDC bearings for oil drilling under different working conditions. Measurement 163, 107988. doi:10.1016/j.measurement.2020.107988
Wang, X., Yin, Z., Li, H., Gao, G., and Cao, J. (2019). Experimental comparison of CuAl10Fe3 journal bearings sliding against two different coatings. Industrial Lubr. Tribol. 71 (7), 956–964. doi:10.1108/ILT-05-2018-0198
Wang, Z., He, H., Wu, S., Xiang, J., and Ni, J. (2022). Effect of surface topography and wettability on friction properties of CFRPEEK. Tribol. Int. 171 (171), 107573. doi:10.1016/j.triboint.2022.107573
Wu, W., and Yu, C. (2018). Simulation and experimental analysis of hydraulic directional control for displacement controlled system. IEEE Access 6, 27993–28000. doi:10.1109/ACCESS.2017.2777958
Zhang, C., Zhu, C., Meng, B., and Li, S. (2021). Challenges and solutions for high-speed aviation piston pumps: A Review. Aerospace 8 (12), 392. doi:10.3390/aerospace8120392
Zhang, J. H., Chao, Q., Wang, Q., Xu, B., Chen, Y., and Li, Y. (2017). Experimental investigations of the slipper spin in an axial piston pump. Measurement 102, 112–120. doi:10.1016/j.measurement.2017.01.035
Zhou, J., and Jing, C. (2020). Experimental research on the dynamic lubricating performance of slipper/swash plate interface in axial piston pumps. Chin. J. Mech. Eng. 33 (2), 25–94. doi:10.1186/s10033-020-00441-7
Keywords: hydraulic pump, fault diagnosis, slipper pair, high speed and high pressure, residual pressing force, friction state
Citation: Liu S, Zhang Y, Ai C, Ge Y, Li Z, Zhu Y and Hao M (2023) A new test method for simulating wear failure of hydraulic pump slipper pair under high-speed and high-pressure conditions. Front. Energy Res. 10:1096633. doi: 10.3389/fenrg.2022.1096633
Received: 12 November 2022; Accepted: 05 December 2022;
Published: 09 January 2023.
Edited by:
Xiaojun Li, Zhejiang Sci-Tech University, ChinaReviewed by:
Qun Chao, Shanghai Jiao Tong University, ChinaCopyright © 2023 Liu, Zhang, Ai, Ge, Li, Zhu and Hao. This is an open-access article distributed under the terms of the Creative Commons Attribution License (CC BY). The use, distribution or reproduction in other forums is permitted, provided the original author(s) and the copyright owner(s) are credited and that the original publication in this journal is cited, in accordance with accepted academic practice. No use, distribution or reproduction is permitted which does not comply with these terms.
*Correspondence: Yongqiang Zhang, enlxQHN0dW1haWwueXN1LmVkdS5jbg==
Disclaimer: All claims expressed in this article are solely those of the authors and do not necessarily represent those of their affiliated organizations, or those of the publisher, the editors and the reviewers. Any product that may be evaluated in this article or claim that may be made by its manufacturer is not guaranteed or endorsed by the publisher.
Research integrity at Frontiers
Learn more about the work of our research integrity team to safeguard the quality of each article we publish.