
94% of researchers rate our articles as excellent or good
Learn more about the work of our research integrity team to safeguard the quality of each article we publish.
Find out more
METHODS article
Front. Energy Res., 07 December 2022
Sec. Process and Energy Systems Engineering
Volume 10 - 2022 | https://doi.org/10.3389/fenrg.2022.1096046
This article is part of the Research TopicAdvanced Technologies for Planning and Operation of Prosumer Energy Systems, volume IIView all 30 articles
 Wensheng Li1Rong Liang1
 Fengzhang Luo2*
 Shaoting Feng2Bo Yang1Zhao Liu1Zhao Li1Wen Zhang1Kuangyu Kong2Siyuan Lu2
In order to reasonably consider the support capability of multiple types of flexible resources for power grid planning and operation, this paper proposes an assessment method of response potential of end-user-side flexible resources of regional power distribution networks based on sequential simulation of optimal operation. First, the response potential evaluation framework and the evaluation index are proposed. Then, based on the idea of time series simulation of optimal operation of distribution network, the response potential evaluation model considering the interactions between flexible resources and power grid is constructed and solved by optimization package. Finally, the validity of the proposed evaluation method is verified by an actual case from a certain area in northern China. The analysis results show that the end-user-side flexible resources are a kind of balanced resources with good economy, and it is necessary to take the response potential assessment of flexible resources into account in the planning of future new type distribution networks.
Accelerating the clean and low-carbon development of energy industry and building a new type power system with increasing proportion of new energy will play a pivotal role in achieving the goal of “emission peak and carbon neutrality” in China (Han et al., 2021). Driven by the “dual-carbon” goal, the widespread accessing of flexible resources such as distributed generations, flexibly adjustable and controllable loads, energy storages and so on (Holttinen et al., 2013), will become the new normal state of the power system, which is promoting the transformation of traditional power grid planning from “source changes as load changes” mode to “source-load interaction” mode (Andrew et al., 2013; Wang et al., 2021).
However, it is very challenging to successfully utilize new energies because of the fluctuation, intermittency and the anti-peak-regulation character of the output of the distributed generations (Ma et al., 2019), which will easily lead to the insufficient flexibility in adjustment and operation of the system, even resulting in the imbalance of power supply and demand, and posing threaten to the safe operation of the power grid in extreme cases. Through the interactive response management of flexible loads and the regulation of energy storage devices, the dynamic goal of improving the electricity consumption behavior, and peak-shaving and valley-filling can be achieved, which can provide a large amount of balance resources for the power grid and support the power balance of supply and demand (Clement-nyns et al., 2010; Muhanji et al., 2018; Dong et al., 2022). In addition, the optimal layout of power network structure and the optimal configuration of substation capacity can be realized according to the temporal and spatial distribution of flexible resources. Therefore, to some extent, the construction investment will be delayed and carbon emissions will be reduced (Mnatsakanyan and Kennedy, 2015). In order to give full play to the supporting role of flexible resources for the power balance of supply and demand in power grid planning and operation, it is necessary to make reasonable use of these resources and fully exploit the response potential of flexible resources of source-side and load-side, so as to improve the flexibility and economy of power grid operation.
The rational analysis and evaluation of the response potential of flexible resources is the precondition to explore and utilize the flexible resources effectively. Due to the wide distribution of flexible resources, the complexity of regulation and control, the diversity of construction scale and cost (Armando et al., 2010; Ulbig and Andersson, 2015), it is difficult to estimate the response capability and the response degree of flexible resources in different regions, which brings difficulties in evaluating the response potential of flexible resources. In order to assess the response potential of flexible resources, it is necessary to solve three aspects of the problems: quantitative index, evaluation model and solution method. At present, the evaluation indexes of load response degree mainly include the grid dimension indexes (Cheng and An, 2013) and the user dimension indexes (Sun et al., 2016; Ding, 2018; Zhao, 2018). Ref. (Li et al., 2015). gives an evaluation index system from three aspects: interaction participation from the user’s perspective and interaction effect and security from the power grid perspective. The modeling of the potential assessment model should consider the interaction response modes between various flexible resources and power grid. The modeling of response patterns can be divided into two types: modeling based on the response characteristics of user (Huang et al., 2004; Xia et al., 2012; Pan et al., 2019) and modeling based on the optimal dispatch of power grid (Huang and Huang, 2004; Gao et al., 2014). Ref. (Luo et al., 2020). divides flexible loads into transferable loads and reducible loads according to their response characteristics and constructs a response model. Among all kinds of analysis and evaluation methods of power system, in order to precisely simulate the increasingly complex power system, the sequential simulation optimization method has become the main research method to analyze the relevant characteristic indexes and regular patterns of power grid (Wang et al., 2013; Peng, 2019; Yang et al., 2020; Xu et al., 2022).
Based on the research results of existing block distribution network planning, this paper proposes a response potential assessment method of user-side flexible resources of regional power distribution networks. The major contributions of this paper are summarized as follows:
1) A series of evaluation indexes on response potential of end-user-side flexible resources are designed, which can represent the improvement degree of the system load curve and the supporting potential to the power grid planning and operation.
2) The response potential evaluation method based on sequential simulation of interactive operation is developed, which can describe the interactive response process between flexible resources and power grid in detail and accurately evaluate the supporting potential. The sequential simulation method takes the interactive operation mechanism of flexible resources and the power grid into account, which can better simulate the operation of the power grid in the future, thus providing more accurate guidance for the planning work.
The remainder of this paper is structured as follows: Assessment Framework Section introduces the evaluation framework of response potential of end-user-side flexible resources. Evaluation Indexes of Response Potential and Interactive Response Model of Flexible Resources Section proposes the evaluation indexes and the interactive response model of flexible resources. Response Potential Evaluation Model and Method Based on Sequential Simulation of Interactive Operation Section constructs the evaluation model of time series response potential to describe the interaction process between flexible resources and power grid, based on the idea of sequential simulation optimization of distribution networks operation. And the optimization software package is employed to solve the problem. Case Study Section presents the evaluation results of a practical example from a certain area of northern China to validate the effectiveness of the proposed model and method. Case Study Section concludes the paper.
The results show that the method proposed in this paper can effectively evaluate the supporting capability of the user-side flexible resources to the power grid operation, thus alleviating the operation pressure of the superior power grid, delaying the capacity construction of the superior power grid, and reducing the construction scale and investment level of the relevant power grid.
The block distribution network planning is the hierarchical distribution network planning at different levels based on the division and the subdivision of power supply areas into power supply zones, power supply blocks and power supply units. In recent 5 years, the block distribution network planning method has been widely used in China utilities.
In order to solve the problem of insufficient system regulation ability of different unit in different degrees, the flexible resources such as distributed generations, flexible loads and energy storage devices in the unit can be aggregated and regulated as a whole. This way can realize the balance of power supply and demand in power grid of the unit scale, and the interactive operation of power network with response participation of flexible resources can also improve the load curve of the whole system.
In this paper, the evaluation index of response potential of flexible resources is designed based on the improvement degree of system load curve characteristics and the support potential of flexible resource to power grid planning and operation. At the same time, based on the interactive response mechanism between flexible resources and power grid, a potential evaluation model based on the time series simulation and optimal operation of power grid is established, and solved by the optimization software package. Finally, the response potential of flexible resources is quantitatively analyzed based on the proposed evaluation index, which provides corresponding guidance for distribution network planning and provides basis for making rational interaction strategies.
The overall assessment framework is shown in Figure 1.
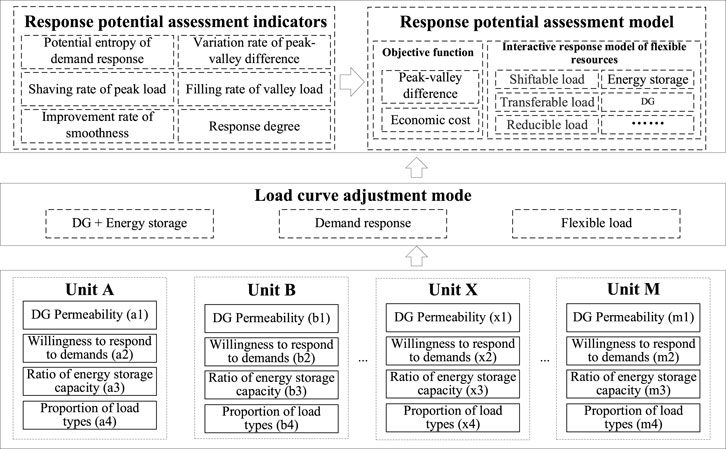
FIGURE 1. Response potential evaluation framework of flexibility resources.
The flexible resource response potential defined in this paper mainly refers to the improvement degree of the system load curve and the supporting potential of the flexible resource for system planning and operations, when the flexible resource participates in the power grid interaction operation with demand response. The specific representation indexes are: potential entropy of demand response, variation rate of peak-valley difference, clipping rate of peak load, filling rate of valley load, improvement rate of smoothness and Response degree. The representation metrics and their meanings are shown in Table 1.

TABLE 1. Evaluation metrics.
Different categories of users have different peak-shaving and valley-filling potential. In this paper, the concept of information entropy, which describes the information quantity in information theory, is used to define the demand response potential entropy of users (Sun et al., 2016). The expression is shown in (Eq. 1).
where,
Similar to information entropy describing the amount of information, demand response potential entropy can be used to describe the potential of user demand response. The more average the user’s power load, the smaller the difference between peak and valley is, and the smoother the user’s power consumption curve is. It can be considered that this kind of users’ power consumption pattern is more regular and not easy to change, so the potential of peak shaving and valley filling is smaller, and the potential entropy is also smaller. On the contrary, for the users with large peak-valley difference and large fluctuation load curve, the regularity of power consumption is weak, so the potential of peak-shaving and valley-filling is large, and the potential entropy is also large.
The variation rate of peak-valley difference is defined as the ratio of the change amount of the system load’s peak-valley difference when all kinds of resources participating in the demand response versus the system load’s peak-valley difference without demand response participation. The expression is shown in (Eq. 2).
where,
Peak shaving rate is defined as the ratio of the peak load change amount of the system when various resources participating in the demand response versus the peak load of the system when there is no demand response involved. The expression is shown in (Eq. 3).
where,
The valley filling rate is defined as the ratio of the valley load change mount of the system when various resources participate in the demand response versus the valley load of the system when there is no demand response involved. The expression is shown in (Eq. 4).
where,
The smoothness improvement rate is defined as the ratio of the change amount of the standard deviation of load power within a certain period of time when various resources participate in the demand response versus the standard deviation of load power when there is no demand response involved. The expression is shown in (Eq. 5).
where,
The response degree is defined as the ratio of the actual response amount of the system load to its maximum response amount. The expression is shown in (Eq. 6).
where,
User load can be classified into industrial load, commercial load, residential load and so on. According to the response characteristics, user-side flexible load can be divided into shiftable load, transferable load and reducible load.
The shiftable load mainly refers to the load that the regular pattern of electricity consumption cannot be changed, but can only be shifted on the time axis. The shiftable load is mainly the industrial load with adjustable shifts. The load curve can be shifted by adjusting its power consumption time without changing its power consumption shape. The schematic diagram of the shiftable load is shown in Figure 2.
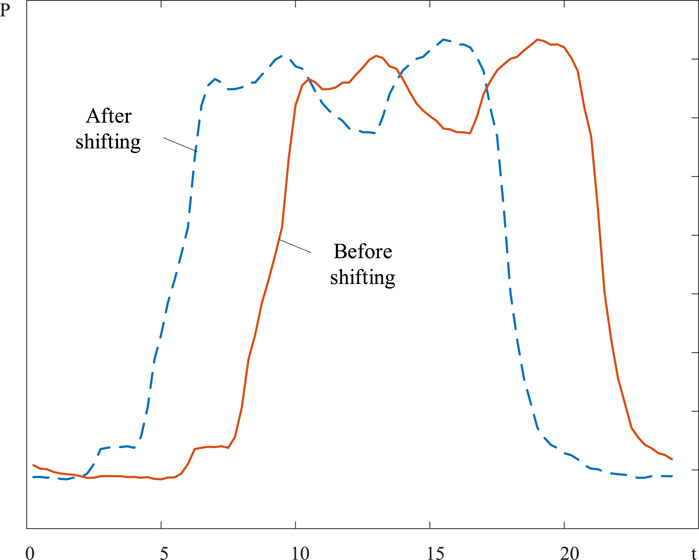
FIGURE 2. Schematic diagram of shiftable load.
The interactive response model of shiftable load participating in power grid operation is shown in (Eq. 7):
where,
Transferable load refers to a kind of load that can transfer part of the load in peak period to the valley period. For example, household appliances, such as water heaters and air conditioners in residential loads, can achieve peak-shaving and valley-filling response by adjusting their operation time. Figure 3 shows a schematic diagram of the transferable load.
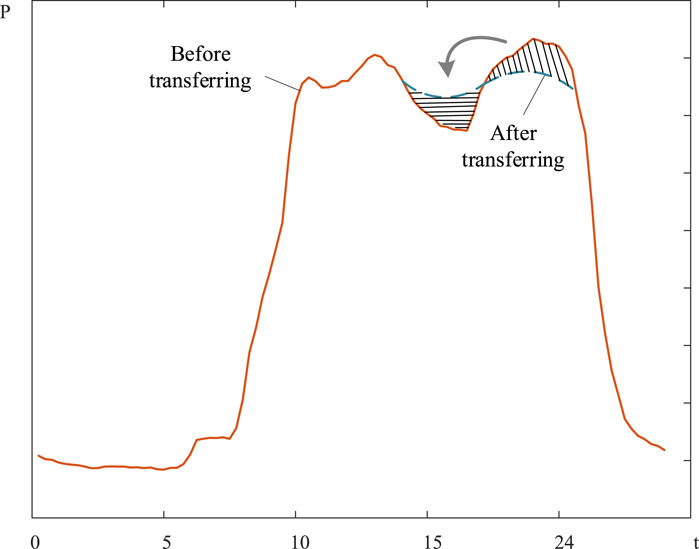
FIGURE 3. Schematic diagram of transferable load.
The interactive response model of transferable load participating in power grid is shown in (Eq. 8):
where,
Reducible load means that a certain amount of load can be cut during the peak load period, so as to reduce the average power consumption. For example, commercial users’ electrical appliances, such as air conditioning, refrigeration and so on, can participate the interactive response by reducing a certain output power in a short period of time, which will not affect the comfort and satisfaction of customers. The schematic diagram of the reducible load is shown in Figure 4.
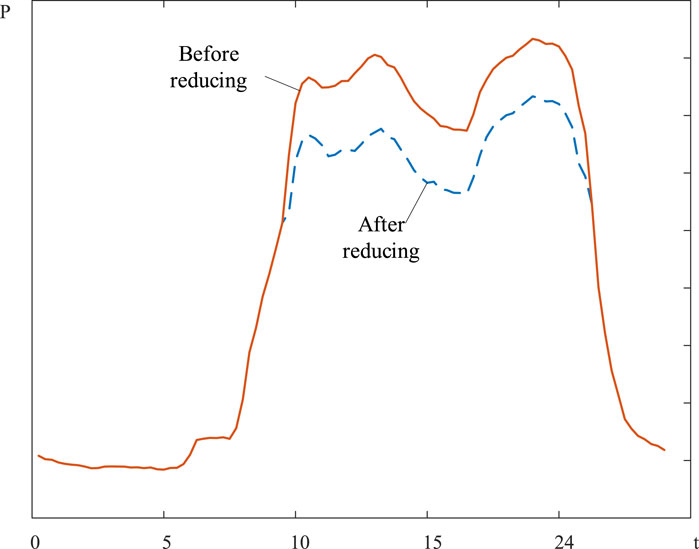
FIGURE 4. Schematic diagram of reducible load.
The interactive response model of reducible load participating in power grid is shown in (Eq. 9):
where,
The energy storage device adjusts the system peak-valley difference by charging at the load valley period and discharging at the load peak period, so as to support and solve the supply-demand balance of the power grid. The common energy storage device is battery energy storage, whose level of stored electricity in operation is represented by state of charge (SOC). The SOC of energy storage at time t is determined by the SOC at time t-1 and the power of the energy storage system. The interactive response model of energy storage is shown in (Eq. 10).
where,
First, the whole response potential analysis and evaluation model of the flexible resources is constructed. Then the response potential evaluation method and procedure is proposed based on the sequential simulation of interactive operation.
In this paper, the integrated optimization of the total economic cost of distribution network operation and the optimum peak-valley difference is considered as the objective. The economic cost of operation mainly includes the cost of purchasing electricity from upper power grid, the cost of load interaction and the cost of energy storage dispatching. Considering the dimensional difference of above two sub-objectives of economic cost and peak-valley difference, based on the concept of per-unit value, this paper takes the independent optimal solutions of the two sub-objectives as their respective benchmark values, and weights them as a comprehensive objective function (Yang et al., 2021). The expression of the objective function is shown in (Eqs 11–16).
where,
The evaluation model needs to take into account the power balance constraints of power network, and the interaction constraints between the source-load flexibility resources and the power grid. The details are described as follows.
where,
where,
where,
where,
In order to describe the interactive response process between flexible resources and power grid in detail and accurately evaluate the supporting potential for power grid planning and operation, this paper adopts the analysis and evaluation idea of sequential simulation of optimized operation method.
Power system sequential simulation method (Cao et al., 2014) is to the simulate the actual operation of the system at different time scales under the condition of given network topology and load level, meanwhile to analyze and evaluate the operation state and performance of the power grid are d. Based on the timing simulation method, this paper evaluates the adjustment effect of the system load by simulating the regional flexible resources’ response behavior in a typical 24-h domain, and quantifies the response potential of flexible resources according to the evaluation index.
The objective function of the response potential assessment model mentioned above contains integer variables and non-linear terms. It is a typical mixed integer non-linear programming model. In this paper, the non-linear term of the objective function is transformed into linear description by KKT conditions (Zhang et al., 2018), and then the optimization software CPLEX is called by YALMIP in MATLAB to solve problem. A general representation of the model is shown in (Eq. 30).
where,
Figure 5 shows the analytical evaluation procedure of response potential.
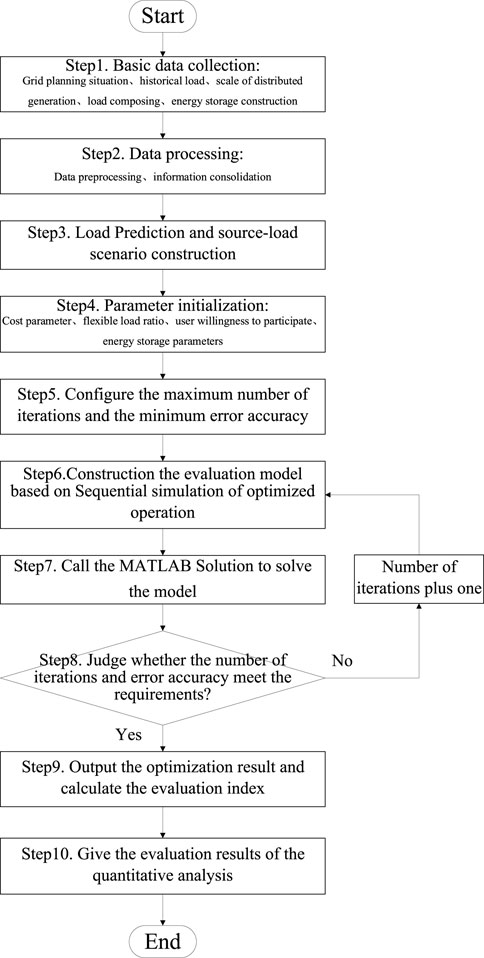
FIGURE 5. Analytical evaluation procedure of response potential.
Step 1: Basic data collection. To obtain the date of unit divisions, data of historical load, data of installed scale of distributed generations, data of load composition and energy storage configuration, etc., of the area to be evaluated.
Step 2: Data processing. To check and process the collected historical load data, including missing data processing, invalid data processing, outlier analysis, etc.; and to extract the efficient data from collected reports in text form.
Step 3: Load prediction and source-load scenario construction. To forecast the long-term annual load based on the historical annual load data, and to obtain the typical daily prediction load curves of all units through certain method (Luo et al., 2021). Moreover, the source-load scenario is constructed according to the output curves of regional PV and predicted load curves.
Step 4: parameter initialization. To configure the cost parameters of the evaluation mode (such as electricity purchase price, unit compensation price of flexible loads, cost parameters of energy storage, etc.), flexible load proportion, participation willingness coefficient of users, operation parameters of energy storage devices, etc.
Step 5: Configure the maximum number of iterations and minimum error accuracy. In this paper, the maximum number of iterations is set to 50, and the minimum error accuracy of the last two optimization iterations is 10−6.
Step 6: Construct the evaluation model based on sequential simulation of optimized operation.
Step 7: Call the MATLAB solution package to solve the model.
Step 8: Judge whether the number of iterations and error accuracy meet the requirements. If not, increase the number of iterations by 1 and return to step 6; otherwise, proceed to the next step.
Step 9: Output the optimization result and calculate the evaluation indexes.
Step 10: Give the evaluation results of the quantitative analysis of the flexible resources’ response potential of area to be evaluated.
In this paper, the actual power distribution network data of a certain area in north China is taken as an example to be evaluated. This area is a type B power supply area by 10 kV distribution networks with a total planning area of 11.68 km2, which contains 4 meshed and blocked power grids, numbered power mesh unit A, B, C and D, respectively.
Among 4 power meshes, Unit A is mainly used for second-class residential, administrative and commercial land; Unit B is mainly used for second-class residential and commercial land; Unit C is mainly used for second-class residential, commercial and educational land; Unit D is mainly used for residential, commercial and temple land. And the second-class residential land refers to the land planning with complete municipal public facilities, complete layout and good environments.
The current status of each power mesh unit and the respective forecasting loads in the planning year without considering the flexible resource support potential are shown in Table 2. The typical daily predicted load curves of each unit are obtained by using the method in Ref (Luo et al., 2021) based on the historical annual load of the area. Meanwhile, Figure 6 shows the typical daily load curve for each power mesh unit in the planning year without considering flexible resources.
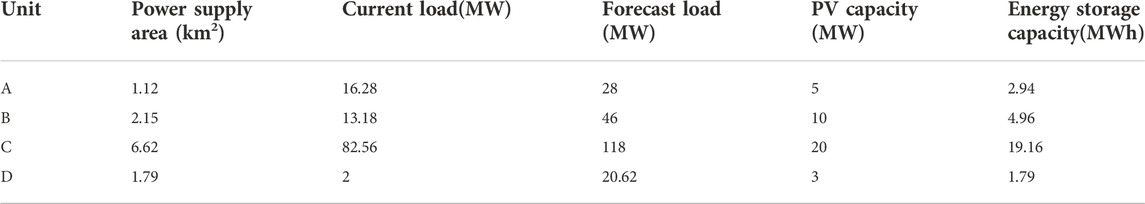
TABLE 2. Current status of each power mesh unit and the respective forecasting loads in the planning year.
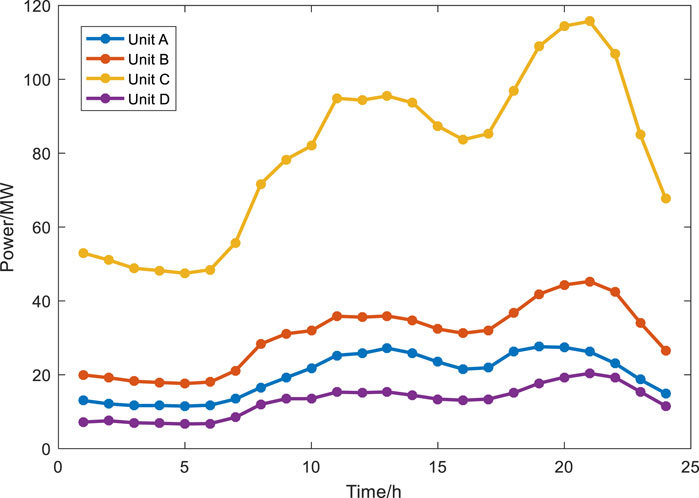
FIGURE 6. Forecast load curve of each grid (without considering flexible resources).
In this paper, we develop 3 scenarios to quantitatively analyze the response potential of flexible resources with different levels of demand response programs, through simulating the interaction response effect of flexible resources on the load curve under three different scenarios. These scenarios are:
Scenario 1: only energy storage device is considered;
Scenario 2: only flexible load regulation is considered;
Scenario 3: both energy storage and flexible load regulation are considered.
The parameters of purchase electricity price in the response potential assessment are shown in Table 3. We assume that, the reducible loads are compensated at the electricity price of the load cut time, and the transferable loads are compensated at 80% of the electricity price of the load transfer time. And the operation and maintenance cost of energy storage device is set as 26 RMB/MW (Li, 2020).
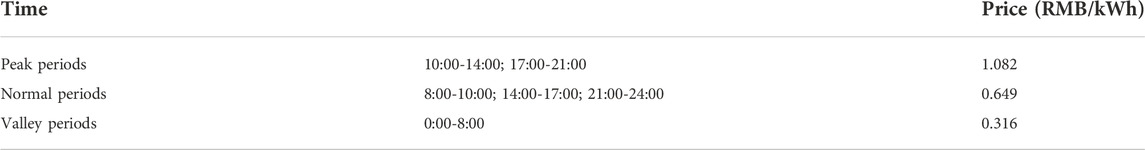
TABLE 3. Electricity price.
The interactive response parameters of flexible loads are determined by the load composition and load characteristics in the region. For the proportion parameters of residential load, commercial load and other types of loads of the case power grid mesh units, we can set their values according to the planning land development purpose. For the parameters of the proportion of the transferable and reducible load, and the willingness of the users to participate in interactive response, they cannot be accurately captured from the usual historical load data because of not covering in the common historical load data accumulation. This paper mainly refers to relevant technical principles and literature data (Li et al., 2019) for parameter selection, as shown in Table 4.
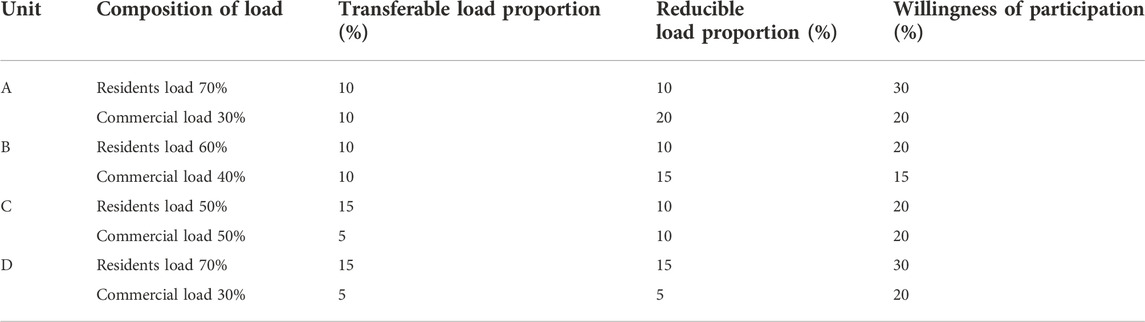
TABLE 4. Interactive response parameters of flexible load of each unit.
In this paper, the proposed potential assessment model based on time sequential simulation is built in MATLAB environment. Figure 7 shows the load curve adjustment effect of four units under three scenarios, and Figure 8 shows the load curve adjustment effect of the whole evaluation area. The proposed method was implemented in the YALMIP (Lofberg, 2004) optimization toolbox using MATLAB R2016a and solved by IBM ILOG CPLEX 12.6. The numerical experiments were performed on a computer with an Intel CORE CPU i5-1135G7 processor running at 2.40 GHz and 16 GB of RAM.
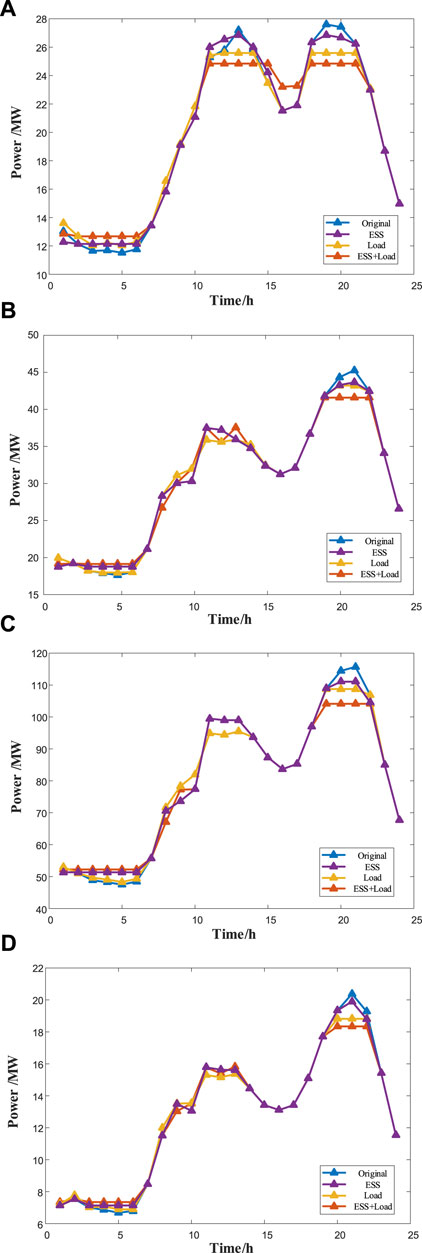
FIGURE 7. Load curve adjustment effect of four units. (A) Unit A (B) Unit B (C) Unit C (D) Unit D.
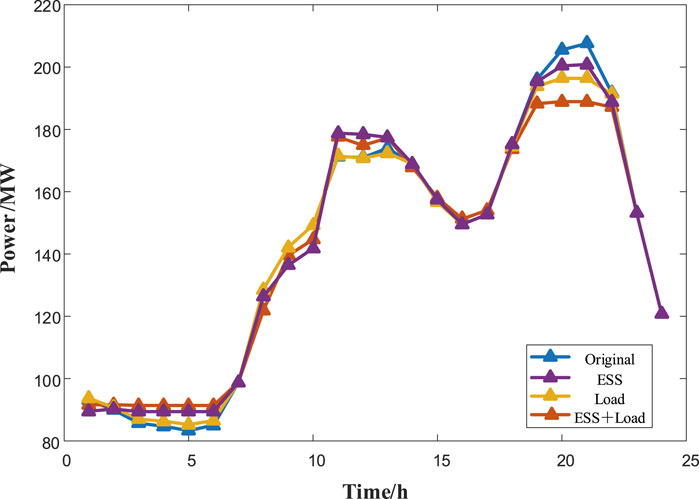
FIGURE 8. Load curve adjustment effect of whole region.
In Figure 7 and Figure 8, scenario 1 only considers the dispatching of energy storage device, and the load curve is smoothed by energy storage’s releasing energy during peak periods and absorbing energy during valley periods. In scenario 2, only flexible load interaction response is considered, and the effect of peak shaving and valley filling is achieved through adjusting the transferable load and the reducible load. In Scenario 3, flexible load response and energy storage dispatch are jointly regulated. It is easy to see that scenario 3 has the most significant effect on load curve adjustment and improvement.
Table 5 shows the calculation results of the response potential evaluation indicators of the case. The results show that the regional load curve can be improved by rationally adjusting and controlling the user-side flexible loads and energy storage devices. The results of Table 5 show that the peak-shaving effect of 5%–6% and the valley-filling effect of less than 5% can be achieved only by load response participation, while both the peak-shaving effect and the valley-filling effect can be increased to about 10% by adding energy storage dispatching. It can be seen that the addition of energy storage has a good effect on peak-shaving and valley-filling, especially valley-filling. The combined regulation of the overall flexible controllable load and energy storage can achieve the reducing rate of peak-valley difference by about 20%, and 5%–10% peak-shaving and valley-filling effect.
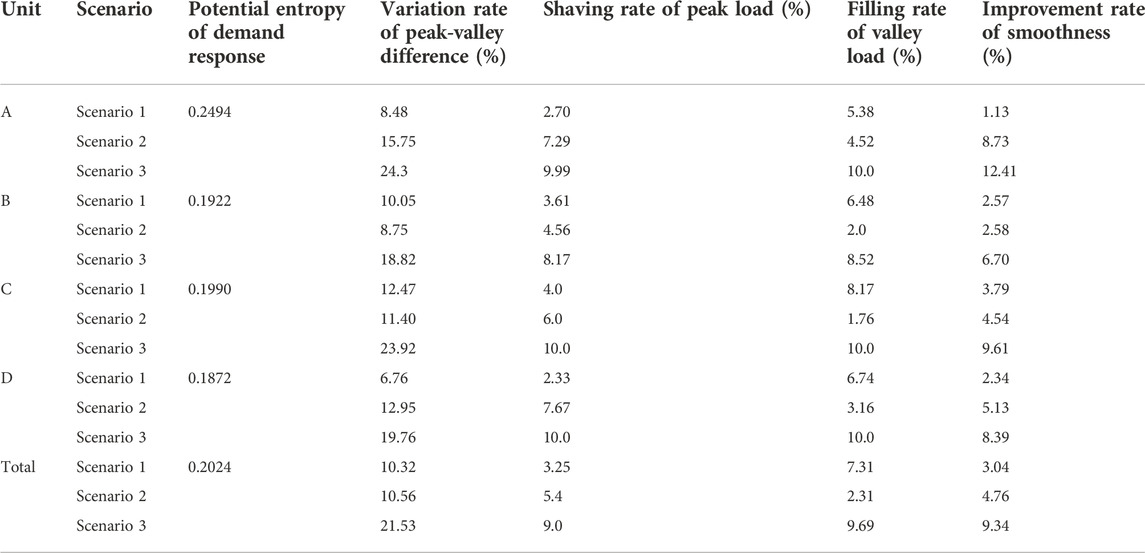
TABLE 5. Response potential assessment results.
Figure 9 shows the daily optimal adjustment results of flexible load and energy storage device of each unit in the typical day under scenario 3. Through the application of a series of combination optimization methods, such as energy storage discharging the stored energy in the peak load period and charging in the valley load period, transferring the transferable load from the peak load period to the valley load period, and reducing the load properly in the peak load period, the effect of peak-shaving and valley-filling on the load curve is achieved.
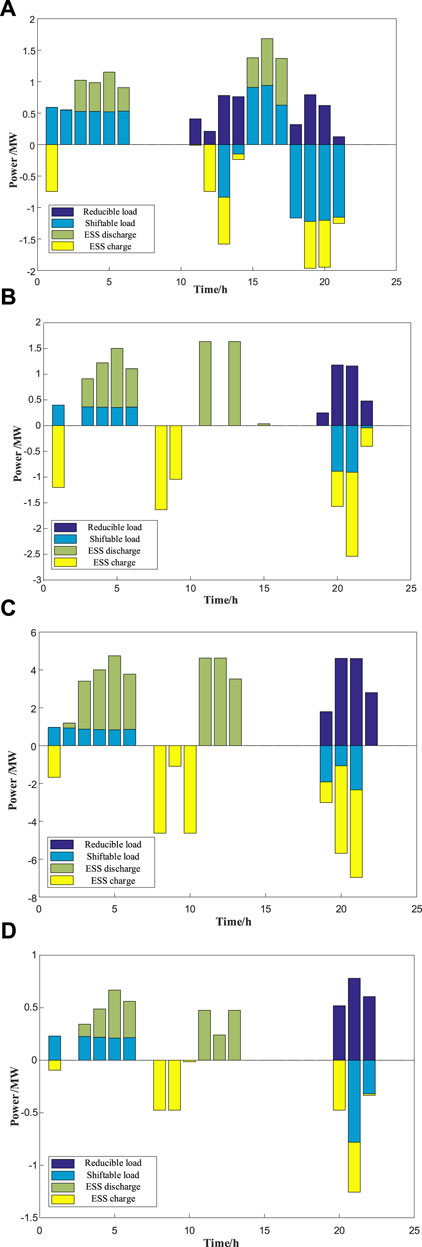
FIGURE 9. Adjustment of flexible loads and energy storage devices of each unit in scenario 3. (A) Unit A (B) Unit B (C) Unit C (D) Unit D.
Based on the above interactive response potential assessment results, we can roughly estimate the benefit-enhancing potential of the traditional planning scheme. According to the average load ratio of distribution transformer, that’s 60% in this area, the configuration capacity of distribution transformers of this area can be reduced by about 31 MVA by adjusting various flexible resources in an ideal situation. And the investment cost can be saved by about 26.7 million RMB, which is 18.9% less than the investment cost of the traditional planning scheme. The benefit enhancing potential of each unit planning scheme is shown in Table 6.
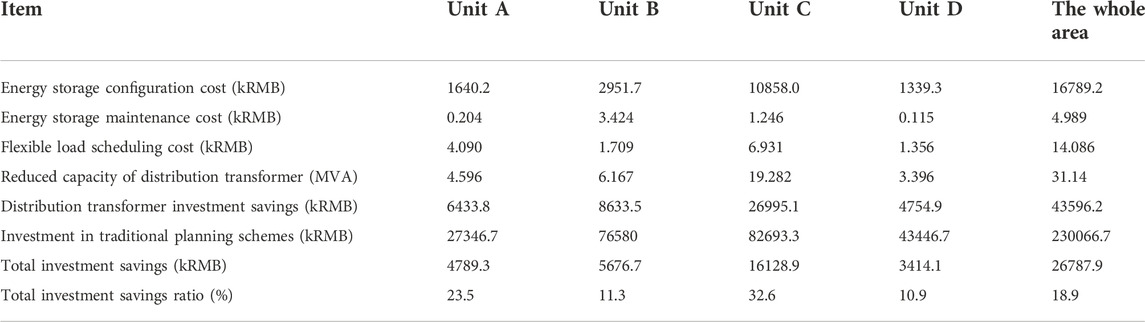
TABLE 6. Benefit enhancing potential of each unit planning scheme.
This paper presents a response potential assessment method of user-side flexible resources of regional power distribution networks based on sequential simulation of optimal operation. First, a set of evaluation indicators, like variation rate of peak-valley difference and improvement rate of smoothness, are designed to characterize the improvement degree of the system load curve and the supporting potential to the power grid planning and operation because of the flexible resources’ participating in the interactive response with power grid. Then, a response potential assessment model of flexible resources is constructed based on sequential simulation of optimal operation considering the interaction between flexible resources and power grid, and the optimization software package is used to solve the model. In the end, the validity of the proposed method is verified by the analysis and evaluation of the flexible resource response potential in a certain area of North China.
The result shows that the user-side flexible resources participating in the interactive operation of the power grid can have a beneficial effect on the improvement of the system load curve, and the utilization potential is huge. In other words, flexible resources are a kind of balanced resources with good economy in the planning and operation of power network.
Therefore, we need to take the response potential assessment of flexible resources into account in the planning of future new type of distribution networks. In order to accurately evaluate the response potential of flexible resources, it is necessary to enhance the accuracy of load curve forecasting, the investigation and analysis of user load characteristics, and the accumulation of fine-grained historical data, so as to reasonably determine the interactive response parameters of flexible loads. At the same time, it is also necessary to introduce the methods of artificial intelligence, big data, etc., to carry out load forecasting, scenario construction, parameter acquisition and configuration, interactive strategy design of time series simulation, etc., so as to ensure the accuracy of the evaluation results. The above contents are also the focus of our further research to be conducted.
The original contributions presented in the study are included in the article/Supplementary material, further inquiries can be directed to the corresponding author.
WL: Supervision, Conceptualization, Writing—review and editing. RL: Supervision, Conceptualization, Writing—review and editing. FL: Supervision, Conceptualization, Writing—review and editing. SF: Methodology, Software, Data curation, Writing—original draft. BY, ZLiu, ZLi, WZ, KK, and SL: Writing—review and editing.
This work is supported by Project of State Grid Shandong Electric Power Company (SGSDJY00GPJS2200234).
Thanks for the data support provided by the project team members from State Grid Shandong Electric Power Company. The authors would also like to thank the reviewers for their valuable comments and suggestions to improve the quality of the paper.
WL, RL, BY, ZLu, ZLi, and WZ were employed by the company State Grid Shandong Electric Power Company.
The remaining authors declare that the research was conducted in the absence of any commercial or financial relationships that could be construed as a potential conflict of interest.
All claims expressed in this article are solely those of the authors and do not necessarily represent those of their affiliated organizations, or those of the publisher, the editors and the reviewers. Any product that may be evaluated in this article, or claim that may be made by its manufacturer, is not guaranteed or endorsed by the publisher.
Andrew, K., Luis, F., Carmen, L., Ault, G. W., Alarcon-Rodriguez, A. D., Currie, R. A. F., et al. (2013). State-of-the-Art techniques and challenges ahead for distributed generation planning and optimization. IEEE Trans. Power Syst. 28, 1493–1502. doi:10.1109/TPWRS.2012.2214406
Armando, M., Warlley, S., Luiz, A., and Billinton, R. (2010). Long-term probabilistic evaluation of operating reserve requirements with renewable sources. IEEE Trans. Power Syst. 25, 106–116. doi:10.1109/TPWRS.2009.2036706
Cao, Y., Li, P., Yuan, Y., Zhang, X., and Guo, S. (2014). Analysis on accommodating capability of renewable energy and assessment on low-carbon benefits based on time sequence simulation. Automation Electr. Power Syst. 38, 60–66. doi:10.7500/AEPS20140329002
Cheng, Y., and An, S. (2013). Analysis of active load’s interaction response behavior. Automation Electr. Power Syst. 37, 63–70. doi:10.7500/AEPS201209024
Clement-nyns, K., Khaesen, E., and Driesen, J. (2010). The impact of charging plug-in hybrid electric vehicles on a residential distribution grid. IEEE Trans. Power Syst. 25, 371–380. doi:10.1109/tpwrs.2009.2036481
Ding, Y. (2018). Research on load flexible scheduling based on value exploration. Southeast University, Nanjing, China.
Dong, Y., Shan, X., Yan, Y., Leng, X., and Wang, Y. (2022). Architecture, key technologies and applications of load dispatching in China power grid. J. Mod. Power Syst. Clean Energy 10, 316–327. doi:10.35833/MPCE.2021.000685
Gao, C., Li, Q., and Li, Y. (2014). Bi-level optimal dispatch and control strategy for air-conditioning load based on direct load control. Proc. CSEE 34, 1–10. doi:10.13334/j.0258-8013.pcsee.2014.10.005
Han, X., Li, T., Zhang, D., and Zhou, X. (2021). New issues and key technologies of new power system planning under double carbon goals. High. Volt. Eng. 47, 3036–3046. doi:10.13336/j.1003-6520.hve.20210809
Holttinen, H., Tuohy, A., Milligan, M., Lannoye, E., Silva, V., Muller, S., et al. (2013). The flexibility workout: Managing variable resources and assessing the need for power system modification. IEEE Power Energy Mag. 11, 53–62. doi:10.1109/MPE.2013.2278000
Huang, K., Chin, H., and Huang, Y. (2004). A model reference adaptive control strategy for interruptible load management. IEEE Trans. Power Syst. 19, 683–689. doi:10.1109/TPWRS.2003.821444
Huang, K., and Huang, Y. (2004). Integrating direct load control with interruptible load management to provide instantaneous reserves for ancillary services. IEEE Trans. Power Syst. 19, 1626–1634. doi:10.1109/TPWRS.2004.831705
Li, W. (2020). Research on multiple time scale dispatch strategy of source-load-storage considering wind power accommodation. Shenyang University of Technology, Shenyang, China. doi:10.27322/d.cnki.gsgyu.2020.000401
Li, Y., Zhou, J., Ju, P., Di, M., Yang, C., and Wang, K. (2015). Quantitative assessment method for interactive impact of flexible load. Automation Electr. Power Syst. 39, 26–32. doi:10.7500/AEPS20140417002
Li, Y., Zhang, Y., Wu, L., Zhao, J., and Yin, H. (2019). Bottom-to-top load curve forecasting method for active distribution Network. Proc. CSU-EPSA 31, 106–111. doi:10.19635/j.cnki.csu-epsa.000124
Lofberg, J. (September 2004). Yalmip: a toolbox for modeling and optimization in matlab, Proceedings of the 2004 IEEE International Conference on Robotics and Automation (IEEE Cat. No.04CH37508), Taipei, Taiwan, 284–289. doi:10.1109/CACSD.2004.1393890
Luo, F., Yang, X., Wei, W., Zhang, T., Yao, L., Zhu, L., et al. (2020). Bi-level load peak shifting and valley filling dispatch model of distribution systems with virtual power plants. Front. Energy Res. 8, 1–10. doi:10.3389/fenrg.2020.596817
Luo, F., Zhang, X., Yang, X., Yao, Z., Zhu, L., et al. (2021). Load analysis and prediction of integrated energy distribution system based on deep learning. High. Volt. Eng. 47, 23–32. doi:10.13336/j.1003-6520.hve.20201477
Ma, X., Shen, W., Yang, C., Du, S., Su, J., Zhao, F., et al. (2019). Evaluation of high proportion new energy microgrids participating in peak-shaving capacity of power grid. Power Syst. Clean Energy 35, 62–68. doi:10.3969/j.issn.1674-3814.2019.08.009
Mnatsakanyan, A., and Kennedy, S. (2015). A novel demand response model with an application for a virtual power plant. IEEE Trans. Smart Grid 6, 230–237. doi:10.1109/TSG.2014.2339213
Muhanji, S., Muzhikyan, A., and Farid, A. (2018). Distributed control for distributed energy resources: Long-term challenges and lessons learned. IEEE Access 6, 32737–32753. doi:10.1109/ACCESS.2018.2843720
Pan, C., Teng, H., Gong, Y., Liao, M., and Pan, M. (2019). Research on optimal coordination scheduling strategy of micro-grid in user-side interactive mode. Electr. Meas. Instrum. 56, 51–56. doi:10.19753/j.issn1001-1390.2019.05.009
Peng, X. (2019). Research on evaluation method of new energy absorption based on time series production simulation. Xi’an University of Technology, Xi'an, China.
Sun, Y., Jia, M., Lu, J., Zhu, Y., Li, B., Cui, G., et al. (2016). Analysis on interactive potential of intelligent power utilization considering user demand response. J. Electr. Power Sci. Technol. 31, 43–50. doi:10.3969/j.issn.1673-9140.2016.04.008
Ulbig, A., and Andersson, G. (2015). Analyzing operational flexibility of electric power systems. Int. J. Electr. Power & Energy Syst. 72, 155–164. doi:10.1016/j.ijepes.2015.02.028
Wang, B., Liu, X., and Li, Y. (2013). Day-ahead generation scheduling and operation simulation considering demand response in large-capacity wind power integrated systems. Proc. CSEE 33, 35–44. doi:10.13334/j.0258-8013.pcsee.2013.22.009
Wang, C., Shi, Z., Liang, Z., Li, Q., Hong, B., Huang, B., et al. (2021). Key technologies and prospects of demand-side resource utilization for power systems dominated by renewable energy. Automation Electr. Power Syst. 45, 37–48. doi:10.7500/AEPS20210323004
Xia, Y., Kang, C., Ning, B., and Ding, M. (2012). A generation and load integrated scheduling on interaction mode on customer side. Automation Electr. Power Syst. 36, 17–23. doi:10.3969/j.issn.1000-1026.2012.01.004
Xu, X., Du, E., Gao, Y., Zhang, N., and Li, J. (2022). Overview on research and application of power system operation simulation and capacity planning tools. Automation Electr. Power Syst. 46, 188–199. doi:10.7500/AEPS20201104004
Yang, X., Mu, G., Chai, G., Yan, G., and An, J. (2020). Source-storage-grid integrated planning considering flexible supply-demand balance. Power Syst. Technol. 44, 3238–3246. doi:10.13335/j.1000-3673.pst.2020.0753
Yang, L., Huang, K., Kong, X., Lv, X., and Guo, H. (2021). Capacity optimization configuration of grid-connected microgrid system considering flexible load. Acta Energiae Solaris Sin. 42, 309–316. doi:10.19912/j.0254-0096.tynxb.2018-0780
Zhang, G., Wang, X., and Cai, C. (2018). Stackelberg game based coordinated dispatch of virtual power plant considering electric vehicle management. Automation Electr. Power Syst. 42, 48–55. doi:10.7500/AEPS20170607005
Keywords: new type power system, flexibility resource, response potential, demand response, sequential simulation
Citation: Li W, Liang R, Luo F, Feng S, Yang B, Liu Z, Li Z, Zhang W, Kong K and Lu S (2022) Response potential assessment of user-side flexible resources of regional power distribution networks based on sequential simulation of optimal operation. Front. Energy Res. 10:1096046. doi: 10.3389/fenrg.2022.1096046
Received: 11 November 2022; Accepted: 25 November 2022;
Published: 07 December 2022.
Edited by:
Bin Zhou, Hunan University, ChinaReviewed by:
Manyun Huang, Hohai University, ChinaCopyright © 2022 Li, Liang, Luo, Feng, Yang, Liu, Li, Zhang, Kong and Lu. This is an open-access article distributed under the terms of the Creative Commons Attribution License (CC BY). The use, distribution or reproduction in other forums is permitted, provided the original author(s) and the copyright owner(s) are credited and that the original publication in this journal is cited, in accordance with accepted academic practice. No use, distribution or reproduction is permitted which does not comply with these terms.
*Correspondence: Fengzhang Luo, bHVvZmVuZ3poYW5nQHRqdS5lZHUuY24=
Disclaimer: All claims expressed in this article are solely those of the authors and do not necessarily represent those of their affiliated organizations, or those of the publisher, the editors and the reviewers. Any product that may be evaluated in this article or claim that may be made by its manufacturer is not guaranteed or endorsed by the publisher.
Research integrity at Frontiers
Learn more about the work of our research integrity team to safeguard the quality of each article we publish.