 Litao Zhou
 Hong Xu
 Yaoli Zhang
 Gang Hong
95% of researchers rate our articles as excellent or good
Learn more about the work of our research integrity team to safeguard the quality of each article we publish.
Find out more
ORIGINAL RESEARCH article
Front. Energy Res. , 26 January 2023
Sec. Nuclear Energy
Volume 10 - 2022 | https://doi.org/10.3389/fenrg.2022.1079219
This article is part of the Research Topic Technological Frontiers in Gen4 Nuclear Energy Systems and Small Reactors View all 5 articles
A numerical simulation of Rayleigh–Bénard convection with supercritical carbon dioxide is presented in this paper. A shallow cavity with an aspect ratio of 4 is selected as a container that is fully filled with supercritical carbon dioxide. The influences of the bottom heat flux on the flow stability, flow pattern evolution, and heat transfer ability of Rayleigh–Bénard convection are analyzed. Meanwhile, the transient and steady-state fluid behaviors are obtained. The results show that the bottom heat flux plays a dominating role in the stability of the convection. A transition from stable evolution to significant oscillation is found with the increase of the heat flux. The flow pattern evolution also strongly relies on the heat flux. A four-cell structure to a six-cell structure transformation accompanied by the orderly multicellular flow is observed with increasing heat flux. In addition, the local Nusselt number on the bottom wall is strongly related to the cell structure in the cavity.
Rayleigh–Bénard (RB) convection is among the most typical natural convections. The fluid heated at the bottom comes to be warmer and lighter and tends to be pushed upward by the buoyancy force. Meanwhile, the cooler fluid from the top, in turn, falls downward to take the warmer fluid’s place. The pioneering work of RB convection was conducted by Bénard (1990). A hexagonal flow pattern was found in the water layer. After that, a great number of simulations and experiments have been conducted by researchers to investigate the stability, flow pattern, and heat transfer of the RB convection (Rayleigh, 1916; Xi et al., 2004; Baïri et al., 2007). The Rayleigh number (Ra), geometry structure, aspect ratio of the enclosure, and Prandtl (Pr) number of the fluids are considered to be the main factors affecting the RB convection.
Jeffreys (1926) proposed that the stability of RB convection can be judged by the critical Ra and obtained that the value is about 1708 by theoretical analysis for an infinite rectangular cavity. In further studies, it was found that the values of critical Ra mainly depend on the boundary condition (Nield, 1968) and aspect ratio (Bagdassarov and Dingwell, 1994; Hébert et al., 2010; Harfash, 2014). For cylindrical cavities, the critical Ra decreases from about 2.55 × 10³ to 1.70 × 10³ as the aspect ratio increases from 1 to 9. Buell and Catton (1983) discussed the symmetry of the RB convective pattern at various aspect ratios by non-linear stability analysis. They found that the flow pattern could always be axisymmetric when the aspect ratio is 1, which agrees well with the results obtained by experimental analysis (Stork and Muller, 1975). In addition, a wide variety of flow patterns were observed by using numerical simulations, including concentric, radial, cross, and parallel rolls (Mukutmoni and Yang, 1995; Leong, 2002; Hébert et al., 2010). Aydin and Pop (2005) reported that the average Nusselt number (Nu) of RB convection rises with the increase of Ra. Funfschilling et al. (2005) concluded that Nu decreases along with the aspect ratio. However, Zhou et al. (2012) found that Nu would be independent of the aspect ratio with a large Ra.
Most previous studies on RB convection were conducted with Boussinesq fluids because their densities vary linearly with temperatures. However, the Boussinesq approximation is not suitable for supercritical fluids, which exhibit unusual asymptotic behaviors of fluid properties near the critical point. The behaviors of RB convection would be complicated by this phenomenon through compression and dissipation contributions. Recently, the RB convection of supercritical fluids has attracted great attention.
The vertical temperature oscillations of RB convection are reported in a supercritical 3He experiment conducted by Meyer and Kogan (2002). The ensuing numerical and theoretical studies (Chiwata and Onuki, 2001; Amiroudine and Zappoli, 2003) reproduced these oscillations and yielded a great agreement for these results. Additionally, the piston effect theory was proposed to explain the rapid thermal relaxation shown in an experimental study on supercritical fluids (Boukari et al., 1990; Onuki et al., 1990). Shen and Zhang (2010) investigated the thermomechanical effect in a slab of supercritical nitrogen and obtained the effect on acoustic emission propagation and reflection patterns by heating rapidity. A transient study on supercritical nitrogen, also conducted by them, found the transient fluid behavior with various Ra (Shen and Zhang, 2012).
The research on supercritical RB convection in the past has been confined only to obtaining the flow and heat transfer characteristics under different aspect ratios and Pr. However, few studies pay attention to the effect of heat flux on supercritical RB convection. In this work, a series of numerical simulations were performed to investigate the RB convection of supercritical carbon dioxide. At the same time, the stability, flow pattern, and heat transfer characteristics were discussed at various bottom heat fluxes.
The physical model and coordinate system for RB convection of supercritical carbon dioxide near its critical point are shown in Figure 1. The geometric dimensions used in the current numerical study are shown in Table 1. The aspect ratio of the computational domain is 4. Specifically, the height of the fluid layer is 2.5 mm, and the length is 10 mm. Such a shallow configuration is filled up with supercritical carbon dioxide.
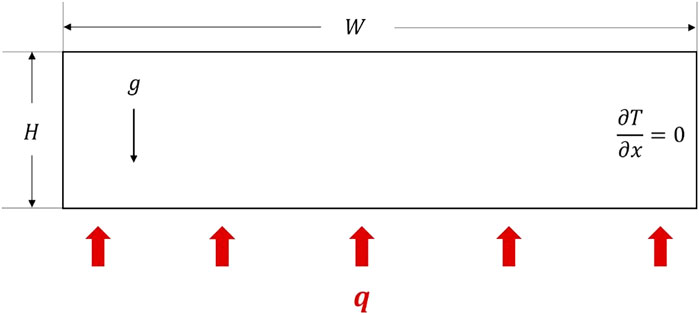
FIGURE 1. Physical model and coordinate system.

TABLE 1. Computational domain size parameters.
In this study, the fully compressible Navier–Stokes (N–S) equations are substituted by the low-Mach N–S equations in order to eliminate the acoustic interactions and compressibility effects. The conservation equations for mass, momentum, and energy equations for the fluid domain are shown, respectively, as follows:
In Eqs 1–3,
The initial and boundary conditions are shown as follows:
Here,
Ra and Nu are defined as follows:
Here,
The governing equations Eqs 1–3 are discretized with the finite-volume method (Patankar, 1980). The SIMPLE algorithm is applied for pressure–velocity coupling. The temporal term is discretized with the second-order backward scheme. For spatial discretization, the central difference method was adopted, and the convective term in the energy equation is handled with the third-order scheme QUICK. The thermophysical parameters of S-CO2 are based on NIST REFPROP 9.1 (Lemmon et al., 2013). The dimensionless time step varies from 10−4 and 10−2. Once the maximum relative error of the fundamental equations among the computational domain is lower than 10−7 at each time step, we reasonably consider that the iterative result is convergent to a solution and then calculate the next time step.
Few experimental results of supercritical RB convection have been conducted. Therefore, a numerical study of supercritical nitrogen RB convection in a shallow cavity is used for validation in this study (Shen and Zhang, 2012). Figure 2 gives the steady-state Ra–Nu relation based on the present numerical method and the results from Shen and Zhang (2012). The largest error bound of the Nu between the results is within 1.3%. Excellent agreements with the previous data are presented. Thus, the present numerical method is completely appropriate for dealing with RB convection of a supercritical fluid.
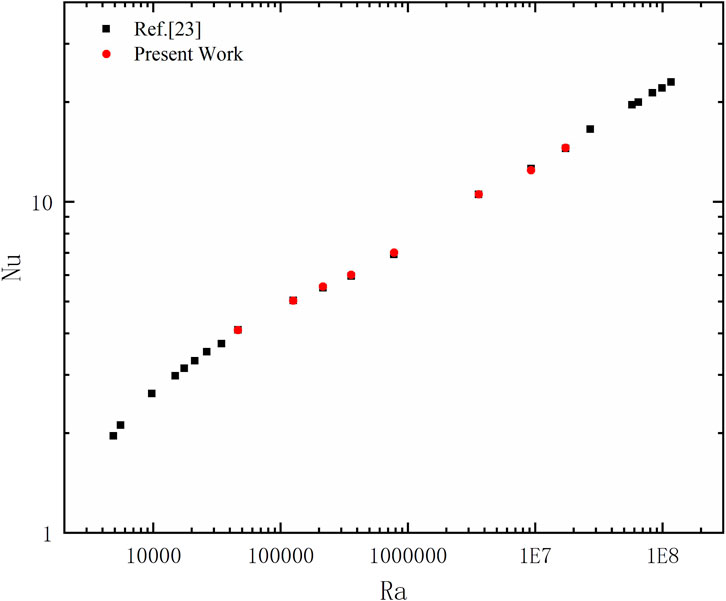
FIGURE 2. Variations of steady-state Nu with Ra.
Figure 3 gives the time evolution of the mean temperature drops ΔT across the entire cavity under different bottom heat flux values q after heating is initiated. For convenience of illustration, the ordinate has been scaled by the maximum temperature before convection occurred ΔTp, and similarly, the abscissa has been scaled by the first peak time tp. The result shows the unique transient characteristics of near-critical fluids: before reaching the final steady state, the variations of ΔT show an initial sharp temperature rise and subsequent damped oscillations. The variation of ΔT showed no fluctuation before reaching a final steady state at q = 0.5—1 W/m2. Differently, a slight temperature fluctuation appears when q = 5—10 W/m2. It is worth noting that oscillatory behavior in the steady-state temperature difference is related to the bottom heat flux. The temperature appears to oscillate significantly as the heat flux is greater than 50 W/m2, and ΔT seems confined to maintain larger than ΔTp.
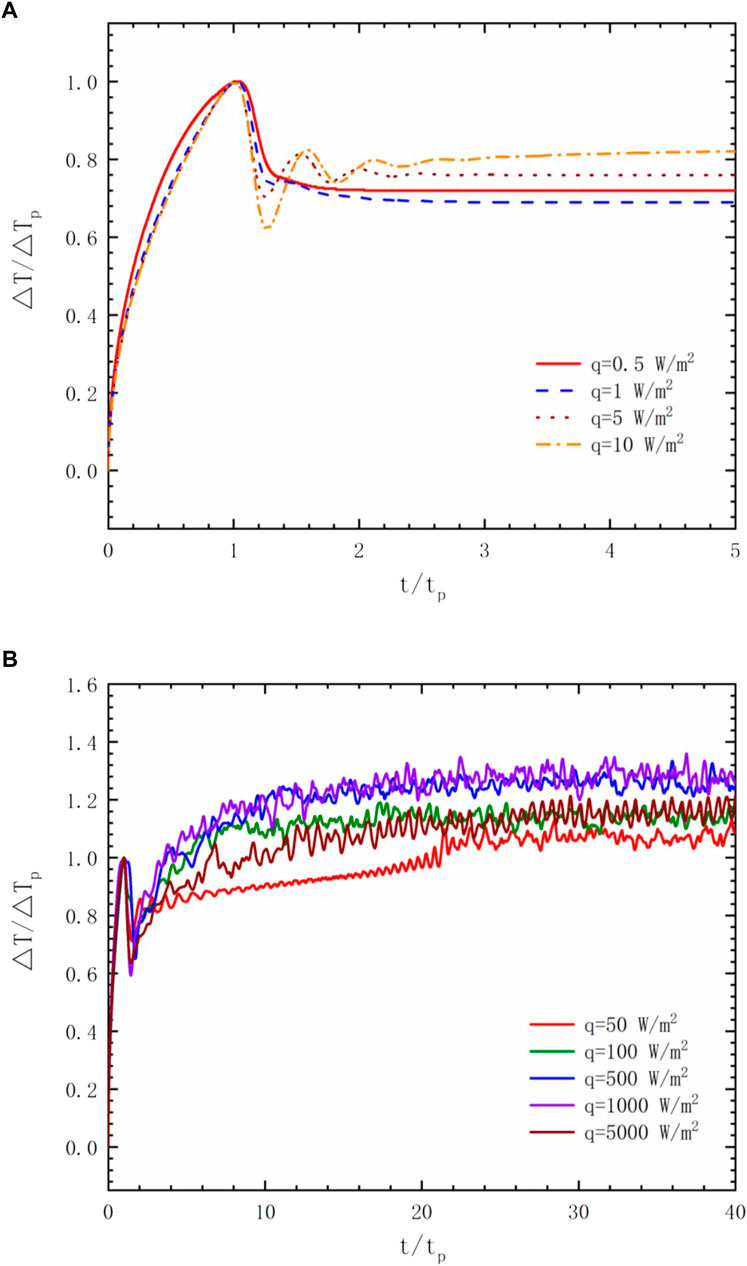
FIGURE 3. Variations of the horizontally averaged vertical temperature drop ΔT with the time evolution. (A) q = 0.5—10 W/m2. (B) q = 50—5000 W/m2.
Figure 4 shows the time evolution of the horizontally averaged Nusselt number of the fluid layer with different heat flux values. The heat transfer enhances with the rising of the heat flux, which is evidenced in the increase of Nu. Additionally, the manifestation of Nu is similar to that on the temperature; a significant oscillation exhibits in the heat flux range of 50—5000 W/m2.

FIGURE 4. Variations of the horizontally averaged Nusselt number Nu with time evolution. (A) q = 0.5—10 W/m2. (B) q = 50—5000 W/m2.
The space-averaged vorticity Ω of the fluid domain can be calculated based on the simulation results, which provides a good estimate of the intensity of the flow characteristic. Here, Ω is defined as follows:
where u means the horizontal velocity and v means the vertical velocity. The variations of the space-averaged vorticity Ω are presented in Figure 5. As the heat flux increases, the movement of the fluid initiates earlier. Additionally, Ω increases with the increase of the heat flux. Similarly, oscillations of Ω also occur when the heat flux is larger than 50 W/m2. The growing of Ω makes the fluid state muddled more actively. As a result, the variation of the bottom heat flux has a significant impact on the flow characteristic.
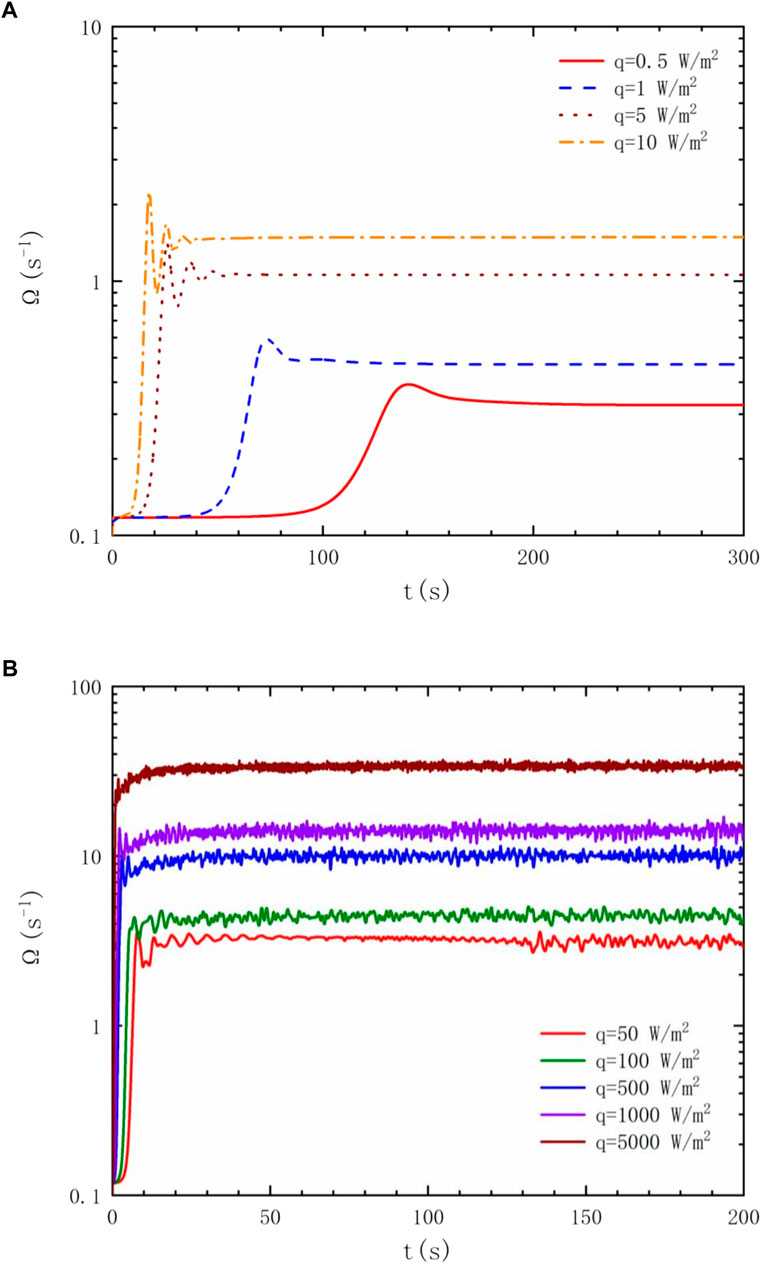
FIGURE 5. Space-averaged vorticity Ω as the time evolution with different heat fluxes. (A) low heat fluxes (q≤10 W/m2); (B) high heat fluxes (q≥50 W/m2).
The evolution of the temperature and vorticity fields for q = 0.5 W/m2 is presented in Figure 6. In the early stage of the heat transfer process (t = 78 s), as shown in Figure 6A, the fluid is largely free of macroscopic motion and presents a static and uniform heat conduction state. Vortex structures with a large structure but low intensity appear in the mainstream area of the fluid layer. Additionally, strong intensity vortex structures arise at the four corners of the closed cavity. By t = 115.4 s, as shown in Figure 6B, the temperature difference reaches its peak and the entire boundary layers become unstable. We observed more strong intensity vortex structures formed in the mainstream area. As heating progressed, the instabilities of the boundary layers become more obvious, as depicted in Figure 6C, when the peak of the space-averaged vorticity is obtained. In the final stable state, serious deformation of isothermals occurs along with the heating process, and the flow appears in the whole region, as shown in Figure 6D. The corresponding temperature profiles along the line x = 5 mm are plotted in Figure 7. We found a linear temperature distribution in the cavity at the initial stage (t = 78 s and t = 115.4 s). With heating being lasted (t = 140.8 s and t = 300 s), the temperature curve shows obvious non-linear changes at this time.

FIGURE 6. Time evolution of the convection patterns for q = 0.5 W/m2. Upper: temperature field; Lower: vorticity field. (A) t = 78 s. (B) t = 115.4 s. (C) t = 140.8 s. (D) t = 300 s.
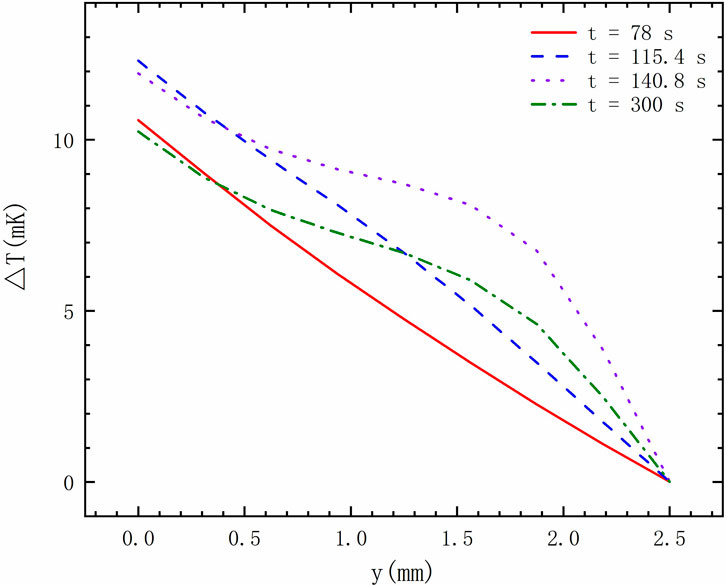
FIGURE 7. Temperature distributions along the line x = 5 mm.
The vorticity contours with different bottom heat fluxes are depicted in Figure 8, whereby a comparison among the different steady-state convection patterns can be made. The periodic flow with similar structures is observed in the cavity. Additionally, there is a gradual transition from a four-cell structure to a six-cell structure in the core area with increasing heat flux. It is interesting to mention that the two symmetrical cells in the middle are significantly smaller than the other four cells.
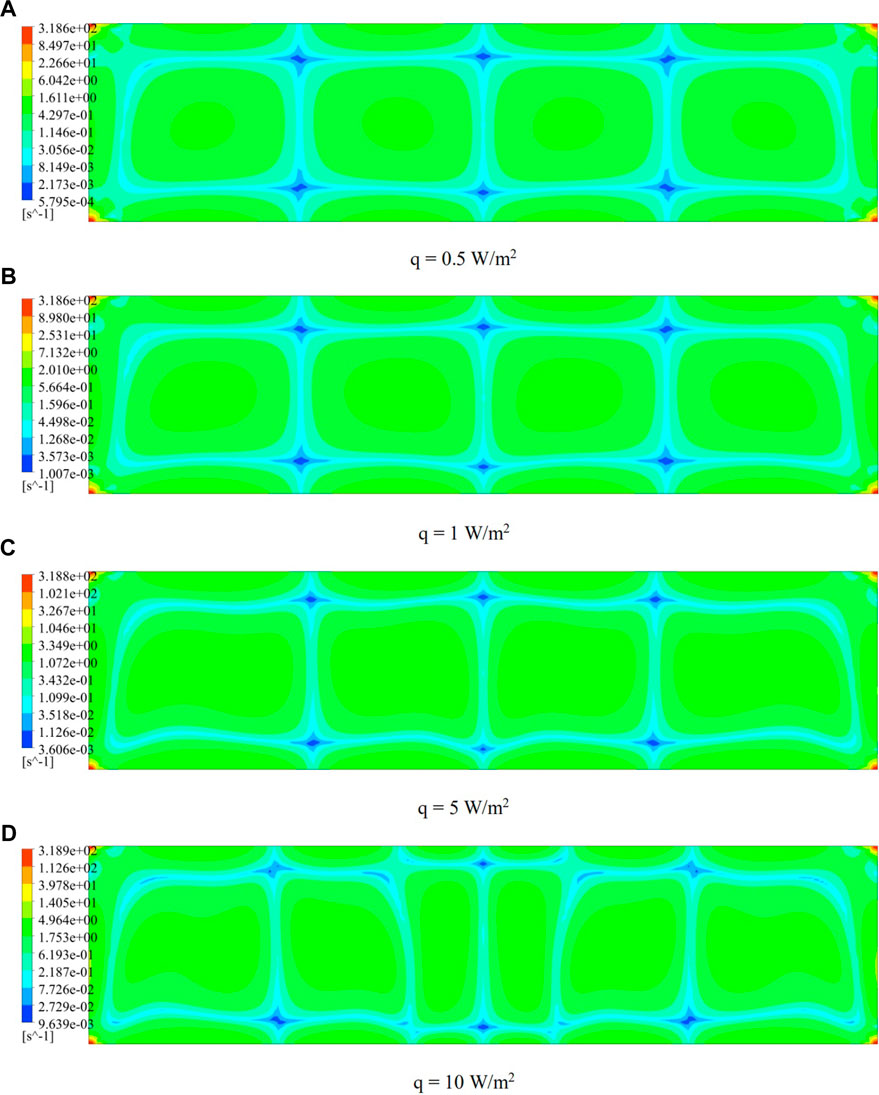
FIGURE 8. Comparison of the vorticity contours with different bottom heat fluxes in a steady state. (A) q = 0.5 W/m2. (B) q = 1 W/m2. (C) q = 5 W/m2. (D) q = 10 W/m2.
The evolution of the temperature field and vorticity field for q = 50 W/m2 is shown in Figure 9. At the beginning of the heating process (t = 3.5 s), as shown in Figure 9A, a static and uniform heat conduction state is observed at that time. In the figure, we found that larger vortex structures are distributed around the cavity. In addition, the structure of the vortex near the bottom wall is extremely larger than that near the top wall. As time increases (t = 6.3 s), Figure 9B exhibits a significant curl on the temperature layer when the temperature difference reaches its peak. Additionally, the large-scale vortex structure covers the interior of the cavity symmetrically. It can be seen from Figures 9B, C that the temperature layer develops curlier. Meanwhile, the vortex structure maintains a symmetrical distribution. As Figure 9E shows, the thermal plume drifts in the horizontal direction and the temperature field presents an asymmetrical distribution (t = 191 s). In addition, the vorticity field presents an erratic and unsteady flow state. The size, shape, and position of the vortex cells in the core of the fluid layer remain in this erratic state as time increases.
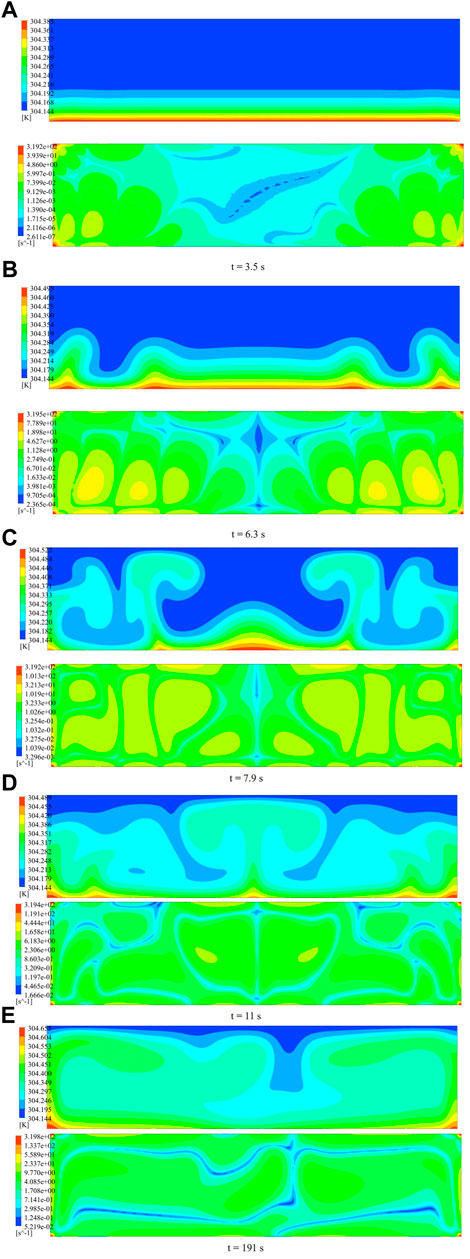
FIGURE 9. Time evolution of the convection patterns for q = 50 W/m2. Upper: temperature field; Lower: vorticity field. (A) t = 3.5 s. (B) t = 6.3 s. (C) t = 7.9 s. (D) t = 11 s. (E) t = 191 s.
The corresponding temperature profiles along the line x = 5 mm for q = 50 W/m2 are plotted in Figure 10. In the initial stage (t = 3.5—7.9 s), we found that the temperature in the cavity showed a non-linear distribution that changes from decline to stability. The fluctuation of the temperature occurs with the development of the fluid flow (t = 11 s and t = 191 s), which becomes more intense as time increases.
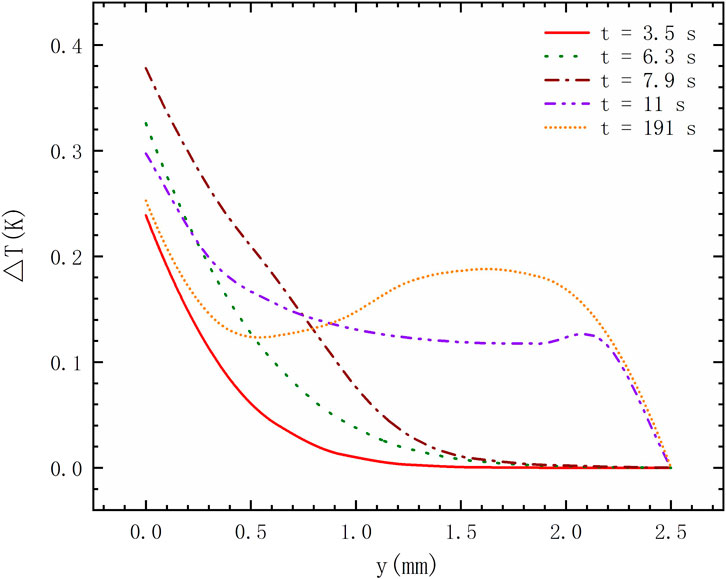
FIGURE 10. Temperature distributions along the line x = 5 mm.
The calculated results of various fluid dynamic and heat transfer properties of the RB convection with nine different bottom heat fluxes are listed in Table 2. It is evident to see that ΔTs, Ras, and Nus increase with the heat flux, and downward trends are manifested in tp. In Figure 11, we reveal the variation of the Nu and tp with different heat fluxes more intuitively. When the heat flux is small, Nu shows a dramatic rise with a small increase in the heat flux, and a sharp drop of tp is observed in the same range. As the heat flux increases, both the variation of Nu and tp gradually decreases.

TABLE 2. Calculations of the various fluid dynamic and heat transfer properties of the RB convection with nine different bottom heat fluxes.
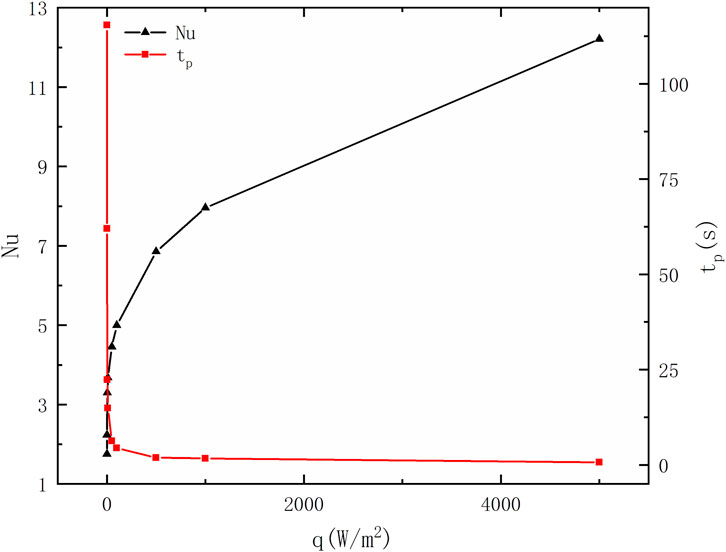
FIGURE 11. Variation of the Nusselt number Nu and first peak time tp with the heat flux.
Figure 12 shows the distributions of the local Nusselt number on the bottom wall at various bottom heat fluxes. The maximum or minimum Nusselt number always appears at a similar place when q = 0.5, 1, or 5 W/m2. In addition, the multiple peaks and valleys of the local Nusselt number are observed at the bottom wall when q = 50 W/m2. It should be pointed out that a slight increase in the Nusselt number is obtained near the sidewalls. The local heat transfer performance is enhanced with the increase in the bottom heat flux.
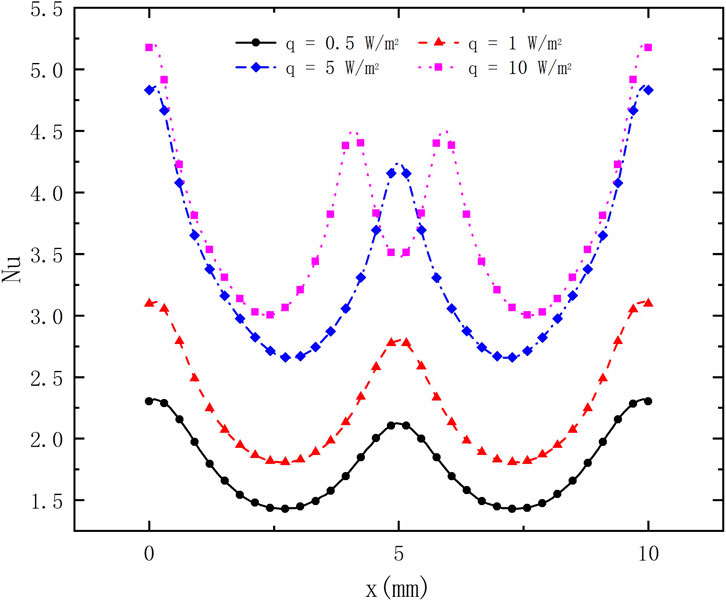
FIGURE 12. Distributions of the local Nusselt number Nu on the bottom wall at various heat fluxes.
It is clear that the results agree well with the benchmark, as shown in Figure 2, which validated the credibility of the present study. The variations of the steady-state Ra–Nu relation are compared with the numerical study of Shen and Zhang (2012). Therefore, it can be concluded that the model and the numerical method used in this work are realizable.
Figures 3–5 describe the evolution of temperature drop, Nusselt number, and vorticity with the bottom heat flux. All three parameters are significantly affected by the change of the heat flux. With a large heat flux at the bottom wall, oscillations that are confined to a limiting range appear in the fluid layer in its final plateaus. The temperature difference rose first with the heating process, and at this time, no convection initiated in the cavity. Once the convection commences, space-averaged vorticity of the fluid continues to rise precipitously until reaching the maximum, which is accompanied by a decrease in the temperature difference and an increase in the Nusselt number. The large bottom heat flux leads to high-intensity vorticity and a large Nusselt number, which indicates that the flow is more intense and complex. This phenomenon is related to the relationship between the dissipation effect caused by the viscosity and the buoyancy force. It can be concluded that a large bottom heat flux breaks the stability of the RB convection, which exerts a great influence on the flow and heat transfer performance.
Time evolution of the convection patterns with different heat fluxes has been given in Figures 6, 9. Obvious differences in flow patterns are observed in the temperature fields and vorticity fields with two different heat fluxes. A periodic pattern gradually arises with q = 0.5 W/m2, which is induced by the steady heat transfer between the adjacent eddies. Additionally, the large-scale circulation cells formed in the heating process play a leading role in the heat transfer through the fluid layer. The periodic pattern also initiated at early heating with q = 50 W/m2. However, this periodic result disappears due to the instability of the thermal boundary layer and is replaced by a chaotic flow state. The apparent strong interaction between the adjacent plumes could cause lateral deflection to the plumes, which move regularly upward or downward in the cavity. This interaction increases with the increase of the heat flux.
Compared with the steady-state vorticity fields with different bottom heat fluxes in Figure 8, a gradual transition of the vortex structure is noticed with increasing bottom heat flux. Specifically, the effect of heat flux on the cell structure is at first an intensity change and then a shape change of the vortex. The adiabatic lateral walls could make the fluid more unstable; thus, the cells will split due to the effects of this phenomenon.
Figure 11 depicts the influence of the heat flux on the heat transfer process specifically, and Table 2 indicates the calculations of the various fluid dynamic and heat transfer properties. The variation of the Nusselt number and first peak time shows that the influence of the heat flux on the heat transfer gradually dissipates as its increases. Additionally, the dissipation effects have almost no effect on heat transfer development with a large heat flux, which explains the steady evolution trend of the peak time. It can be concluded that a large heat flux leads to a better heat transfer performance, which is accompanied by a high Nusselt number and fast peak time. However, with a comprehensive consideration of the stability of the final plateaus, Nusselt number, and peak time, it is hard for us to shorten the peak time by increasing the heat flux, and a large heat flux also brings an oscillated fluid layer. Therefore, it is necessary to increase the heat flux within a certain range to obtain the best comprehensive heat transfer performance.
With the increase of the bottom heat flux, the flow pattern evolution becomes complex, as shown in Figures 8, 12. The number and locations of the peaks and valleys of the local Nusselt number are strongly related to the cell structure in the cavity. The slight growth of the Nusselt number near the sidewalls could be explained by the great vorticity at the corner of the bottom wall.
We have performed a series of numerical simulations to understand the flow and heat transfer characteristics of the Rayleigh–Bénard convection of supercritical carbon dioxide with different bottom heat fluxes in this paper. Both the transient and steady-state behaviors of the supercritical fluid that ensue from uniform bottom heating are obtained and analyzed. Based on the simulation results and discussion, the conclusions are as follows:
1. The final state of the fluid layer exhibits different results with different bottom heat fluxes. Steady convection rises with a small bottom heat flux, and a large bottom heat flux brings out a significant oscillation.
2. The size and intensity of the vortex structure are the most important factors that affect the heat transfer characteristics in the convection. The convective pattern brings about a gradual change from a four-cell structure to a six-cell structure. The intensity of the vortex increases first, and then, the number of vortex increases during the increase of the bottom heat flux.
3. The local maximum and minimum Nusselt numbers appear at the locations between two adjacent vortices that flow in opposite directions, respectively. The Nusselt numbers are strongly related to the cell structure in the cavity.
The original contributions presented in the study are included in the article/Supplementary Material; further inquiries can be directed to the corresponding author.
LZ: writing—original draft, methodology, investigation, formal analysis, and conceptualization. HX: investigation and formal analysis. YZ: writing—review and editing, validation, supervision, and methodology. GH: validation.
This work was supported by the Fundamental Research Funds in Xiamen University (Grant No. 2021-JCJQ-JJ-0383).
The authors declare that the research was conducted in the absence of any commercial or financial relationships that could be construed as a potential conflict of interest.
All claims expressed in this article are solely those of the authors and do not necessarily represent those of their affiliated organizations, or those of the publisher, the editors, and the reviewers. Any product that may be evaluated in this article, or claim that may be made by its manufacturer, is not guaranteed or endorsed by the publisher.
Amiroudine, S., and Zappoli, B. (2003). Piston-effect-induced thermal oscillations at the Rayleigh-bénard threshold in supercritical 3He. Phys. Rev. Lett. 90, 105303. doi:10.1103/physrevlett.90.105303
Aydin, O., and Pop, I. (2005). Natural convection from a discrete heater in enclosures filled with a micropolar fluid. Int. J. Eng. Sci. 43, 1409–1418. doi:10.1016/j.ijengsci.2005.06.005
Bagdassarov, N., and Dingwell, D. (1994). Thermal properties of vesicular rhyolite. J. Volcanol. Geotherm. Res. 60, 179–191. doi:10.1016/0377-0273(94)90067-1
Baïri, A., Laraqi, N., and García de María, J. M. (2007). Numerical and experimental study of natural convection in tilted parallelepipedic cavities for large Rayleigh numbers. Exp. Therm. Fluid Sci. 31, 309–324. doi:10.1016/j.expthermflusci.2006.04.017
Bénard, H. (1990). Les tourbillons cellulaires dans une nappe liquid. Revue Générale des Sci. Pures Appliquées 11, 1261–1271.
Boukari, H., Shaumeyer, J. N., Briggs, M. E., and Gammon, R. W. (1990). Critical speeding up in pure fluids. Phys. Rev. A . Coll. Park. 41, 2260–2263. doi:10.1103/physreva.41.2260
Buell, J. C., and Catton, I. (1983). The effect of wall conduction on the stability of a fluid in a right circular cylinder heated from below. J. Heat Transf. 105, 255–260. doi:10.1115/1.3245571
Chiwata, Y., and Onuki, A. (2001). Thermal plumes and convection in highly compressible fluids. Phys. Rev. Lett. 87, 144301. doi:10.1103/physrevlett.87.144301
Funfschilling, D., Brown, E., Nikolaenko, A., and Ahlers, G. (2005). Heat transport by turbulent Rayleigh-B´enard Convection in cylindrical samples with aspect ratio one and larger. J. Fluid Mech. 536, 145–154. doi:10.1017/s0022112005005057
Harfash, A. J. (2014). Three dimensions simulation for the problem of a layer of non-Boussinesq fluid heated internally with prescribed heat flux on the lower boundary and constant temperature upper surface. Int. J. Eng. Sci. 74, 91–102. doi:10.1016/j.ijengsci.2013.08.011
Hébert, F., Hufschmid, R., Scheel, J., and Ahlers, G. (2010). Onset of Rayleigh-Bénard convection in cylindrical containers. Phys. Rev. E 81, 046318. doi:10.1103/physreve.81.046318
Jeffreys, H. (1926). LXXVI. The stability of a layer of fluid heated below. Lond. Edinb. Dublin Philosophical Mag. J. Sci. 2, 833–844. doi:10.1080/14786442608564114
Lemmon, E. W., Huber, M. L., and Mclinden, M. O. (2013). NIST standard reference database 23: Reference fluid thermodynamic and transport properties REFPROP 9.1. Gaithersburg, MD: NIST NSRDS.
Leong, S. S. (2002). Numerical study of Rayleigh-BE´NARD convection in a cylinder. Numer. Heat. Transf. Part A Appl. 41, 673–683. doi:10.1080/104077802317418287
Meyer, H., and Kogan, A. B. (2002). Onset of convection in a very compressible fluid: The transient toward steady state. Phys. Rev. E 66, 056310. doi:10.1103/physreve.66.056310
Mukutmoni, D., and Yang, K. T. (1995). Thermal convection in small enclosures: An atypical bifurcation sequence. Int. J. Heat Mass Transf. 38, 113–126. doi:10.1016/0017-9310(94)00124-e
Nield, D. A. (1968). The Rayleigh-Jeffreys problem with boundary slab of finite conductivity. J. Fluid Mech. 32, 393–398. doi:10.1017/s0022112068000790
Onuki, A., Hao, H., and Ferrell, R. A. (1990). Fast adiabatic equilibration in a single-component fluid near the liquid-vapor critical point. Phys. Rev. A . Coll. Park. 41, 2256–2259. doi:10.1103/physreva.41.2256
Patankar, S. (1980). Numerical heat transfer and fluid flow. (1st ed.). CRC Press. doi:10.1201/9781482234213
Rayleigh, L. L. I. X. (1916). LIX. On convection currents in a horizontal layer of fluid, when the higher temperature is on the under side. Lond. Edinb. Dublin Philosophical Mag. J. Sci. 32, 529–546. doi:10.1080/14786441608635602
Shen, B., and Zhang, P. (2010). On the transition from thermoacoustic convection to diffusion in a near-critical fluid. Int. J. Heat Mass Transf. 53, 4832–4843. doi:10.1016/j.ijheatmasstransfer.2010.06.009
Shen, B., and Zhang, P. (2012). Rayleigh–Bénard convection in a supercritical fluid along its critical isochore in a shallow cavity. Int. J. Heat Mass Transf. 55, 7151–7165. doi:10.1016/j.ijheatmasstransfer.2012.07.031
Stork, K., and Muller, U. (1975). Convection in boxes: An experimental investigation in vertical cylinders and annuli. J. Fluid Mech. 71, 231–240. doi:10.1017/s0022112075002534
Xi, H-D., Lam, S., and Xia, K-Q. (2004). From laminar plumes to organized flows: The onset of large-scale circulation in turbulent thermal convection. J. Fluid Mech. 503, 47–56. doi:10.1017/s0022112004008079
Keywords: Rayleigh–Bénard convection, supercritical carbon dioxide, flow patterns, heat transfer, numerical simulation
Citation: Zhou L, Xu H, Zhang Y and Hong G (2023) Numerical simulation of Rayleigh–Bénard convection with supercritical carbon dioxide in a shallow cavity. Front. Energy Res. 10:1079219. doi: 10.3389/fenrg.2022.1079219
Received: 25 October 2022; Accepted: 28 November 2022;
Published: 26 January 2023.
Edited by:
Wenzhong Zhou, Sun Yat-sen University, ChinaReviewed by:
Shenghui Liu, Southeast University, ChinaCopyright © 2023 Zhou, Xu, Zhang and Hong. This is an open-access article distributed under the terms of the Creative Commons Attribution License (CC BY). The use, distribution or reproduction in other forums is permitted, provided the original author(s) and the copyright owner(s) are credited and that the original publication in this journal is cited, in accordance with accepted academic practice. No use, distribution or reproduction is permitted which does not comply with these terms.
*Correspondence: Yaoli Zhang, emhhbmd5bEB4bXUuZWR1LmNu
Disclaimer: All claims expressed in this article are solely those of the authors and do not necessarily represent those of their affiliated organizations, or those of the publisher, the editors and the reviewers. Any product that may be evaluated in this article or claim that may be made by its manufacturer is not guaranteed or endorsed by the publisher.
Research integrity at Frontiers
Learn more about the work of our research integrity team to safeguard the quality of each article we publish.