 Feifei Zhang1
 Yongheng Luo
 Fei Jiang
95% of researchers rate our articles as excellent or good
Learn more about the work of our research integrity team to safeguard the quality of each article we publish.
Find out more
ORIGINAL RESEARCH article
Front. Energy Res. , 15 November 2022
Sec. Process and Energy Systems Engineering
Volume 10 - 2022 | https://doi.org/10.3389/fenrg.2022.1067202
This article is part of the Research Topic Planning and Operation of Hybrid Renewable Energy Systems, Volume II View all 12 articles
In the context of global energy transition, integrated regional energy systems containing renewable energy sources play an important role. While improving the economic and carbon efficiency of energy utilization, renewable energy sources also bring research challenges to the safe and reliable operation of energy systems. Based on the region concept, a region model and optimal control method for integrated energy systems containing renewable energy are proposed. Firstly, the key pipeline is taken as the observation object, and the feasible region model of the integrated energy system is determined according to the capacity of key equipment and its pipeline capacity with the multi-energy balance equation as the feasible constraint. Then, considering the mutual backup relationship of different equipment and pipelines, the regional integrated energy system security region model is constructed based on the N-1 security criterion, and the optimal control method based on the region concept is proposed. Finally, the validity of the model is analyzed with arithmetic examples, and the influence of the access capacity and access location of renewable energy on the feasible and safe regions of the regional integrated energy system is discussed. And according to the actual situation of the working state point, the optimal adjustment strategy based on the efficiency function and security constraint is given.
Recently, due to extreme weather, Sichuan and Chongqing have faced a serious power rationing crisis. New energy sources, including wind energy and solar energy, are increasingly important for future energy development.(Li et al., 2018; Jiang et al., 2019; Jiang et al., 2022) On 21 May 2021, the National Development and Reform Commission and the National Energy Administration issued the Notice on the Establishment and Improvement of the Renewable Energy Electricity Consumption Guarantee Mechanism to assign responsibility for renewable energy consumption according to the actual situation of each province, so as to promote the construction of a new power system and the achievement of the “dual carbon” goal. The user side oriented regional integrated energy system (RISE) is getting extensive attention and rapid development. It has the important characteristics of green energy supply, high efficiency and low carbon, multi energy coupling and complementation. At the same time, the user oriented location advantage can facilitate the local consumption and utilization of renewable energy, thus reducing transmission loss and improving the economic and carbon benefits of energy utilization. However, due to the multi energy and heterogeneous characteristics of the integrated energy system, the interconnected and coupled multi energy networks can improve energy utilization, but at the same time, the fault accidents will also affect each other. The fluctuation of renewable energy output will aggravate the risk of mutual transmission of failures and accidents, and also bring severe challenges to the safety state analysis and safety boundary construction of the entire energy system.
The concept of region is an important method in static security analysis, which can obtain the reliable and safe operation range of energy system through the method of constructing security boundary. In the field of single energy grid research, literature (Xiao et al., 2018) proposed a direct calculation method for the security region of distribution network, and described the causes and physical significance of various area characteristics in the security region. Literature (Su et al., 2021a) proposed a new method to calculate the security region of integrated energy system, which can reduce the error of existing schemes and improve the estimation accuracy. Literature (Li X. et al., 2022) explores the voltage security region under large-scale renewable energy access and establishes a general optimization model, which can significantly improve the calculation efficiency. Literature (Maihemuti et al., 2021) proposed a dynamic security stability region calculation method based on hybrid algorithm for the security problems brought about by the rapid development of renewable energy. Literature (Ding et al., 2016) proposed a robust two-layer voltage security region model for possible cascading tripping events in wind farms, and conducted a complete modeling for the network results. Literature (Su et al., 2021b) explored the dual time scale characteristics of IES based on the static security region theory, and established an accurate steady-state security region model. Compared with traditional methods, its calculation method has been greatly improved. Literature (Nguyen et al., 2019) is based on Brouwer fixed point theorem and applied to the calculation of fixed points of power flow equation. Finally, effective internal approximation of feasible solution can be found through local search. Literature (Liu et al., 2020) proposed a method to construct the security domain based on the grid structure, which can solve practical problems well and visualize the security domain in 2D and 3D. Literature (Li W. et al., 2022) analyzes the comprehensive impact of renewable energy output fluctuation on power system probabilistic power flow from an overall perspective. Literature (Lei et al., 2021) describes the security region fluctuation space model of AC/DC distribution network in a mixed scenario, considering the high proportion of photovoltaic access.
It can be seen from the appeal that the research on security region and security boundary has been widely applied in the power system, but the research on the integrated energy system with close multi energy coupling started late, especially the regional integrated energy system with renewable energy access. Based on this, this paper proposes a comprehensive energy system domain model with renewable energy and an optimal control method. Firstly, the feasibility region model of integrated energy system with renewable energy is analyzed, and the stability feasibility margin of the system is described intuitively from the perspective of the region. Then, a security domain model of integrated energy system with renewable energy is built to analyze the impact of renewable energy access capacity and location on the security domain. Finally, a security optimization control method based on domain concept is proposed, which considers the comprehensive energy system efficiency function and security operation constraints, so as to achieve safe, reliable and efficient operation.
RISE faces the customer side and has a natural location advantage, which plays an important role in the local consumption of renewable energy. It considers each discrete traditional energy network, diversified energy supply sources and diversified energy demand, and aims to realize the mutual coupling and synergy of each energy flow and the full consumption of renewable energy. A typical structure of RISE is shown in Figure 1.
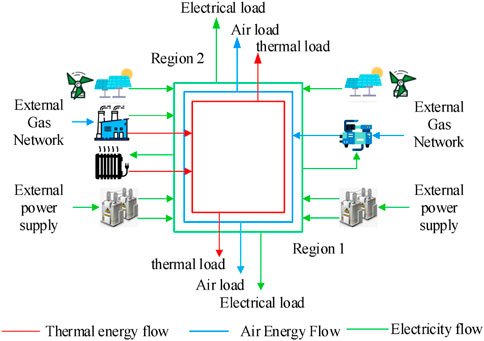
FIGURE 1. A typical RISE structure.
The RISE uses the original electric network and natural gas network as the basis, and expands the regional heat network according to the actual demand on the customer side. The main external energy sources of the RISE are the superior gas network, the superior power grid and the regional renewable energy sources. Two distributed energy stations are used to build a regional interconnected and interoperable integrated energy system. The distribution network generally adopts a radial or ring structure. The heat network is not suitable for long-distance and large-capacity transmission because of its unique transmission characteristics, so it is generally applied only at the campus level and adopts a radial grid structure. Natural gas network has less loss during transportation and is suitable for long-distance transmission, but requires compressor for pressurization. Meanwhile, in order to improve the safety and reliability of energy supply, the two regional distribution networks transmit interactive power through liaison lines, while the regional gas and heat networks adopt multi-source interconnection to ensure inter-regional mutual assistance and interoperability.
Taking the typical RISE in Figure 1 as an example, the key equipment and key structures of the distributed energy station are analyzed and introduced. Region 1 is built as a distributed energy station with mainly thermoelectric coupling, providing electrical and thermal energy for both regions, while taking into account the access to renewable energy in Region 1. The key equipment of the grid is two main transformers which are used as standby for each other, and the key lines include power feeders and renewable energy access feeders, etc; the equipment of the heat network includes CHP (Combined Heat and Power) units, gas boiler GB (Gas Boiler), circulating pump CP (Circulating Pump), and the key lines include hot water piping. Pump), and key lines with hot water pipelines. Area 2 is built as an electricity-gas coupled distributed energy station to provide electricity and natural gas for both areas, while taking into account the renewable energy access in Area 2. The key equipment of the grid is two main transformers with mutual backup, and the key lines include power feeders and renewable energy access feeders, etc. The equipment of the gas network includes several compressors C (Compressor) with mutual backup, and the key lines are natural gas transmission pipelines.
The two-parameter weibull-based stochastic probability model is widely used in engineering and also has good results in performing modeling of wind turbines (Ghofrani et al., 2013). The wind turbine probability distribution Pwout can be expressed as
Where: kw denotes shape factor, cw denotes scale factor; Vr, Vh, Vout, Vin denote rated wind speed value, actual wind speed, cut-out wind speed and cut-in wind speed respectively; Pwmax denotes maximum output power of wind turbine. And for PV generator sets, based on Beta probability distribution model has better results (Zhang et al., 2013), then the PV generator set output model can be expressed as
Where: ap denotes shape factor, βp denotes scale factor; Sh denotes light intensity and rated light intensity; PPV, max denotes maximum output power of PV generator set.
The study of the feasible region of the RISE can provide an intuitive understanding of the feasible margin of stability of the whole energy system from a global perspective, and can provide a theoretical basis for short-time dispatch operation, which is of great practical significance. (Relationship with the security region). At the same time, the high proportion of renewable energy access will have a non-negligible impact on the feasible region of the RISE, based on the probabilistic model of renewable energy, the feasible region of the RISE is analyzed.
The feasible region is the maximum supply range of the energy system that can guarantee normal energy use without failure. The feasible region portrays the boundary of stable system operation under different load demands and equipment operation states. When the load demand or equipment operation capacity crosses the feasible region, the tidal distribution will not have practical significance. In the RISE, each energy subsystem is coupled with each other, which inevitably makes its feasible region also have interlocking relationships. In this paper, each key pipeline is selected as the energy supply state observation point of the RISE, and its operation state already contains the key equipment operation, and at the same time, it can be tide optimization and control. Define the operation state vector L = [L1, L2, Lm] of the whole integrated energy system, which represents the energy supply state of a total of m key pipelines.
Under the key equipment and grid structure constraints, the feasible region of the integrated regional energy system can be expressed as
Where: f(L) = 0 indicates the equation constraint of the critical pipe network under normal operation; g(L) ≤ 0 indicates the inequation constraint of the critical pipe network under normal operation. The equation constraint of RISE is the multi-energy flow balance constraint, including the energy balance equation of distribution network system, thermal system and natural gas system. There are many related researches, so I will not repeat them here.
The feasible region contains not only the equation constraints of the reaction energy balance relationship, but also the inequality constraints of critical pipelines and critical equipment. Under normal conditions, the operational constraints of the integrated regional energy system are mainly determined by the capacity of equipment and the allowable through-capacity of pipelines. To determine the feasible region of the RISE, the following principles are followed: 1) the through capacity of the key pipeline cannot exceed the upper and lower operating boundaries of the pipeline. 2) The through capacity of key pipelines connected with key equipment cannot exceed the capacity of key equipment 3) The minimum capacity of pipelines should ensure the energy supply of their coupled equipment. Figure 2 is taken as an example to illustrate the inequality boundary of the regional integrated energy system with renewable energy.
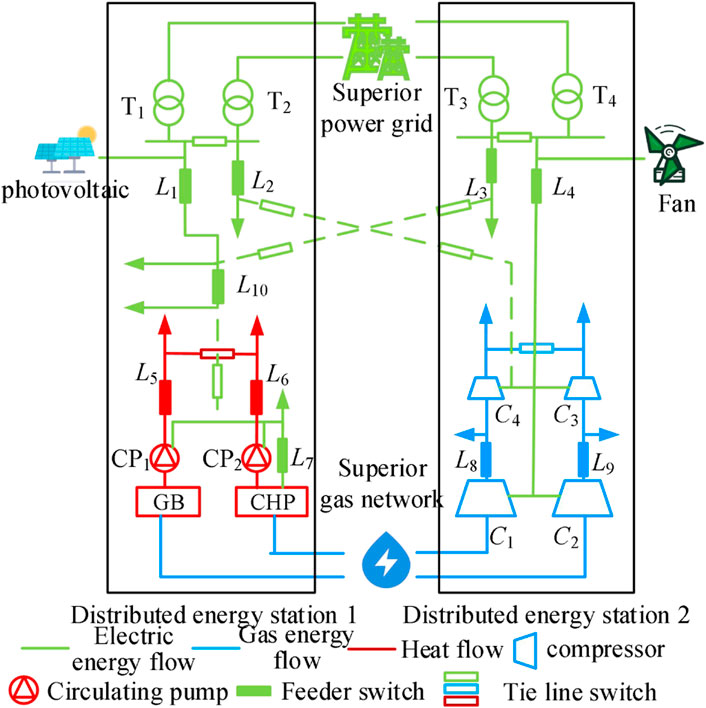
FIGURE 2. Regional integrated energy system diagram including renewable energy.
For the power system pipeline L = {L|L1,L2,L3,L4,L7,L10}, the pipeline constraint analysis is performed. Pipeline L1 and pipeline L4 operate in similar states, both have renewable energy intervention, and renewable energy generation has probability, which makes the key pipeline operation boundary has certain probability, and the probability function φ(x) can be applied to probabilize renewable energy, and the probability function of photovoltaic power generation is Ppvφ1(x), and the probability function of wind power generation is Pwφ2(x). The probability model of φ(x) can be detailed in Section 2.2. After considering the effects of transformer capacity and renewable energy generation, the feasible boundaries of L1 and L4 are
Where: CL1 denotes the capacity of pipeline 1; CT1 denotes the capacity of transformer T1;PC1,PC2,PC3, and PC4 denote the electrical power required by compressors C1,C2, C3and C4, respectively; for the analysis of the impact of renewable energy generation on the feasible region, Figure 3 denotes the probability boundary diagram of critical pipeline 1 with PV generation. The probability boundary diagram of critical pipeline L4 with wind power generation is shown in Figure 3. For the operation upper boundary of pipeline L1, there are two cases: when the capacity of pipeline L1 is large enough, its operation upper boundary is determined by the capacity of the transformer connected to it and PV generation, and its probability boundary is shown in Figure 3; when the capacity of pipeline L1 is not large enough, its operation upper boundary is determined by the capacity of L1, and at the same time, the transformer will not be in full-load operation to ensure the full consumption and safe operation of renewable energy.
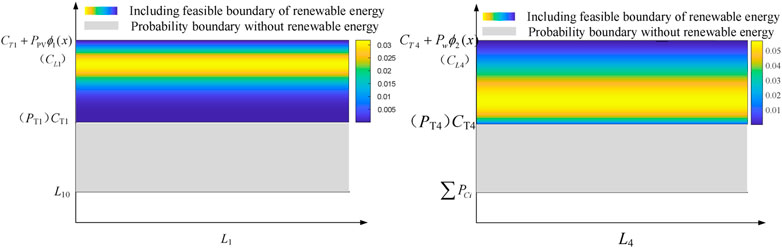
FIGURE 3. Probability boundary diagram of L1 and L4.
In normal operation, the distribution network is open-loop operation, L2 and L3 operating state is similar, and its operating boundary is determined by its own capacity and the connected transformer, and its operating boundary can be expressed as
Where: CTi shows the transformer Ti capacity; CLi shows the pipeline i capacity. The feasible boundary of pipeline L10 is
The feasible lower boundary of pipeline L7 needs to consider the reliable operation of the circulation pump, and its feasible boundary can be expressed as
Where: PCPi indicates the electrical power required by the circulation pump CPi. For the natural gas pipeline L = {L|L8,L9}, the main consideration is the capacity of the upper-level coupling equipment and the pipeline, and its operation boundary is
Where: CCi denotes the capacity of compressor Ci. For the heat line L = {L|L5,L6}, the line L6 needs to consider the influence of specific heat capacity of CHP unit, and the line L5 needs to consider the influence of the connected circulation pump, then its operation boundary is
Where: CCPi denotes the capacity of circulating pump CPi; CCHP,min, CCHP,max denote the minimum thermoelectric ratio and maximum thermoelectric ratio respectively; CGB denotes the capacity of gas boiler; CeCHP denotes the electrical capacity of CHP unit.
The security region is the area where the RISE can guarantee the maximum energy supply in case of N-1 failure. The safety region is an intuitive depiction of the safe operation of the whole energy system from the perspective of N-1 safety criterion, which provides a theoretical basis for the long-term safe operation of the integrated energy system. N-1 safety criterion is widely used in the scheduling operation and planning design of the integrated energy system, but the access of renewable energy affects the N-1 safety boundary, and this paper analyzes the safety region of the RISE based on the probabilistic model of renewable energy.
The main differences between the security region and the feasible region are as follows: First, the security region mainly depicts the maximum operating boundary that the energy system can guarantee reliable energy supply in case of N-1 failure of key equipment or key pipelines; The feasible region mainly describes the maximum operation boundary of the energy system to ensure reliable operation under normal operation conditions. Second, security region provides theory for long-term operation planning of energy system; The feasible region mainly aims at the short-term scheduling operation of the energy system. Thirdly, in case of failure, the overload capacity of key equipment and pipelines shall be considered. Under normal circumstances, it is not required. The security Region is included in the feasible region, which is the operation region established according to different constraints and purposes. During the construction of security boundary and security region, the equality constraint is consistent with the feasible region. See Section 3.1 for details, which will not be repeated here.
N-1 safety boundary analysis is mainly aimed at key equipment and pipelines. Because of their high probability of failure in the integrated energy system, the failure is often the most serious. The safety region of the energy system is determined by redistributing the load after the failure with the idea of globalization. The key equipment and key pipelines are standby for each other, so it is necessary to consider the interconnected energy subsystems as a whole.
The key equipment of the power system includes CHP units, transformers T1, T2, T3, T4, and key pipelines L = {L|L1,L2,L3,L4,L7,L10}. First, analyze the failure of key equipment. T1 and T2 are standby for each other, and their joint analysis is carried out. When T1 or T2 fails, the load carried by the fault transformer can be transferred to another transformer through the interconnection switch between them. The output of photovoltaic power generation can play a complementary role to electric energy, but it will also make the safety upper bound of L1 and L2 appear probabilistic. Its safety boundary can be expressed as
Similarly, wind power makes the upper boundary of L3 and L4 safety boundary probabilistic, and the formula is
When CHP unit fails, the load connected to L7 will be supplied by L10 feeder through tie line, so L10 safety boundary formula is
N-1 safety boundary is jointly constrained by safety boundary of key equipment and safety boundary of key pipe network. In case of failure of key pipelines, other pipelines will supply energy through tie lines, so it is necessary to analyze the key pipelines connected through tie lines in pairs. For the associated pipeline pair {L2, L4}, L2 failure, distributed energy station 2 supplies energy to another station. Taking L2 pipeline failure as an example, the system operates under failure as shown in the Figure 4. Then L2 security constraint boundary is
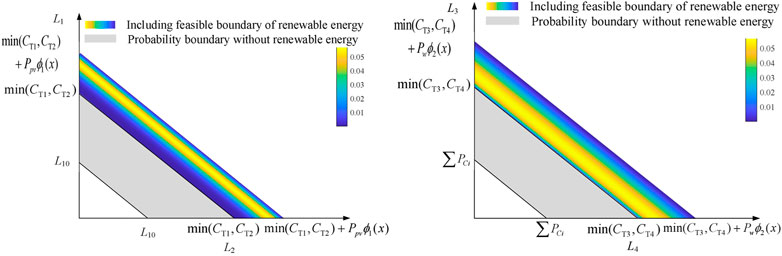
FIGURE 4. Probability boundary diagram of (L1,L2) and (L3,L4).
In case of L4 failure, the distributed energy station 1 supplies energy to L4, so the safety constraint boundary of L4 is
For the associated pipeline {L7, L10}, when L10 fails, CHP unit will provide energy for the failed line L10. The security constraint is
Where: CCHPe represents the maximum capacitance of CHP unit. In case of L7 fault, L10 will provide energy to the fault line L7 through the tie line, and its safety constraints are
In case of associated {L3, L10, L1} and L3 faults, the distributed energy station 1 transformer unit and CHP unit will supply energy to L3 through tie lines, and the safety boundary formula is
In case of L1 fault, distributed energy station 2 and CHP unit supply energy for L1 through tie line, then its safety boundary is
The key equipment of the thermal system includes circulating pumps CP1 and CP2, gas boilers GB and CHP units. The key pipelines are {L5, L6}. Key equipment are standby for each other. When gas boiler GB or circulating pump CP1 or pipeline L5 fails, the load will be provided by CHP unit, and the safety boundary is
Where: CCHPh represents the heat capacity of CHP unit. When CHP unit or circulating pump CP2 or pipeline L6 fails, its load will be provided by gas boiler GB and circulating pump CP2, and its safety boundary is
Where: CGB represents the capacity of gas fired boiler GB.
The key equipment of natural gas system includes compressor C1, C2, C3, C4, and key pipelines L8 and L9. In case of failure of compressor C1 or pipeline L8, the load carried by L8 will be provided by C2 through L9 and tie line, and the safety boundary is
In case of failure of compressor C2 or pipeline L9, the load carried by L9 will be provided by C1 through L8 and tie line, and the safety boundary is
Based on the boundary analysis method of feasible region and security region, the probability boundary of the two regions is determined according to the solution method of the region. The operation objectives of the feasible area and the security area are different. The feasible area explores the operation area of the integrated energy system under the constraint of equipment capacity, and the security area explores the safe and reliable operation area of the integrated energy system under the N-1 security criteria. In the actual control operation, the RISE can be safely dispatched according to the actual situation of the two regions.
Both the feasible region and the security region need to determine the maximum energy supply range of the regional integrated energy system containing renewable energy under the characteristic operation scenario, namely the upper bound of safe operation. The models of the maximum energy supply range of the feasible region and the security region are
Where:
Where: L is the power of each key pipeline; μ, L is the relaxation variable vector; According to the general form of the primal couple interior point method, the equation can be solved by using the Lagrangian function, which will not be repeated here.
In the actual operation of the regional integrated energy system, it may not fully meet the operation criteria of the security region, so it is necessary to optimize the control and adjustment of its operation status. Combined with the theory of feasible region and security region, the optimal control operation method of regional integrated energy system is proposed. In order to ensure the safe and reliable operation of the regional integrated energy system under fault, its operation status shall be included in the security region. The efficiency of a regional integrated energy system is closely related to its equipment utilization. The efficiency function (EF) based on the feasible region is defined, which represents the equipment operation utilization rate based on the Region concept. The formula is
Where: Limax represents the maximum energy supply capacity in the feasible area of the i-th pipeline; M represents a total of M pipelines. When the regional integrated energy system is optimized and controlled, the security region is taken as its security constraint, and the efficiency function is taken as the overall operation objective, the optimization model can be expressed as
Where: O represents the security area of the energy system in the region. However, when the current operating state is outside the security area of the regional integrated energy system, it is necessary to adjust the operating state first, and then optimize the state control. The adjustment principle is to determine the adjustment strategy based on the shortest parallel path (i.e. Manhattan distance), and the adjustment strategy can be expressed as
Where: LiU represents the safety upper limit of the i-th pipeline, and Li represents the output power of the i-th pipeline before adjustment. The flow of optimization control method based on region concept is shown in Figure 5
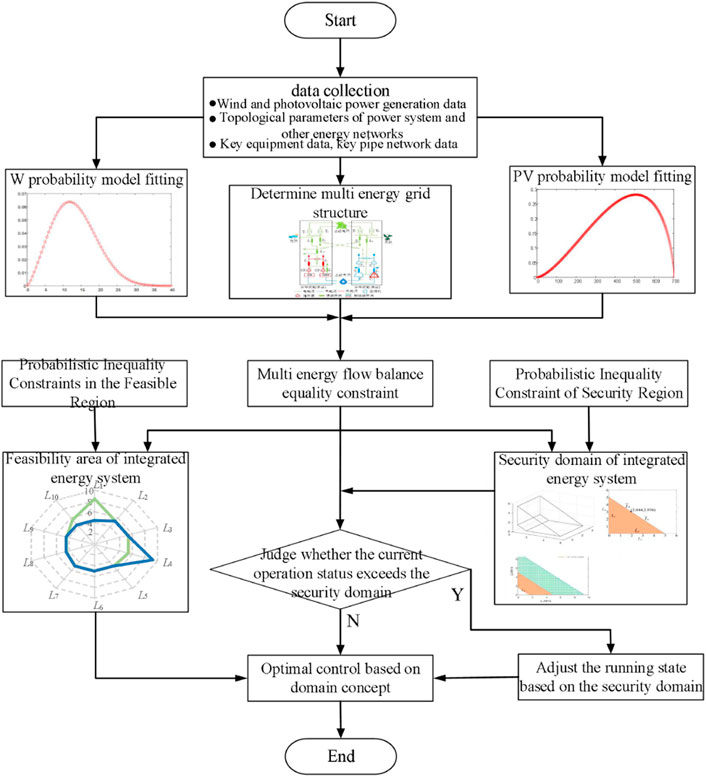
FIGURE 5. Flow chart of optimization control method based on region concept.
The calculation example parameters are set according to a comprehensive energy demonstration project to supply electricity, heat and gas. The main parameters are shown in the attached table. The power system adopts 10 kV low-voltage distribution network (Liu et al., 2020), and the overall power factor in the system is 0.9. The loop network hydraulic system is adopted for the thermal system, and the flow rate of the hydraulic pipeline is less than 3 m/s (Liu et al., 2020). The natural gas system adopts the sub high pressure natural gas network, and the flow rate of the pipeline is less than 10 m/s (Liu et al., 2020). Two distributed energy stations supply energy to the area at the same time. Simplify the pipeline and analyze the key pipeline. The topology diagram is shown in the attached table.
In the regional integrated energy system, each equipment has a certain overload capacity. In case of system failure, the equipment needs to be overloaded for a short time to reduce the occurrence of load loss. In this example, the overload capacity coefficient is set as 1, which can be set according to the actual situation. The simulation experiment is based on a PC, the CPU is AMD Ryzen 7 5700G with Radeon Graphics @ 3.8GHz, and the memory is 16 GB.
Based on the analysis in Sections 3.1, 3.2, the feasible region of the regional comprehensive energy system is obtained according to the feasible region solution method in Section 5.1. The maximum energy supply capacity of each pipeline without renewable energy is shown in Table 1.
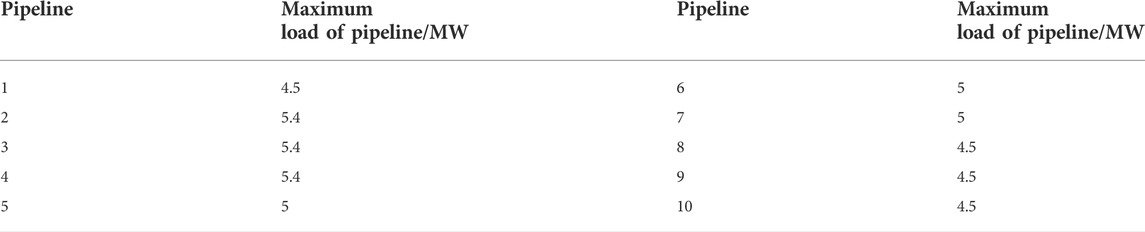
TABLE 1. Table of maximum energy supply capacity of systems without renewable energy.
It can be seen from the analysis in Section 3.2 and Table 1 that in normal operation, it is unnecessary to consider the mutual standby relationship of each equipment, and its maximum energy supply capacity is mainly related to its own capacity and superior equipment. CHP units have a deep degree of energy coupling. Although their thermal output and electrical output are mutually constrained, their electrical output and thermal output are relatively fixed under the maximum energy supply. Therefore, under the condition of maximum energy supply, the output of each pipeline is relatively fixed.
In the case of renewable energy access, it is bound to affect the feasible area of the regional integrated energy system. As shown in the Figure 6, the change diagram of feasible region of regional integrated energy system under different renewable energy access conditions. When wind power is fully generated, the maximum energy supply of L4 will increase by 1.35MW; When photovoltaic full generation is connected, the maximum energy supply of L1 and L10 will increase by 1.179 MW. When renewable energy is fully developed, the maximum energy supply range is increased from 49.2 MW to 52.908MW, and the maximum energy supply capacity is increased by 7.54%. To sum up, renewable energy access will increase the maximum energy supply range of corresponding pipelines and regional integrated energy systems to a certain extent. However, it is constrained by the carrying allowance of corresponding pipelines. Even if renewable energy is fully produced, the maximum energy supply has not been greatly improved.
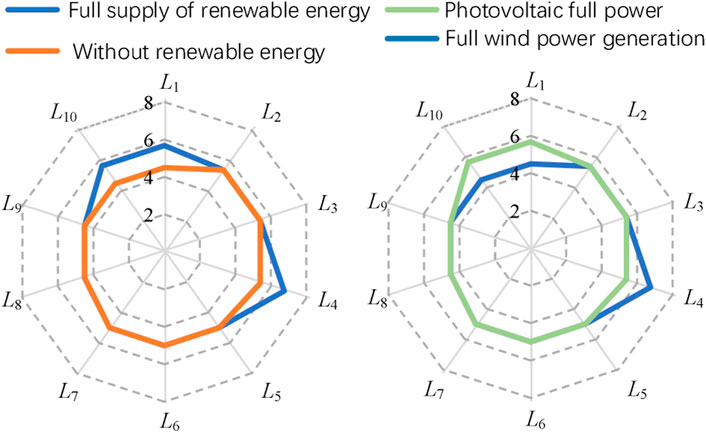
FIGURE 6. Change chart of feasible region of regional comprehensive energy system.
Based on the analysis in Sections 4.1, 4.2, the security region of the regional comprehensive energy system can be obtained according to the security region solution method in Section 5.1. The maximum energy supply capacity is 25.079 MW without renewable energy. Under the constraint condition of the safety area, the pipelines are mutually constrained and standby, and it is difficult to intuitively describe the coupling relationship in the full dimension observation, thus the accurate boundary of safe operation cannot be determined. In this paper, the security region of the al integrated energy system is determined by analyzing the relationship between the coupling standby pipeline combination.
In the case that renewable energy is not connected, select coupling pipelines (L1, L2) for two-dimensional safety zone observation. By solving multiple state points of the safety zone model and fitting them, the upper bound of safe operation of pipelines (L1, L2) can be obtained, as shown in Figure 7. L10 is a lower feeder of L1, and the lower bound of safe operation of pipelines (L1, L2) is the L10 energy supply load. However, since there is no standby coupling relationship between L10 and L2, it is uncertain in the (L1, L2) two-dimensional security region.
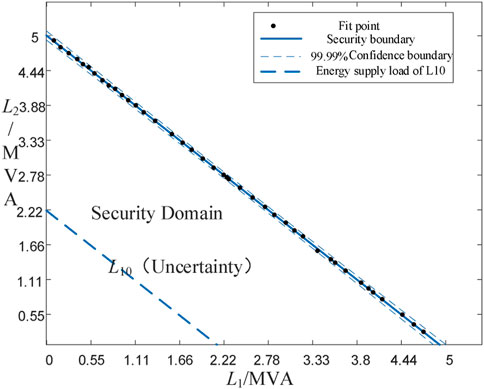
FIGURE 7. (L1, L2) safety boundary fitting diagram.
Similarly, the two-dimensional safety region of the thermal pipeline coupling combination (L5,L6) and the natural gas coupling pipeline combination (L8,L9) can be obtained, as shown in the Figure 8. See the appendix for the combined safety areas of other coupling pipelines. The points on the boundary of the security region are the maximum energy supply points of the coupling pipeline combination, and the points below the boundary are the safe operation points.
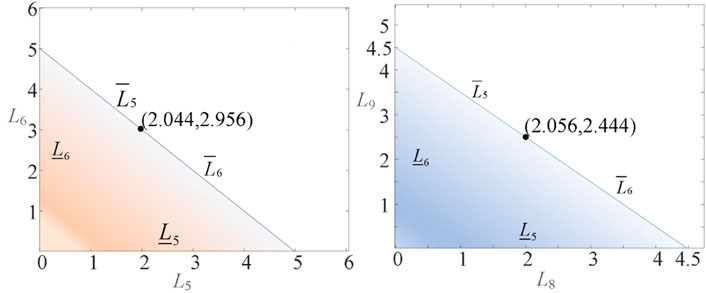
FIGURE 8. Two dimensional security region diagram.
The two-dimensional security region can only analyze the security constraint relationship of the mutual standby coupling pipeline, and cannot effectively observe the mutual constraint relationship under multi energy sources. Therefore, three-dimensional security region is required to describe the mutual constraint relationship under multi energy sources. The security region of electric power and natural gas multi energy pipelines (L1,L2,L8) is shown in Figure 9A, the security region of electric power and thermal power multi energy pipelines (L6,L7,L10) is shown in Figure 9B, and the security region of electric power, thermal power and natural gas multi energy pipelines (L1,L6,L8) is shown in Figure 9C.
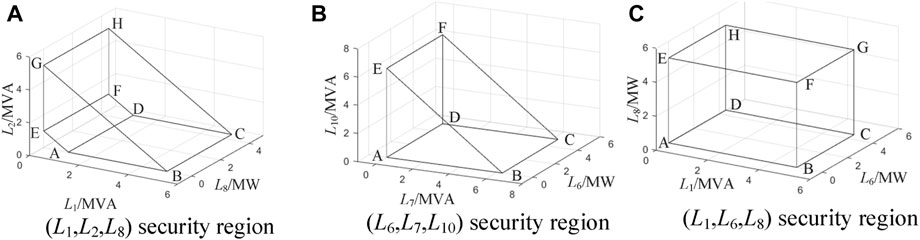
FIGURE 9. RISE three-dimensional security zone map.
In the three-dimensional security region, when the operation state of the regional integrated energy system is within the region, it means that the system is in a safe and reliable operation state under this state. Take (L1,L2,L8) security region as an example to illustrate the relationship between upper and lower boundaries. For pipelines (L1,L2), they have a mutual standby relationship. Face BCHG is the upper bound of common security, face ADEF is the lower bound of common security, which is determined by the energy supply load of L10, EFHG is the lower bound of L1 security, and ABCD is the lower bound of L2 security. For pipeline L8, its upper safety boundary is surface CDFH and its lower safety boundary is surface ABGE.
Whether renewable energy is accessed, access location and access capacity will have an impact on the security region. This paper analyzes and discusses the impact of renewable energy on the security region from three situations: full generation of renewable energy, full generation of photovoltaic power and full generation of wind power. When photovoltaic full generation is connected, the upper limit of L1 and L2 energy supply is increased by 5MVA. With photovoltaic access, the two-dimensional security region has been greatly improved, and the energy supply area of two-dimensional security region (L1,L2) has been increased by 32MVA2. The security region changes are shown in Figure 10. The change of three-dimensional security region (L1,L2,L8) is shown in Figure 10. After PV is connected, the two-dimensional and three-dimensional security areas have been greatly improved. The main reason is that there is still a margin for the pipeline configuration capacity compared with the transformer capacity. If the load in this area continues to increase, the energy supply capacity in this area can be increased by increasing the transformer capacity.
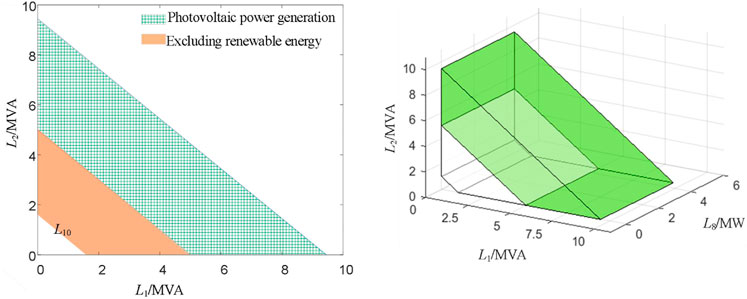
FIGURE 10. Change diagram of security region under photovoltaic access.
When full generation of wind power is connected, the mutual standby relationship between L1 and L2 remains unchanged, but the mutual standby relationship between L3 and L4 changes. Through in-depth analysis of the energy supply data of L1、L2、L3 and L4, it is found that (L1,L3) and (L2,L4) have a mutual standby relationship, which can also be reflected in the physical grid structure. The security region changes of [(L1, L3), (L2, L4)] are shown in Figure 11. After the wind power is connected, the two-dimensional and three-dimensional security regions are both improved, 26.8832MVA2, respectively, but the scope of improvement is less. The main reason is that the pipeline configuration capacity has less margin than the power capacity of transformers and other power sources. If the load in this area continues to increase, priority can be given to increasing the pipeline configuration capacity to improve the energy supply capacity in this area.
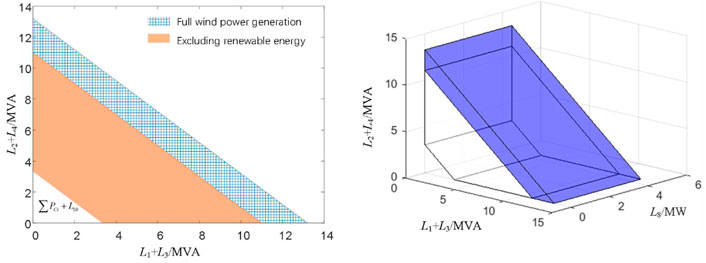
FIGURE 11. Change diagram of security region under wind power access.
Analyze the energy supply data of L1, L2, L3 and L4 when renewable energy is fully connected. The original mutual standby constraint relationship is changed. The operation constraint of L1 and L3 is determined by their standby relationship, and the operation constraint of L1 and L3 is determined by their standby relationship. Under the condition of full access to renewable energy, the energy supply scope of (L1,L3,L2,L4) security zone is expanded, and the energy supply area is expanded from 49.5MVAMW to 70.83MVA MW, an increase of 43.1% as shown in Figure 12.
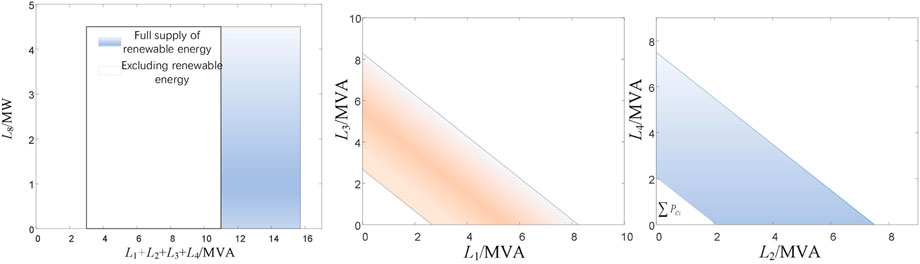
FIGURE 12. Change Diagram of Security region under Full Access of Renewable Energy.
To sum up, the access location and access capacity of renewable energy will have an impact on the feasible domain and the security domain. On the one hand, the access of renewable energy improves the upper bound of corresponding pipelines, and on the other hand, changes the backup constraints between pipelines. The randomness of renewable energy and the change of reserve constraints make the scope of the system security region uncertain, but the scope of the change of the security upper bound is a certain range. Different access locations of renewable energy will affect the increase of feasible area and security area. In the above calculation example, the PV and wind power access locations are different, and their grid structures are different. The increase of feasible domain and security domain after access is different. Renewable energy access will increase the capacity of feasible area and security area, but it is constrained by the grid structure and corresponding pipeline capacity of the connected location.
The optimization control based on region concept has two cases: one is to optimize the performance of the operation point in the security region. Second, the operation point is outside the security region, so it needs to be load reduced and adjusted before efficiency optimization. Select operation status points Q1 (1, 3.5, 2, 2, 2, 3, 4, 2, 2, and 0.5) and Q2 (3, 4.5, 4, 3, 2, 3, 2, 2, 2, 2, and 2) for example.
For operation point Q1, renewable energy in the region is not connected. First, determine whether it is within the security region. It can be seen from the results in Section 5.2.1 that it does not exceed the boundary of the security region, but it requires optimal control of efficiency. According to the definition of efficiency function, the optimization function is obtained, the operation state of Q1 point and the feasible threshold value are substituted into the function, and the optimized operation state of efficiency function: Q′1 (2.045, 2.455, 2, 2, 2.5, 2.5, 2.5, 4, 2, 2, and 0.5) can be obtained through optimization solution. Adjustment diagram of its operation adjustment process is shown in the Figure 13.

FIGURE 13. Q1 operation adjustment diagram.
For the operating point Q2, the photovoltaic power in the area is in the full power state. First, judge whether it is in the security region. Since (L3, L4) has exceeded the boundary of the security region, it is necessary to make security adjustment first, calculate the Mandaton distance between the operating point and the security boundary, and then optimize the efficiency function. After the adjustment, Q′2 (3.41, 4.09, 2.7, 2.7, 2.5, 2.5, 4, 2, 2, and 2), its operation adjustment process is shown in the Figure 14.
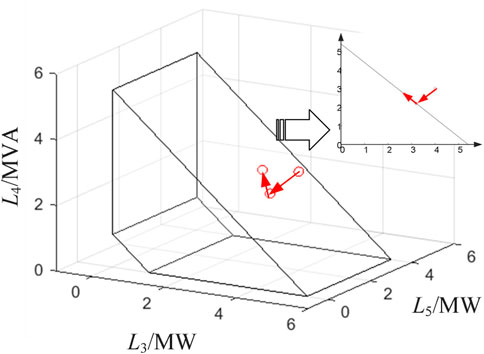
FIGURE 14. Q2 operation adjustment diagram.
Aiming at the problem of high proportion of renewable energy access, this paper proposes a comprehensive energy system region model with renewable energy and an optimal control method. Firstly, the feasible region model of integrated energy system is determined according to the capacity of key equipment and its pipeline. Then, considering the mutual standby relationship of different equipment and pipelines, based on N-1 safety criteria, a regional integrated energy system security region model is constructed, and an optimization control method based on the region concept is proposed. Finally, the effectiveness of the model is analyzed with a numerical example, and the impact of renewable energy access capacity and location on the feasibility and security regions of the regional integrated energy system is discussed. The following conclusions are drawn:
1) Renewable energy access will certainly increase the security area, but also make security randomization.
2) Under different access conditions of renewable energy, the mutual standby relationship of key pipelines will change, which will change the security boundary.
3) The improvement of the security area by renewable energy access is mainly affected by key pipelines.
The original contributions presented in the study are included in the article/Supplementary Material, further inquiries can be directed to the corresponding author.
FZ and YL contributed to the conception and design of the proposed method. All authors wrote and edited the manuscript.
This work is supported by State Grid Shanghai Electric Power Company Science and Technology Project (5209KZ21N005).
The authors declare that the research was conducted in the absence of any commercial or financial relationships that could be construed as a potential conflict of interest.
All claims expressed in this article are solely those of the authors and do not necessarily represent those of their affiliated organizations, or those of the publisher, the editors and the reviewers. Any product that may be evaluated in this article, or claim that may be made by its manufacturer, is not guaranteed or endorsed by the publisher.
The Supplementary Material for this article can be found online at: https://www.frontiersin.org/articles/10.3389/fenrg.2022.1067202/full#supplementary-material
Ding, T., Bo, R., Sun, H., Li, F., and Guo, Q. (2016). A robust two-level coordinated static voltage security region for centrally integrated wind farms. IEEE Trans. Smart Grid 7 (1), 460–470. doi:10.1109/TSG.2015.2396688
Ghofrani, M., Arabali, A., Etezadi-Amoli, M., and Fadali, M. S. (2013). A framework for optimal placement of energy storage units within a power system with high wind penetration. IEEE Trans. Sustain. Energy 4 (2), 434–442. doi:10.1109/TSTE.2012.2227343
Jiang, F., Peng, X., Tu, C., Guo, Q., Deng, J., and Dai, F. (2022). An improved hybrid parallel compensator for enhancing PV power transfer capability. IEEE Trans. Ind. Electron. 69 (11), 11132–11143. doi:10.1109/TIE.2021.3121694
Jiang, F., Tu, C., Guo, Q., Shuai, Z., He, X., and He, J. (2019). Dual-functional dynamic voltage restorer to limit fault current. IEEE Trans. Ind. Electron. 66 (7), 5300–5309. doi:10.1109/TIE.2018.2868254
Lei, P. E. I., Wei, Z., Chen, S., Zhao, J., and Yin, H. (2021). Security region of variable photovoltaic generation in AC-DC hybrid distribution power networks. Power Syst. Technol. 45 (10), 4084–4093. doi:10.13335/j.1000-3673.pst.2020.2012
Li, W., Wang, W., Wang, H., Wu, J., and Zhang, Y. (2022). Probabilistic power flow analysis method for power system with renewable energy based on security region theory [J]. Acta Energiae Solaris Sin. 43 (8), 1–7. doi:10.19912/j.0254-0096.tynxb.2020-0453
Li, X., Jiang, T., Bai, L., Kou, X., Li, F., Chen, H., et al. (2022). Orbiting optimization model for tracking voltage security region boundary in bulk power grids. CSEE J. Power Energy Syst. 8 (2), 476–487. doi:10.17775/CSEEJPES.2020.00720
Li, Y., Zou, Y., Tan, Y., Cao, Y., Liu, X., Shahidehpour, M., et al. (2018). Optimal stochastic operation of integrated low-carbon electric power, natural gas, and heat delivery system. IEEE Trans. Sustain. Energy 9 (1), 273–283. doi:10.1109/TSTE.2017.2728098
Liu, L., Wang, D., Hou, K., Jia, H. J., and Li, S. y. (2020). Region model and application of regional integrated energy system security analysis. Appl. Energy 260, 114268. doi:10.1016/j.apenergy.2019.114268
Maihemuti, S., Wang, W., Wang, H., Wu, J., and Zhang, X. (2021). Dynamic security and stability region under different renewable energy permeability in IENGS system. IEEE Access 9, 19800–19817. doi:10.1109/ACCESS.2021.3049236
Nguyen, H. D., Dvijotham, K., and Turitsyn, K. (2019). Constructing convex inner approximations of steady-state security regions. IEEE Trans. Power Syst. 34 (1), 257–267. doi:10.1109/TPWRS.2018.2868752
Su, J., Chiang, H. -D., and Alberto, L. F. C. (2021a). Two-time-scale Approach to characterize the steady-state security region for the electricity-gas integrated energy system. IEEE Trans. Power Syst. 36 (6), 5863–5873. doi:10.1109/TPWRS.2021.3081700
Su, J., Chiang, H. -D., Zeng, Y., and Zhou, N. (2021b). Toward complete characterization of the steady-state security region for the electricity-gas integrated energy system. IEEE Trans. Smart Grid 12 (4), 3004–3015. doi:10.1109/TSG.2021.3065501
Xiao, J., cao, Y., Tan, Y., Cao, Y., Liu, X., and Shahidehpour, M., (2018). Full-dimensional direct observation of distribution system security region. Trans. china Electrotech. Soc. 9 (1), 273–283. doi:10.19595/j.cnki.1000-6753.tces.191038
Keywords: renewable energy, regional integrated energy system, feasible region, security region, optimal control methods
Citation: Zhang F, Wang Y, Huang D, Lu N, Jiang M, Wang Q, Luo Y and Jiang F (2022) Integrated energy system region model with renewable energy and optimal control method. Front. Energy Res. 10:1067202. doi: 10.3389/fenrg.2022.1067202
Received: 11 October 2022; Accepted: 31 October 2022;
Published: 15 November 2022.
Edited by:
Liansong Xiong, Xi’an Jiaotong University, ChinaReviewed by:
Xiaokang Liu, Politecnico di Milano, ItalyCopyright © 2022 Zhang, Wang, Huang, Lu, Jiang, Wang, Luo and Jiang. This is an open-access article distributed under the terms of the Creative Commons Attribution License (CC BY). The use, distribution or reproduction in other forums is permitted, provided the original author(s) and the copyright owner(s) are credited and that the original publication in this journal is cited, in accordance with accepted academic practice. No use, distribution or reproduction is permitted which does not comply with these terms.
*Correspondence: Yongheng Luo, MTg3MzA5NjM4NEBxcS5jb20=
Disclaimer: All claims expressed in this article are solely those of the authors and do not necessarily represent those of their affiliated organizations, or those of the publisher, the editors and the reviewers. Any product that may be evaluated in this article or claim that may be made by its manufacturer is not guaranteed or endorsed by the publisher.
Research integrity at Frontiers
Learn more about the work of our research integrity team to safeguard the quality of each article we publish.