 Olof Gustafsson
 Alexander Schökel
 William R. Brant
- 1Ångström Laboratory, Department of Chemistry—Ångström, Structural Chemistry, Uppsala University, Uppsala, Sweden
- 2Deutsches Elektronen Synchrotron (DESY), Hamburg, Germany
Cathode materials that exhibit phase transitions with large structural rearrangements during electrochemical cycling are generally seen as disadvantageous. Large volume changes and lattice mismatches between intermediate phases tend to lead to significant kinetic barriers, as well as strain and particle cracking. In this regard, solid solution reactions are more desirable as they provide lower energy barriers and no miscibility gap between co-existing phases. The high-voltage cathode material LiNi0.5Mn1.5O4 is an interesting candidate for high power and rate capability applications, however little is known on how its phase transitions occur on the particle level. In the presented work operando X-ray diffraction was utilized together with detailed peak profile analysis to elucidate the phase transition mechanism dependency on transition metal cation order and current density. When fully disordered, the material was found to undergo a bulk single-phase solid solution reaction between the intermediate phases LiNi0.44Mn1.56O4 and Li0.5Ni0.44Mn1.56O4 followed by a first order phase transition with a coherent interphase between the intermediates Li0.5Ni0.44Mn1.56O4 and Ni0.44Mn1.6O4. When fully ordered and slightly less ordered, two separate first order phase transitions with a coherent interphase between the same intermediate phases were observed. On discharge, the fast kinetics of the transition between Li0.5Ni0.44Mn1.56O4 and LiNi0.44Mn1.56O4 resulted in less strain on the former phase. For all samples the miscibility gap between the intermediate phases narrowed with increased current density, suggesting that the solid solution domain formed at the coherent interphase can be extended when the rate of (de)lithiation exceeds the movement speed of the interphase at the phase transition. This effect was found to be larger with increasing cation disorder. The influence of transition metal ordering on the ability to form solid solutions is in good agreement with computational phase diagrams of LiNi0.5Mn1.5O4, showing that disorder is important for promoting and stabilizing solid solutions. These results indicate that the degree of transition metal ordering within the material is of importance for obtaining a material with small lattice mismatches between the involved intermediate phases and for rational design of full solid solution materials.
1 Introduction
Battery materials with high power and rate capability are of importance for expanding the application and integration of battery technology into modern energy solutions, e.g., in electric vehicles (EV) and more specifically for fast charging capabilities. Looking at the positive electrode side, most cathode materials exhibit structural re-arrangement and phase transitions during electrochemical cycling, which may limit the performance of the material. In particular, phase transitions involving large volume changes and miscibility gaps, e.g., first-order phase transitions, are typically considered disadvantageous for realizing high-rate performance, due to the associated kinetic barriers. Here, solid solution-type reactions are more desirable due to the elimination of strain propagation from phase boundaries within the active material particles.
A cathode material that exhibits good rate capability and that has seen usage in EV applications is the iron-based olivine-type material LiFePO4 (LFP). LFP undergoes a single first-order phase transition upon (de)lithiation between its two end-members LiFePO4 and FePO4 at low cycling rates. This kinetically limited two-phase reaction was shown, utilizing X-ray diffraction (XRD), to be bypassed in favor of a solid solution reaction at increased cycling rates (Liu et al., 2014; Zhang et al., 2014). Further, it was also shown that LFP can form metastable solid solutions after heating a two-phase mixture of the two end-members (Delacourt et al., 2005; Chen et al., 2007). In a similar fashion the high-voltage spinel cathode material LiNi0.5Mn1.5O4 (LNMO) was found to form metastable solid solutions after heating of two- and three-phase-mixtures of the end members LiNi0.5Mn1.5O4, Li0.5Ni0.5Mn1.5O4 and Ni0.5Mn1.5O4 (Saravanan et al., 2015). Where phase separation was found in the LFP solid solutions upon cooling to room temperature, the LNMO solid solutions exhibited more stability and remained at room temperature. Further, the first-order phase transition in LNMO was also found to move toward a solid solution-type reaction when cycled at elevated rates (≥5C) (Komatsu et al., 2015). However, the situation for LNMO is a little more complicated than for LFP due to the existence of two structural forms. That is, the material exhibits different structural behavior during (de)lithiation depending on the ordering between Ni and Mn within the structure (Kim et al., 2004). The disordered form undergoes a solid solution reaction between LiNi0.5Mn1.5O4 and Li0.5Ni0.5Mn1.5O4 followed by a single two-phase reaction between Li0.5Ni0.5Mn1.5O4 and Ni0.5Mn1.5O4 upon delithiation (and the reversed upon lithiation). The ordered form undergoes two separate two-phase reactions upon delithiation and lithiation. Often, the transition metal ordering in LNMO is not limited to these two discrete cases, but rather a degree of ordering (or cation mixing) is present in the material. How the nature of the phase transitions in LNMO is affected by the degree of cation mixing enables insight into what other parameters can influence the lattice mismatch, i.e., miscibility gap, between phases. More specifically, to what extent the degree of ordering in the material influences transitions from a two-phase reaction to a solid solution reaction.
In both the case of LFP and LNMO the transition from a two-phase reaction to a solid solution is not discrete. That is, a pure two-phase reaction or a full solid solution reaction across the entire Li composition is not observed. Rather, a metastable decrease in the miscibility gap occurs between the two end-members at higher rates (Liu et al., 2014; Komatsu et al., 2015; Strobridge et al., 2016). In the previously mentioned work on LFP (Liu et al., 2014), a detailed analysis of the peak profile was conducted, providing insight into the distribution of lattice parameters and thus quantifying the narrowing of the miscibility gap. For LNMO, such a detailed study on the transition from two-phase to a solid solution-type reaction has not yet been conducted. Further, given the differences in structural behavior of the disordered and ordered form, a comparison of the behavior at higher rates between them is of interest. As such, the aim of the study presented here is to further elucidate how the high rate structural behavior of LNMO is affected by cation ordering in the material. That is, to provide further quantitative insight into the factors which drive miscibility gap narrowing at higher rates and specifically the role of transition metal ordering.
2 Materials and Methods
2.1 Sample preparation
Pristine LiNi0.5Mn1.5O4 powder was provided by Haldor Topsoe. Further, to obtain additional samples with varying degrees of transition metal ordering, the pristine powder was annealed in two separate ways. To obtain a near fully ordered sample, annealing of the pristine powder was performed in a tube furnace under pure O2 gas flow. The powder was first heated to 760°C in 2 h followed by a temperature decrease to 710°C over 2 h and held for 5 h, followed by a temperature decrease to 300°C over 5 h. Finally, the sample was cooled down to room temperature over 2 h. To obtain a less ordered sample, the powder was heated to 760°C over 2 h, followed by a decrease in temperature to 710°C over 2 h. The temperature was then held at 710°C for 2 h followed by quenching of the powder by rapid dispersion on a stainless-steel plate.
2.2 Cell assembly and electrochemical characterization
Composite electrodes of two different thicknesses were prepared through a combination of ball milling and slurry casting, following the same procedure as described elsewhere (Gustafsson et al., 2021). The electrode composition was 90 wt% active material, 5 wt% carbon black (C65, Imerys) and 5 wt% polyvinylidene fluoride-based binder (Kynar 2801), dissolved in N-Methyl-2-pyrrolidone (≥99.7%, Merck), 2.5 and 4 wt%, for thinner and thicker electrodes respectively. The resulting capacity of the thicker electrodes was 0.7–0.8 mAh/cm2 with a porosity of around 40%–45%. The resulting capacity of the thinner electrodes was 0.30–0.35 mAh/cm2 with a porosity of around 40%. The prepared electrodes were then assembled in pouch cells with Li metal foil as the negative electrode in the same manner as in our previous study (Gustafsson et al., 2021). Prior to performing operando X-ray diffraction, all cells were pre-conditioned via galvanostatic cycling for two full charge/discharge cycles at a C-rate of C/2 (C = 147 mAh/g) between 3.5 and 4.9 V (vs. Li+/Li). This was done on an Arbin BT-2043 battery test system at room temperature.
2.3 Powder X-ray and neutron diffraction
Powder X-ray diffraction data was collected on the P02.1 beamline (Dippel et al., 2015) at the Petra III synchrotron in Hamburg, Germany, with a wavelength of 0.20698 Å. The detector utilized was a Perkin Elmer XRD1621 CN3 - EHS (200 × 200 µm2 pixel size, 2,048 × 2,048 pixel area). The wavelength and instrumental broadening contribution to the diffracted patterns were determined from measuring on a powder LaB6 standard (NIST 660c). Powder neutron diffraction data was collected on the Echidna high-resolution powder diffractometer (Avdeev and Hester, 2018) at the OPAL reactor in Sydney, Australia, with a wavelength of 1.6220 Å. All structural analysis of the collected diffraction data was performed using the TOPAS V6 software package (Coelho, 2018).
2.4 Operando X-ray diffraction
Operando X-ray diffraction measurements were carried out on the P02.1 beamline at Petra III. For collection of operando X-ray diffraction data, the pre-conditioned pouch cells were assembled in a dedicated cell holder, which is described in more detail elsewhere (Gustafsson et al., 2021). Galvanostatic cycling of the assembled pouch cells was performed using a BioLogic VMP3 potentiostat. Cells with higher mass loading were cycled galvanostatically at 1C and 5C between 3.5–4.9 and 3.5–5.1 V vs. Li+/Li, respectively. Cells with lower mass loading were cycled galvanostatically at 10C between 3.5 and 5.2 V vs. Li+/Li. A 60 s rest at open current voltage (OCV) was employed in between each charge and discharge. At 1C, data was collected continuously for 10 s per pattern, followed by a resting period of 10 s where no data was collected. At 5C and 10C, data was continuously collected for 5 s per pattern, with no resting period in between individual collections.
2.5 Diffraction peak shape modeling and Rietveld refinement of X-ray diffraction data
The whole-powder-pattern fitting approach taken by Liu et al. (2014) and Strobridge et al. (2016) was utilized for peak shape modeling of the X-ray diffraction data. A NIST standard material LaB6 (660c) was used to obtain the instrument profile, which was modeled by a symmetrical modified Thompson-Cox-Hastings pseudo-Voigt peak shape. The broadening contribution from crystallite size (L) was modeled with a Lorentzian peak profile, where the full width at half maximum (FWHM, β) varies with θ as shown in Eq. 1, where λ is the wavelength.
Peak broadening originating from strain and/or compositional heterogeneity was modeled by convolution of a symmetrical and an asymmetrical profile, following the same approach as Liu et al. (2014). The symmetrical broadening was modeled with a Gaussian peak profile where the FWHM as a function of θ is given by Eq. 2.
Here, E is the refined strain parameter. The asymmetrical broadening was modeled via an exponential function, f(θ), shown in Eq. 3, where εhkl is the refined strain parameter. Further, θ, is defined in the range [θhkl, +∞] if εhkl > 0, and [-∞, θhkl] if εhkl < 0.
The total peak profile is then a convolution of the symmetrical Lorentzian and Gaussian parts together with the asymmetric exponential function. The purely compositional/strain induced peak profile was then obtained from convolution of the Gaussian and exponential peak profile functions. The population density function (pdf) as a function of 2θ at a certain reflection hkl for one phase is then given by Eq. 4, where
The total population density function, considering all three LNMO phases, is then given by Eq. 5, where SF1, SF2 and SF3 are the scale factors of the three individual phases.
Since the structure of LNMO is cubic, the a parameter can be given from e.g., the (111) reflection. That is, the population density of the lattice parameter a for any of the three phases is given by pdf(2
3 Results
3.1 Powder X-ray and neutron diffraction
The crystalline structure and degree of transition metal ordering for the three LNMO samples were determined via a combined refinement of a model to X-ray and neutron powder diffraction data. The resulting observed and calculated patterns are shown in Figure 1. In all three samples, no presence of any crystalline impurity phases, e.g., rock-salt, could be observed. The pristine, as-obtained, transition metal disordered sample (d-LNMO) could be well indexed and modeled in the Fd
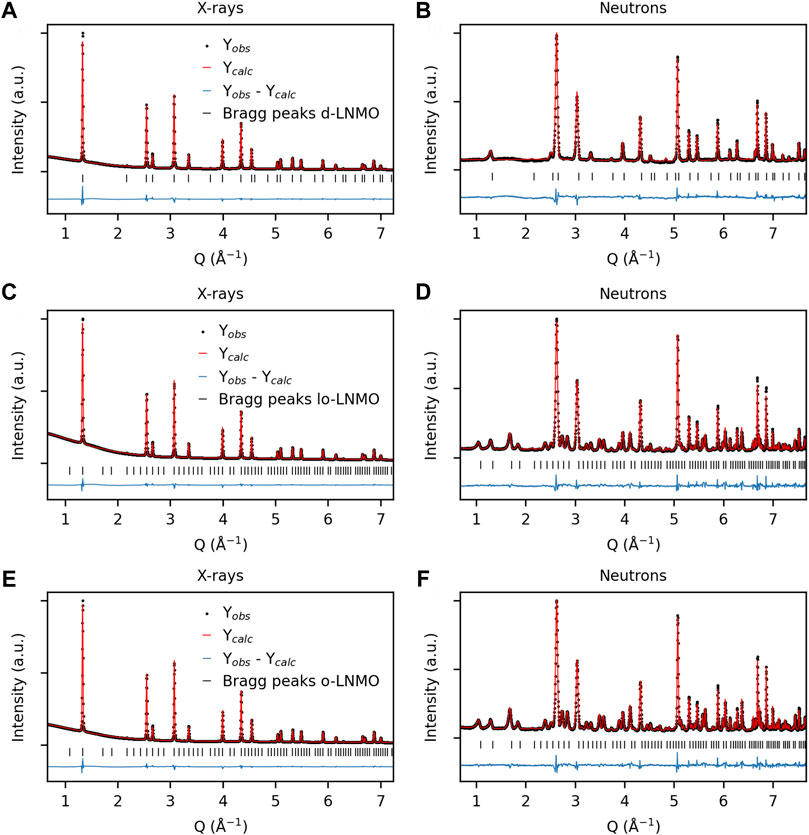
FIGURE 1. Observed and calculated diffraction patterns from combined Rietveld refinement of X-ray and neutron diffraction data for (A–B) disordered LiNi0.44Mn1.56O4 (d-LNMO), space group Fd
3.2 Operando X-ray diffraction
The results of the operando XRD measurements are summarized in Figure 2, where the change in Q of the (531) reflection for the three LNMO samples at cycling rates 1C and 5C is shown. As seen in Figure 2, the disordered LNMO sample exhibited, as expected, a solid solution-reaction for the composition Li1-δNi0.44Mn1.56O4 (where typically, 0 ≤ δ ≤ 0.5), indicated by a continuous shift in Q during (dis)charge. The two-phase reaction between Li1-δNi0.44Mn1.56O4 (δ ≈ 0.5) and Ni0.44Mn1.56O4 (Li0, Phase III) then follows, indicated by a discontinuity in the shift of the (531) reflection between the two end members. In the ordered samples, the two separate two-phase reactions between LiNi0.44Mn1.56O4 (Li1, Phase I) and Li0.5Ni0.44Mn1.56O4 (Li0.5, Phase II), and Phase II and Phase III can be identified respectively. Interestingly though, in the less ordered sample, the Phase I reflection appears to extend towards higher Q values, as compared to the fully ordered sample. This becomes more evident when comparing the individual diffraction patterns of the two samples in this region (highlighted as green), as shown in Figure 3. A larger shift in Q would indicate the appearance of a possible solid solution of the Li-rich Phase I, i.e., Li1-δ’Ni0.44Mn1.56O4 (0 < δ’ < 0.5), in the less ordered LNMO sample and a resulting decreased miscibility gap between Phase I and Phase II. When comparing the results between the two cycling rates, one general observation for all three samples can be made. At 5C, less scattering intensity is allocated at the center of the individual reflections, especially in the regions of co-existing phases, hinting toward a possible broadening of the diffraction peaks in all three samples. This broadening can be more clearly observed by studying the individual diffraction patterns as presented in Figure 3. Here peak broadening appears in all samples at 5C and is especially evident in the patterns where two or more phases co-exist, highlighted as green (Ccharge ≈ 50 mAh g−1, 1/3 SOC) and orange (Ccharge ≈ 100 mAh g−1, 2/3 SOC) in Figure 3. Also, when comparing the peak shape of the Li-rich Phase I at beginning of charge and end of discharge (blue), the broadening is not just symmetric, but rather asymmetric toward higher Q values. Given that the instrumental contribution to the peak profile was determined and then kept fixed, any additional observed broadening originates from the sample (Cheary et al., 2004). Further, since the broadening exhibits asymmetry this must be due to strain and/or compositional variations and not only changes in the crystallite size (Warren, 1990; Liu et al., 2014; Strobridge et al., 2016). Also, compositional variations within individual crystallites due to reaction inhomogeneity can be ruled out when considering the reported high Li-ion diffusivity (1.41–8.25∙10−9 cm2 s−1) of LNMO (Ma et al., 2010), in combination with the particle size (≈ 5 µm) and applied cycling rates here. To further illustrate this broadening, a fit from Rietveld refinement of the ordered LNMO sample at the co-existence of Phase I, Phase II and Phase III during cycling at 5C (the orange pattern in Figure 3F) is shown in Supplementary Figure S1. When no additional broadening is added, as compared to the refined peak profile on start of charge, the peak profile is clearly too narrow. When adding a combination of symmetrical and asymmetrical broadening, in this case a Gaussian, symmetric broadening from strain and an asymmetrical exponential function, the fit was significantly improved. Due to the physical differences in how symmetrical broadening occurs from strain and size, the respective broadening will vary differently with the scattering angle 2θ. Advanced analysis to separate these contributions, such as the Warren-Averbach Fourier analysis (Warren, 1990) can be undertaken, however, a more straight-forward method is to empirically fit the broadening using either a strain or size dependent model and comparing the two. Here, adding size-modeled broadening to the peak profile routinely gave a worse fit compared to a strain-modeled broadening, as shown in Supplementary Figure S2. As such, we can infer that the broadening occurring here is a product of strain and/or compositional variations within individual crystallites, causing a variation in lattice parameters in the sample. To further investigate how the broadening and the distribution of lattice parameters evolves during cycling of LNMO, a deconvolution of the different sources of broadening is needed and will be dealt with continuing further.
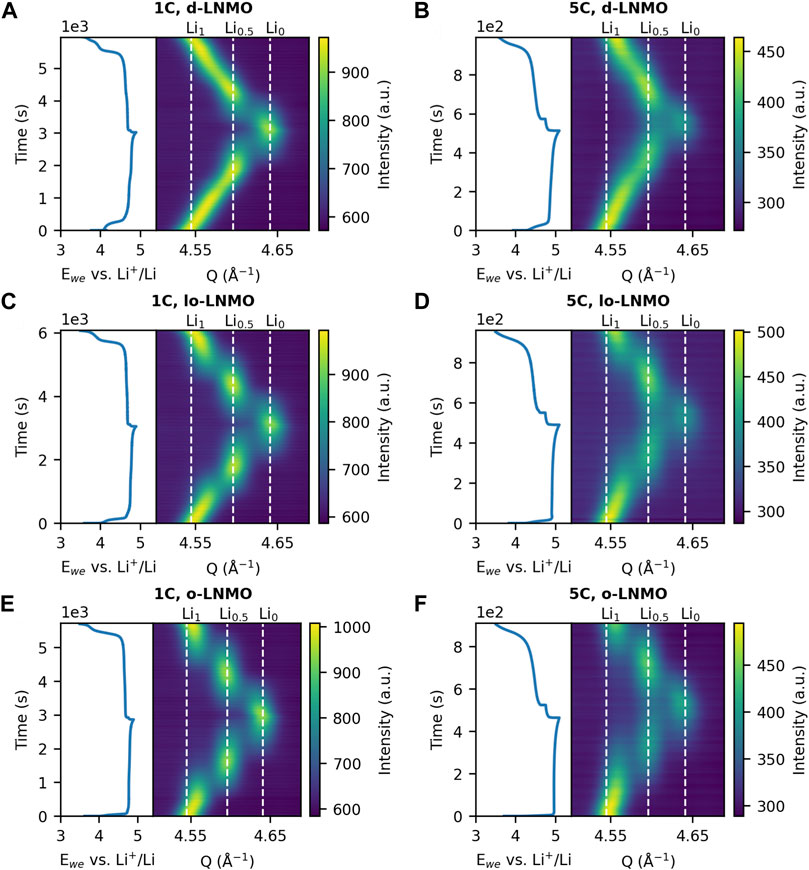
FIGURE 2. Change in Q of the (531) reflection during galvanostatic cycling at 1C and 5C of (A–B) disordered LNMO (d-LNMO), (C–D) less ordered LNMO (lo-LNMO) and (E–F) ordered LNMO (o-LNMO). The peak position of the intermediate phases LiNi0.44Mn1.56O4 (Li1), Li0.5Ni0.44Mn1.56O4 (Li0.5) and Ni0.44Mn1.56O4 (Li0) are indicated by the dashed white lines.
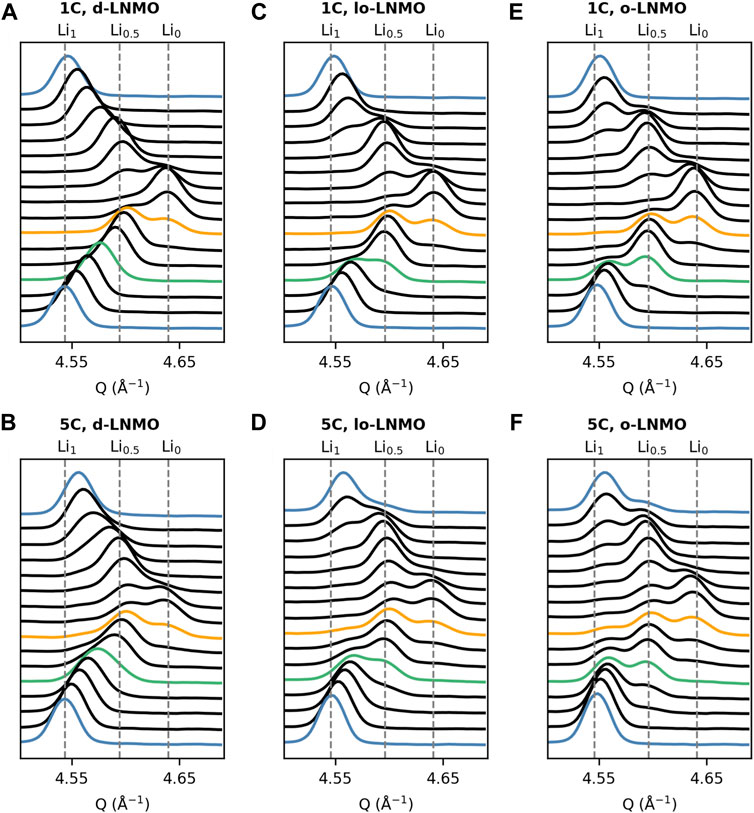
FIGURE 3. Plot of individual X-ray diffraction patterns in the region of the (531) reflection during galvanostatic cycling at 1C and 5C for (A–B) disordered LNMO (d-LNMO), (C–D) less ordered LNMO (lo-LNMO) and (E–F) ordered LNMO (o-LNMO). Patterns at beginning of charge and end of discharge are highlighted as blue. Patterns at a charge capacity of roughly 50 and 100 mAh g−1 (corresponding to ≈ 1/3 and 2/3 SOC) are highlighted as green and yellow respectively.
3.3 Quantifying the distribution of lattice parameters and miscibility gap narrowing
To quantify the distribution of lattice parameters, the same approach taken by Liu et al. (2014) was followed by first determining the instrumental broadening contribution and then separating the sample-induced broadening by deconvolution of the peak profile contributors. Broadening from crystallite size was found to be very minor for all samples and could thus be excluded from convolution of the purely sample related peak profile. The sample-induced peak profile was then obtained from a convolution of the symmetric strain and asymmetrical strain/compositional peak profiles, as detailed in the Materials and Methods section. Further, the population density function (pdf) was calculated from the resulting peak profile, depicting the population of lattice parameters for all three intermediate LNMO phases. The resulting evolution of lattice parameter population densities during galvanostatic cycling of d-LNMO, lo-LNMO and o-LNMO are summarized in Figures 4, 5.
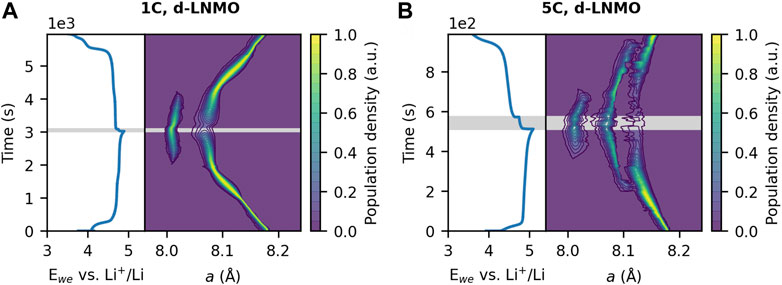
FIGURE 4. Distribution of the lattice parameter a during galvanostatic cycling at (A) 1C and (B) 5C of disordered LNMO (d-LNMO), together with associated voltage profiles respectively. The lowest contour of the population density is drawn at a value of 0.05. The rest period at OCV is indicated by the shaded grey area.
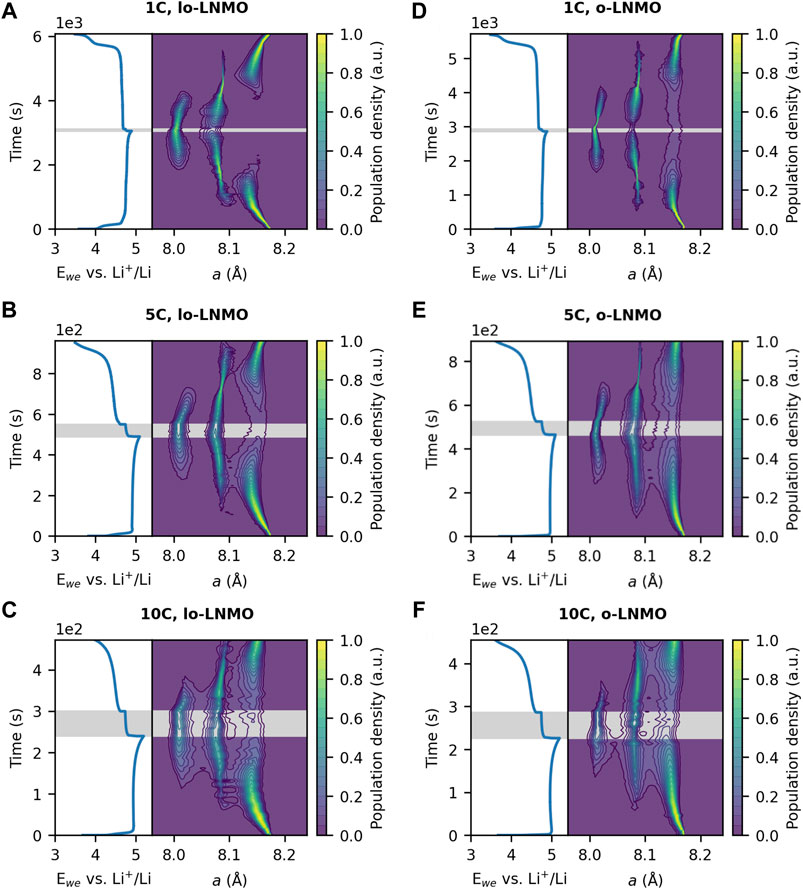
FIGURE 5. Distribution of the lattice parameter a during galvanostatic cycling at 1C, 5C and 10C, together with associated voltage profiles respectively, of (A–C) less ordered LNMO (lo-LNMO) and (D–F) ordered LNMO (o-LNMO). The lowest contour of the population density is drawn at a value of 0.05. The rest period at OCV is indicated by the shaded grey area.
3.3.1 Disordered LNMO
The disordered sample exhibits a single-phase solid solution bulk mechanism for the transition between Li1-δNi0.44Mn1.56O4 and Phase II, indicated by a continuous shift in lattice parameter with a narrow distribution at 1C. From the onset of the formation of Phase III, the lattice parameter distribution of Phase II widens both symmetrically, and asymmetrically towards lower values of a. The distribution of Phase III also appears wide with slight asymmetry towards higher values of a. This observation of asymmetry in the distribution for both phases indicate a distribution of lattice parameters in between the two end members. At 5C there is a clear phase separation between Li1-δNi0.44Mn1.56O4 and Phase II on both charge and discharge. This is likely because of Li-ion diffusion limitations at the electrode level. That is, poor mass transport through the composite electrode, resulting in reaction inhomogeneity between particles closest to the current collector and at the electrolyte interphase. (Strobridge et al., 2015). Interestingly though, at the transition between Phase II and Phase III the miscibility gap is narrowed at 5C, compared to at 1C. This is mainly attributed to an increased asymmetry in the lattice parameter distribution of Phase III.
3.3.2 Ordered LNMO
Looking at the ordered sample, the first-order transition between Phase I and Phase II is accompanied by an asymmetrical broadening toward lower and higher lattice parameters respectively, where the phases extend towards each other. The same is observed for the transition between Phase II and Phase III. For the less ordered sample, this is also the case, however, the miscibility gap here is significantly reduced for both phase transitions as compared to the ordered sample at 1C. The miscibility gap decreases for both samples at 5C, however more so for the transition between Phase I and Phase II. Some hysteretic behavior with regards to phase transitions upon charge and discharge can be observed in both the ordered and less ordered sample. At both 1C and 5C, the less ordered sample exhibits less broadening of Phase II during the transition to Phase I on discharge compared to on charge. The same observation can be made for the ordered sample at 5C. To further investigate this hysteretic behavior of the two ordered samples and to minimize contributions from reaction inhomogeneity, thinner electrodes with lower mass loading were also studied. These electrodes were cycled at 10C and the resulting lattice parameter distributions are displayed in Figures 5C,F. For both samples the miscibility gap is further decreased compared to at 5C. Also, the hysteretic behavior is gone for both samples, except for the transition between Phase II and Phase III in the ordered sample, where the miscibility gap is bigger between the two phases on discharge, compared to on charge. As a final remark it is also worth noting here that during the rest period at OCV the miscibility gap between Phase II and Phase III increases for the ordered sample.
4 Discussion
During electrochemical cycling of the active cathode material in a composite battery electrode, the individual crystallites may undergo different mechanisms of (de)lithiation which can contribute differently to the observed diffraction peak profile. Broadening from a decrease in the crystallite size, i.e., coherence length, may result from a bulk two-phase reaction, where two phases co-exist within single crystallites (Figure 6A) with a moving phase transition front. Such a decrease in the coherence length will produce a symmetric broadening of the diffracted peaks. Note that this mechanism differs from the domino-cascade model where the phase transition is fast within individual particles, resulting in single-phase crystallites. Broadening from strain and compositional variations may be expressed in similar ways in the peak profile, but their physical origin is different. Strain broadening, or rather microstrain broadening, may arise from a situation similar to the bulk two-phase mechanism, but where there is coherency at the interphase between the two phases (Figure 6B). This results in a distortion of the lattice on both sides of the interphase and a reduction in strain which manifest as an asymmetric broadening of the peak profile (Liu et al., 2014). If the nucleating phase is in minority, it will distort and experience a larger strain relative to the parent phase, resulting in asymmetric broadening of mainly the peak associated with the nucleating phase (Ravnsbæk et al., 2014; Strobridge et al., 2016) (Figure 6D). It should be noted here that the orientation of the interphase within single crystallites may differ from the illustration given in Figure 6, especially if there exist a strong core-shell Li-ion gradient or if the Li-ion diffusion is favored in certain crystallographic directions. However, considering the microstructure of the LNMO samples here, with primary particles of a size ≈ 1 µm (Supplementary Figure S3), in combination with a relatively fast Li-ion diffusion in LNMO (Ma et al., 2010), individual crystallites are not expected to experience a significant core-shell Li-ion gradient. Broadening from compositional variations can occur during high-rate induced solid solution reactions within individual crystallites (Figure 6C) and has been shown to occur in LiFePO4 (Liu et al., 2014; Zhang et al., 2014). In LFP, a solid solution was induced by an overpotential (Malik et al., 2013), resulting in a distribution of crystallites with various lattice parameters, manifested as a mainly asymmetric broadening of the peak profile. Since both the formation of a coherent interphase and a rate-induced solid solution generates an asymmetric peak profile, distinguishing which mechanism is occurring based solely on peak profile analysis is not trivial. However, how the broadening occurs in relation to the evolution of the individual phases involved can provide some indications to which mechanism is more probable. As such, this will be further discussed for the obtained lattice parameter distributions of the three LNMO samples.
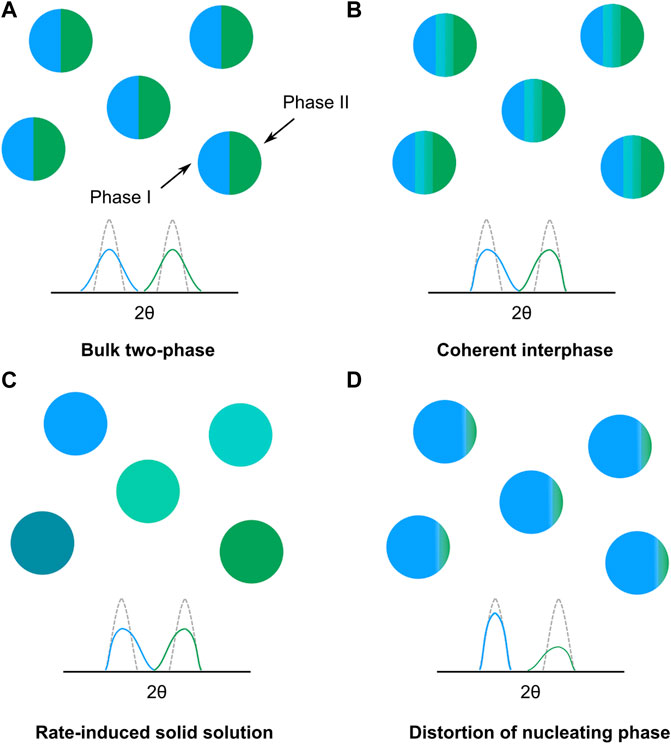
FIGURE 6. Illustration of different phase transition mechanisms during (de)lithiation and their qualitative impact on the observed diffraction peak profiles; (A) bulk two-phase mechanism, (B) two-phase mechanism with coherent interface, (C) rate-induced solid solution in individual crystallites and (D) distortion of a nucleating phase.
For disordered LNMO, the observed extension of Phase II and Phase III toward each other can be expected assuming a phase transition involving a coherent interphase, as was shown to occur by Komatsu et al. (2015) For a coherent interphase (Figure 6B), broadening should only start to appear when two phases co-exist within a single particle, since a requirement for an interphase to exist is the simultaneous presence of two phases. For both Co- and Mn-substituted LiFePO4, where a coherent interphase was identified as the mechanism for the two-phase transition, an initial lattice distortion of the nucleating phase was found (Ravnsbæk et al., 2014; Strobridge et al., 2016). Such an observation could not be made here, however, the effect in LiMn0.4Fe0.6PO4 was found to diminish significantly at a particle size of ∼106 nm (Ravnsbæk et al., 2014). Given the micron-sized particles of LNMO in this study, such an effect is considered to be negligible. Looking at the effect of an increased rate, the overall decrease in the miscibility gap can partly be attributed to the increased number of particles reacting at a single moment in time under higher current densities. Another possible contributor to the decreased miscibility gap is the rate-limiting step in LNMO during phase transitions, which is the rearrangement of chemical bonds at the interphase (Komatsu et al., 2015; Takahashi et al., 2016). The relatively slow rearrangement of these bonds results in the movement speed of the interphase becoming kinetically limiting at high rates (Komatsu et al., 2015). As the movement of the interphase becomes rate-limiting, a kinetically more favorable solid solution can be induced, resulting in an increased length of the coherent interphase. The increased length of the interphase results in an increase of the population of intermediate lattice parameters and ultimately a narrowing of the miscibility gap between the two phases. If the rate becomes great enough, the interphase could span the length of the particle, forming a non-equilibrium solid solution following the mechanism depicted in Figure 6C. A solid solution reaction for the transition between Phase II and Phase III in LNMO has been predicted at elevated temperatures from computational work (Lee and Persson, 2013). As such, it is not surprising that an overpotential could promote the formation of a solid solution reaction as suggested by the observations made here.
For both of the ordered samples, the phases involved in both first-order transitions extended towards each other during co-existence of two phases. This would indicate, as mentioned above, the formation of a coherent interphase. However, the smaller miscibility gap for the less ordered sample would imply that the coherent interphase is of a greater length compared to the ordered sample, possibly enabled by a lower energy barrier for formation of a solid solution. In the computational work performed by Lee and Persson (2013), the temperature for formation of a solid solution was significantly lowered, especially in the Phase I and Phase II region, already at a Ni deviation level at the 4a position of 1/16, corresponding to a 91.7% degree of ordering. Our results confirm this computational prediction where miscibility gap narrowing is observed already for 87.3% degree of ordering. The reduction of the miscibility gap with increasing current density was larger in both ordered samples for the transition between Phase I and Phase II compared to the transition between Phase II and Phase III. This can be attributed to the lower energy barrier for formation of a solid solution in this compositional region (Lee and Persson, 2013). As for the disordered sample, the overall decrease in the miscibility gap between Phase II and Phase III with increased current density can be understood from a combination of more particles being active and the rate of (de)lithiation exceeding the movement speed of the interphase at the phase transition. The hysteretic behavior shown for the two ordered samples, in regards to the phase transition between Phase I and Phase II, can be attributed to the differences in activation barriers of this transition upon charge and discharge. The transition from Phase I to Phase II have been shown to be kinetically faster than the transition between Phase II and Phase III (Arai et al., 2013; Takahashi et al., 2014; Takahashi et al., 2016), as a result of their respective activation barriers, leading to the immediate formation of Phase I as soon as the transition to Phase II is completed. Interestingly though, while Phase II shows little to no asymmetric broadening toward Phase I, the lattice parameter distribution of Phase I still extend toward Phase II. This observation would suggest a mechanism where the nucleating Phase I experiences a larger distortion as it starts to form in the pre-existing Phase II, as depicted in Figure 6D. The full conversion from Phase II to Phase I then follows quickly, due to the favorable kinetics of this transition. As a result, the metastable coherent interphase is not maintained (or at least travels too fast to be observed here via diffraction) in the same way as it is on charge, leading to the hysteretic behavior. At increasing current density, the hysteretic behavior is less apparent for both the less ordered and the ordered sample, suggesting that the increased rate of lithiation can compete with the faster kinetics of the phase transition, leading to the observation of the metastable coherent interphase again. However, at a similar current density, e.g., 5C, the hysteretic behavior is clearly visible for the ordered sample while diminished for the less ordered sample. This would suggest that the activation barriers vary with the degree of ordering in the material, especially also when comparing to the disordered sample, which does not exhibit any hysteresis.
Looking further into the perceived (in)stability during the rest at OCV for all three samples, an interesting observation can be made. The decreased miscibility gap seems to be maintained, to some degree, during the rest period at OCV in all cases, also at 10C for the ordered sample. Thus, the coherent interphase between the co-existing Phase II and Phase III, and the solid solution region spanning across it, appears to be at least metastable. This observation is in agreement with previous findings on stable room temperature solid solutions in LNMO, where the solid solution formed from a two-phase mixture at elevated temperature was stable also upon cooling down to ambient temperature (Saravanan et al., 2015). The formed interphase, and solid solutions, appear as such to be somewhat stable within the particles, providing a pathway for further solid solution reactions to occur in the material. For the ordered sample, the decrease in the miscibility gap during rest following charge at 10C suggests that Li redistributes in the material, resulting in an interphase of shorter length. Such an observation is not completely surprising, given a greater energy barrier for the formation of a solid solution in this compositional region for a fully ordered configuration in LNMO (Lee and Persson, 2013).
As a final remark, it should be stated that due to diffraction being a bulk sensitive technique, the results observed here reflect that. It is possible that multiple mechanisms may occur on the local, i.e., crystallite and particle, scale. Locally greater than average overpotentials may lead to the formation of a coherent interphase spanning across the crystallite/particle leading to a phase transition like the high-rate induced non-equilibrium solid solution in Figure 6C. Also, size-effects seen for LFP, such as differences in Li solubility and the ability to host a stable interphase (Ravnsbæk et al., 2014; Zhang et al., 2014), may also be present here although not visible in the diffracted pattern due to the low volume fraction of smaller particles. Size effects can however be expected to remain limited in the samples studied here, due to the relative size homogeneity for both the primary and secondary particles, as depicted from SEM imaging (Supplementary Figure S3). Further, since broadening from crystallite size was found to be very minor in all samples, the overall contribution from smaller crystallites to the observed peak profiles should remain small, also during electrochemical cycling. How the reaction mechanism varies on the local scale could be better probed by e.g., microbeam X-ray diffraction.
5 Conclusion
The reaction mechanism and changes in the miscibility gap as a function of rate and degree of transition metal ordering has been studied in LNMO utilizing operando X-ray diffraction. Detailed peak profile analysis and deconvolution was undertaken to separate broadening contributions and to quantify the distribution of lattice parameters in the material during cycling. Asymmetric broadening in the peak profiles was observed during two-phase transitions, indicating that domains within the active material populate lattice parameters that lie in between the equilibrium intermediate phases in LNMO. The suggested bulk mechanism for this is the formation of a coherent interphase between intermediate phases with an associated solid solution region across the length of the interphase. Disordered LNMO was found to undergo a single bulk-phase solid solution transition for the composition Li1-δNi0.44Mn1.56O4 (0 ≤ δ ≤ 0.5), followed by a two-phase transition with a coherent interphase between intermediates Li0.5Ni0.44Mn1.56O4 and Ni0.44Mn1.56O4 at both 1C and 5C. At increased current density, the coherent interphase appears to be of greater length with an extended Li compositional range of the solid solution region across the interphase, indicated by a decrease in the miscibility gap. Both the ordered and the less ordered sample exhibited two separate two-phase transitions with a coherent interphase between the intermediate phases LiNi0.44Mn1.56O4, Li0.5Ni0.44Mn1.56O4 and LiNi0.44Mn1.56O4 upon charge. Upon discharge, some hysteretic behavior was observed in the phase transition between the Li0.5Ni0.44Mn1.56O4 and LiNi0.44Mn1.56O4 phases compared to on charge, where the former phase exhibited less broadening. This was attributed to the lower activation barrier of this phase transition on discharge, leading to an initial distortion of the nucleating LiNi0.44Mn1.56O4 phase followed by a fast conversion of the Li0.5Ni0.44Mn1.56O4 phase. For the less ordered sample, the decrease in the miscibility gap is greater compared to the ordered sample, and the solid solution region across the interphase appear to span a greater Li compositional range. The miscibility gap decreased for both of the ordered samples at increased cycling rates, similar to the disordered sample, however more so for the transition between the intermediate phases LiNi0.44Mn1.56O4 and Li0.5Ni0.44Mn1.56O4. As such, for all three samples the miscibility gap decreased with elevated current densities, showing that solid solution behavior can be induced when the movement speed of the interphase at the phase transition becomes rate-limiting. This effect was greater with more disorder, highlighting that introducing disorder in the material, even to smaller extents, can both promote the formation and improve the stability of solid solutions in LNMO. The results indicate that the degree of transition metal ordering within the material is especially important for obtaining a material with low miscibility gaps between end member phases. Further introduction of disorder via off-stoichiometric compositions, high temperature synthesis or other cation substitutions could thus be beneficial for obtaining true solid solution reactions and improving the rate capability of the material.
Data availability statement
The raw data supporting the conclusions of this article will be made available by the authors, without undue reservation.
Author contributions
WB framed the original research idea, defined the experimental direction, helped with planning, supervised the project and revised the manuscript. OG designed the synchrotron experiment, constructed all batteries, performed all analysis and plotting and wrote the manuscript. AS performed the entire synchrotron experiment independently and revised the final manuscript.
Funding
The authors gratefully acknowledge funding from the Strategic Research Area StandUp for Energy, Swedish Energy Agency (grant no. 48678 1) and Batteries Sweden (BASE).
Acknowledgments
We acknowledge DESY (Hamburg, Germany), a member of the Helmholtz Association HGF, for the provision of experimental facilities. Parts of this research were carried out at Petra III. Beamtime was allocated on P02.1 for proposal I-20191244. We would also like to acknowledge ANSTO (Sydney, Australia) for allocation of beamtime related to proposal 13421 and Maxim Avdeev for carrying out neutron diffraction measurements. Haldor Topsoe is acknowledged for providing LiNi0.5Mn1.5O4 for this study. Ida Nielsen is acknowledged for carrying out SEM imaging.
Conflict of interest
The authors declare that the research was conducted in the absence of any commercial or financial relationships that could be construed as a potential conflict of interest.
Publisher’s note
All claims expressed in this article are solely those of the authors and do not necessarily represent those of their affiliated organizations, or those of the publisher, the editors and the reviewers. Any product that may be evaluated in this article, or claim that may be made by its manufacturer, is not guaranteed or endorsed by the publisher.
Supplementary material
The Supplementary Material for this article can be found online at: https://www.frontiersin.org/articles/10.3389/fenrg.2022.1056260/full#supplementary-material
References
Arai, H., Sato, K., Orikasa, Y., Murayama, H., Takahashi, I., Koyama, Y., et al. (2013). Phase transition kinetics of LiNi0.5Mn1.5O4 electrodes studied by in situ X-ray absorption near-edge structure and X-ray diffraction analysis. J. Mat. Chem. A Mat. 1 (35), 10442–10449. doi:10.1039/C3TA11637A
Avdeev, M., and Hester, J. R. (2018). Echidna: A decade of high-resolution neutron powder diffraction at OPAL. J. Appl. Crystallogr. 51(6), 1597–1604. doi:10.1107/S1600576718014048
Cheary, R. W., Coelho, A. A., and Cline, J. P. (2004). Fundamental parameters line profile fitting in laboratory diffractometers. J. Res. Natl. Inst. Stand. Technol. 109 (1), 1–25. doi:10.6028/jres.109.002
Chen, G., Song, X., and Richardson, T. J. (2007). Metastable solid-solution phases in the LiFePO4/FePO4 system. J. Electrochem. Soc. 154 (7), A627. doi:10.1149/1.2732189
Coelho, A. (2018). TOPAS and TOPAS-academic: An optimization program integrating computer algebra and crystallographic objects written in C++. J. Appl. Crystallogr. 51 (1), 210–218. doi:10.1107/S1600576718000183
Delacourt, C., Poizot, P., Tarascon, J.-M., and Masquelier, C. (2005). The existence of a temperature-driven solid solution in LixFePO4 for 0 ≤ x ≤ 1. Nat. Mat. 4, 254–260. doi:10.1038/nmat1335
Dippel, A.-C., Liermann, H.-P., Delitz, J. T., Walter, P., Schulte-Schrepping, H., Seeck, O. H., et al. (2015). Beamline P02.1 at PETRA III for high-resolution and high-energy powder diffraction. J. Synchrotron Radiat. 22(3), 675–687. doi:10.1107/S1600577515002222
Gustafsson, O., Schökel, A., and Brant, W. R. (2021). Design and operation of an operando synchrotron diffraction cell enabling fast cycling of battery materials. Batter. Supercaps 4, 1599–1604. doi:10.1002/batt.202100126
Kim, J.-H., Huq, A., Chi, M., Pieczonka, N. P. W., Lee, E., Bridges, C. A., et al. (2014). Integrated nano-domains of disordered and ordered spinel phases in LiNi0.5Mn1.5O4 for Li-ion batteries. Chem. Mat. 26 (15), 4377–4386. doi:10.1021/cm501203r
Kim, J. H., Myung, S. T., Yoon, C. S., Kang, S. G., and Sun, Y. K. (2004). Comparative study of LiNi0.5Mn1.5O4-δ and LiNi0.5Mn1.5O4 cathodes having two crystallographic structures: Fd3̄m and P4332. Chem. Mat. 16 (5), 906–914. doi:10.1021/cm035050s
Komatsu, H., Arai, H., Koyama, Y., Sato, K., Kato, T., Yoshida, R., et al. (2015). Solid solution domains at phase transition front of LixNi0.5Mn1.5O4. Adv. Energy Mat. 5 (17), 1500638. doi:10.1002/aenm.201500638
Lee, E., and Persson, K. A. (2013). Solid-solution Li intercalation as a function of cation order/disorder in the high-voltage LixNi0.5Mn1.5O4 spinel. Chem. Mat. 25 (14), 2885–2889. doi:10.1021/cm4014738
Liu, H., Strobridge, F. C., Borkiewicz, O. J., Wiaderek, K. M., Chapman, K. W., Chupas, P. J., et al. (2014). Batteries. Capturing metastable structures during high-rate cycling of LiFePO₄ nanoparticle electrodes. Science 344 (6191), 1252817. doi:10.1126/science.1252817
Ma, X., Kang, B., and Ceder, G. (2010). High rate micron-sized ordered LiNi0.5Mn1.5O4. J. Electrochem. Soc. 157 (8), A925–A931. doi:10.1149/1.3439678
Malik, R., Abdellahi, A., and Ceder, G. (2013). A critical review of the Li insertion mechanisms in LiFePO4 electrodes. J. Electrochem. Soc. 160 (5), A3179–A3197. doi:10.1149/2.029305jes
Ravnsbæk, D. B., Xiang, K., Xing, W., Borkiewicz, O. J., Wiaderek, K. M., Gionet, P., et al. (2014). Extended solid solutions and coherent transformations in nanoscale olivine cathodes. Nano Lett. 14 (3), 1484–1491. doi:10.1021/nl404679t
Saravanan, K., Jarry, A., Kostecki, R., and Chen, G. (2015). A study of room-temperature LixMn1.5Ni0.5O4 solid solutions. Sci. Rep. 5, 8027. doi:10.1038/srep08027
Strobridge, F. C., Liu, H., Leskes, M., Borkiewicz, O. J., Wiaderek, K. M., Chupas, P. J., et al. (2016). Unraveling the complex delithiation mechanisms of olivine-type cathode materials, LiFexCo1−xPO4. Chem. Mat. 28 (11), 3676–3690. doi:10.1021/acs.chemmater.6b00319
Strobridge, F. C., Orvananos, B., Croft, M., Yu, H.-C., Robert, R., Liu, H., et al. (2015). Mapping the inhomogeneous electrochemical reaction through porous LiFePO4-electrodes in a standard coin cell battery. Chem. Mat. 27 (7), 2374–2386. doi:10.1021/cm504317a
Takahashi, I., Arai, H., Murayama, H., Sato, K., Komatsu, H., Tanida, H., et al. (2016). Phase transition kinetics of LiNi0.5Mn1.5O4 analyzed by temperature-controlled operando X-ray absorption spectroscopy. Phys. Chem. Chem. Phys. 18 (3), 1897–1904. doi:10.1039/C5CP05535K
Takahashi, I., Murayama, H., Sato, K., Naka, T., Kitada, K., Fukuda, K., et al. (2014). Kinetically asymmetric charge and discharge behavior of LiNi0.5Mn1.5O4 at low temperature observed by in situ X-ray diffraction. J. Mat. Chem. A 2 (37), 15414–15419. doi:10.1039/C4TA01130A
Keywords: Operando, X-ray diffraction, spinel, high-rate, phase transition
Citation: Gustafsson O, Schökel A and Brant WR (2022) Mind the miscibility gap: Cation mixing and current density driven non-equilibrium phase transformations in spinel cathode materials. Front. Energy Res. 10:1056260. doi: 10.3389/fenrg.2022.1056260
Received: 28 September 2022; Accepted: 31 October 2022;
Published: 14 November 2022.
Edited by:
Neeraj Sharma, University of New South Wales, AustraliaReviewed by:
Jordi Jacas Biendicho, Energy Research Institute of Catalonia, SpainTan Shi, Apple, United States
Copyright © 2022 Gustafsson, Schökel and Brant. This is an open-access article distributed under the terms of the Creative Commons Attribution License (CC BY). The use, distribution or reproduction in other forums is permitted, provided the original author(s) and the copyright owner(s) are credited and that the original publication in this journal is cited, in accordance with accepted academic practice. No use, distribution or reproduction is permitted which does not comply with these terms.
*Correspondence: William R. Brant, d2lsbGlhbS5icmFudEBrZW1pLnV1LnNl