 Tonghe Wang
 Hong Liang3
 Junwei Cao
 Yuming Zhao
- 1Guangzhou Institute of Energy Conversion, Chinese Academy of Sciences, Guangzhou, China
- 2Jiangsu Collaborative Innovation Center of Photovoltaic Science and Engineering, Changzhou University, Changzhou, China
- 3Meihua Holdings Group Co., Ltd., Langfang, China
- 4Beijing National Research Center for Information Science and Technology, Tsinghua University, Beijing, China
- 5School of Computer Science and Software, Zhaoqing University, Zhaoqing, China
The increasing scale of the injection of renewable energy has brought about great uncertainty to the operation of power grid. In this situation, probabilistic power flow (PPF) calculation has been introduced to mitigate the low accuracy of traditional deterministic power flow calculation in describing the operation status and power flow distribution of power systems. Polynomial chaotic expansion (PCE) method has become popular in PPF analysis due to its high efficiency and accuracy, and sparse PCE has increased its capability of tackling the issue of dimension disaster. In this paper, we propose a principal component analysis-based compressive sensing (PCA-CS) algorithm solve the PPF problem. The l1-optimization of CS is used to tackle the dimension disaster of sparse PCE, and PCA is included to further increase the sparsity of expansion coefficient matrix. Theoretical and numerical simulation results show that the proposed method can effectively improve the efficiency of PPF calculation in the case of random inputs with higher dimensions.
1 Introduction
In face of the global energy crisis and environmental pollution issues, countries are vigorously promoting the development and utilization of clean and renewable energy. However, the power of renewable energy generation devices, such as photovoltaics (PV) and wind turbines (WT), is usually affected by many uncertain factors, showing strong randomness and intermittence (Hua et al., 2021). With the increasing scale of PVs and WTs connected to the power grid, the uncertainty encountered by power systems will also increase Hua et al. (2022b). As a result, the deterministic power flow analysis methods used to determine the operation status of interconnected power networks will no longer be applicable, and probabilistic power flow (PPF) emerge as the times require (Dalton et al., 2021). By effectively considering various uncertain factors of the energy system, PPF calculation is of great significance to help with system fault diagnosis, maintain system stability, and ensure system safety.
The essence of PPF is to obtain the statistical characteristics satisfied by the state variables of a power system by solving stochastic equations with random variables input. At present, mature methods of solving PPF equations mainly include simulation method, analytical method, approximation method, and polynomial chaotic expansion (PCE) method. Seeing the fact that analytical method and approximation method have difficulty in ensuring the calculation accuracy when the fluctuation of random inputs is large (Liang et al., 2021), we only provide details of simulation method and PCE method here:
• Simulation method stands for Monte Carlo (MC) method, as well as its improved versions (Constante-Flores and Illindala, 2019). It works as follows. First, a fairly large sample of input variables is obtained. Then, the corresponding solution is calculated based on the sample. Finally, subsequent statistical analysis on the solution is performed. Although this method has simple principle and convenient operation, it has low computational efficiency due to large amount of sampling, slow convergence speed and low computational efficiency (Liang et al., 2022).
• Recently, PCE method has been extensively adopted to solve PPF due to its great importance in uncertain quantization theory (Shen et al., 2020). Its first step is to expand random variables under a set of standard orthogonal basis made up by random polynomial functions. It then obtain the expansion coefficients and random variables by solving equations. The efficiency and accuracy of PCE method are relatively higher compared to other methods, but it needs to solve large-scale equations. Therefore, it is affected by the dimension disaster and is not satisfactory when solving problems with higher dimensions.
Sparse PCE is a common method to overcome the dimension disaster of traditional PCE method by reducing the number of bases in the polynomial expansion. In the calculation of probabilistic load flow, (Ma et al., 2021), proposes a sparse PCE method that reduces the number of basis functions of polynomial expansion by only preserving significant polynomial bases. To reduce the computational complexity of wideband configuration for periodic-grating wideband filters applied in optical devices under uncertain conditions, Papadopoulos et al. (2019) develops a sparse PCE method based on orthogonal matching pursuit. The principle of the proposed method is derived from compressive sensing (CS), which is very popular in the field of signal and image processing (Blanco-Solano et al., 2021). When the PCE coefficients are sparse, combined with the principle of compressive sensing, the expression of random state variables by constructing the information matrix can be accurately reconstructed with the number of samples far lower than that of MC method. A similar idea is adopted in (Sun et al., 2019) when analyzing system sensitivity by solving PPF equations. Although PCE method is formally applied, PCE coefficients are solved by sampling to avoid solving large complicated equations, thus mitigating the issue of dimension disaster. At the same time, this method significantly reduces the sample size and enhances the operation efficiency compared with the traditional MC method.
Principal component analysis (PCA) method is widely used in the field of data dimensionality reduction by extracting the main features of data. By retaining only the principal components that contain most of the variance of the original data, PCA preserves the important information in the original data and reduces the components of redundancy or noise (Jaramillo et al., 2020). There have been some existing works that use PCA in PPF analysis. To deal with the limitation of PPF calculation using traditional point estimation method, Li et al. (2020) uses PCA to reduce the correlation of original input random variables and improve the efficiency of the point estimate method. Considering the uncertainty in users’ consumption behavior, the PPF analysis in (Memon et al., 2020) combines PCA method and PCE method to compress the number of output variables in the surrogate models of the least-squares support vector machine. In addition, the PPF calculation in (Le et al., 2021) also uses PCA to reduce the dimensionality of the dataset before it is partitioned into clusters by particle swarm optimization.
This paper extends the work of our previous conference paper (Liang et al., 2021). In a power grid with loads, PVs, and WTs that causes power flow fluctuation, this paper proposes a PPF calculation algorithm called Principal Component Analysis-based Compressive Sensing (PCA-CS). First, PCA-CS integrates the PCA theory in the decomposition of the covariance matrix of random state variables, and obtains a set of standard orthogonal bases composed of eigenvectors. Then, it transforms the PCE coefficients of random state variables to obtain a sparser expansion coefficient matrix. Moreover, we test our PCA-CS method on IEEE 118-bus system to show that PCA-CS has significantly improved the solution accuracy and computational efficiency compared with the original CS method and the traditional MC method. Compared with existing works, this paper adopt the idea of CS that reduces the number of expansion basis functions via l1-optimization to overcome the dimensionality issue of PCE method. In addition, this paper theoretically proves that the expansion coefficient matrix is sparser after performing PCA-CS. According to the error theory of compressive sensing (Candes and Wakin, 2008), the sparser the expansion coefficient matrix is, the fewer samples are required to restore to the same accuracy. Therefore, our PCA-CS method can largely enhance the efficiency of PPF calculation while preserving the accuracy.
The remainder of this paper is arranged as follows: Section 2 explains in detail the PPF model of the power grid system we look into; Section 3 first introduces the traditional CS algorithm and then proposes the improved version, PCA-CS, with a detailed algorithm workflow; Section 4 provides numerical results and correlation analysis by simulation; Finally, Section 5 summarizes this paper and describes our future work plans.
2 Model of probabilistic power flow
In this paper, we consider a power grid systems containing load nodes, PV nodes, and WT nodes, which are the main origins of the fluctuation in the power flow. This section describes the probabilistic models of loads, PVs, WTs, and the corresponding PPF equations.
2.1 Load power fluctuation model
Due to many unpredictable factors such as geographical environment, time, and user behavior, the power fluctuation of load nodes could bring randomness to the power grid. This randomness is usually described by normal distribution, and its probability density function is as follows (Liu et al., 2017):
where:
• PL is the load active power,
•
•
• QL is the load reactive power,
•
•
2.2 Photovoltaic power fluctuation model
PV power mainly depends on the intensity of solar irradiation, and its distribution roughly follows the beta distribution. Therefore, we use the beta distribution to describe the fluctuation of PV power, and the corresponding probability density function is (Rawat and Vadhera, 2018):
where:
• rPV is the ratio of PPV, the PV active output, to
• Γ(⋅) is the gamma function,
• α and β are parameters of the beta distribution.
Generally speaking, PVs are connected to the power grid by means of constant power factor control. In other words, if we use φPV to represent the PV phase angle, then the power factor of PV cos φPV can be regarded as a constant. Then QPV, the PV reactive power, is therefore calculated by:
2.3 Wind turbine power fluctuation model
Similar to PV power, the randomness of WT power is mainly affected by wind speed, which is usually described by 2-parameter Weibull distribution. The corresponding probability density function is as follows (Gugliani et al., 2021):
where:
• v is the wind speed,
• k is the shape parameter of Weibull distribution,
• c is the scale parameter of Weibull distribution.
According to the technical principle of WT power generation, when the wind speed is less than a certain value or greater than a certain threshold, the WT power generation is zero. Therefore, the WT can work normally only within a reasonable wind speed range. Specifically, the active power and wind speed of wind power generation meet the following piecewise function relationship:
where
• PWT(v) is the active power when the wind speed is v,
• Pr is the rated power of the WT,
• vci is the cut-in wind speed,
• vr is the rated wind speed,
• vco is the cut-out wind speed.
By substituting (5) into (4), the probability distribution of PWT can be obtained by:
where k1 and k2 can be calculated as follows:
Similar to PV power generation, the reactive power of WT power generation QWT can be obtained by:
where φWT represents the phase angle of WT power generation. Since WTs are also connected to the power grid by constant power factor control, the power factor of WT power generation cos φWT is a constant as well.
2.4 Probabilistic power flow model
Maintaining power balance at all times is fundamental for the normal operation of the power grid, which requires the power of each node i (= 1, 2, … , m, where m represents the total number of grid nodes) to meet the following power flow equation (Li et al., 2020):
where:
• i can be a load, PV, or WT node,
• Pi is the active power of node i,
• Qi is the reactive power of node i,
• Vi is the voltage amplitude of node i
• δij represents the phase difference between node i and adjacent node j,
• Gij and Bij are parameters related to the transmission line that connects node i and node j.
Since the injected power of system nodes includes the randomness caused by loads, PV power generation, and WT power generation, Pi and Qi are also regarded random variables. Therefore, (10) is the required PPF equation. By specifying the active and the reactive power of the node, it is possible to obtain the statistics of the node voltage amplitude and the phase angle, and then the corresponding line power flow is accordingly obtained.
For the sake of convenience, (10) will be condensed as follows:
where
• X consists of Pi and Qi for all i,
• Y contains Vi and δij for all i and j,
• F(⋅) is the function that maps X to Y determined by (Eq. 10).
3 Principal component analysis-based compressive sensing
The adoption of compressive sensing in PPF analysis aims to expand the random state variables by PCE, and then compress and restore them by using the sparsity of expansion coefficients. The PCA-CS algorithm proposed in this paper is to obtain a set of eigen-basis functions by decomposing the covariance of random variables before compression reduction, so as to make the random variables sparser under the expression of this set of basis functions, and then compress and restore under this set of basis functions. According to the error theory of compressive sensing, improving the sparsity can reduce the number of sample solutions required for restoration, and then improve the solution efficiency.
To sum up, this section will describe the proposed algorithm in detail from the following three parts:
1) Traditional PCE method of random variables in probability space;
2) The covariance matrix of random variables is decomposed to obtain the eigen-basis functions;
3) The sparse expression of random variables is obtained by compression reduction under the expansion of eigen-basis functions.
3.1 Traditional PCE method
Assume that the input variable Y = [y1, y2, … , yd], the power distribution of all nodes, is a d-dimensional variable with all entries following independent normal distribution. Otherwise, we can mitigate the correlation by Nataf transform (see (Lin et al., 2020) for more details). Then, we expand (11) with Hermite orthogonal polynomials:
where:
• multilevel index
• p is the expansion order of polynomials,
• ψI is a multivariable orthogonal Hermite basis function calculated by:
• hi(⋅) is a univariate Hermite functions.
Orthogonal polynomial ψI satisfies:
where:
• χIJ is the Kronecker function (i.e., 1 at that time I = J and 0 in other cases),
• ρ(Y) is the joint probability density of Y,
• γI is a constant.
The goal is to obtain the expansion coefficient sI in (Eq. 12), and the number of terms in sI is:
According to the Askey scheme, Hermite orthogonal basis functions are efficient in approximating independent normal random variables (Son and Du, 2021). Next, the moment and probability distributions of random variables are calculated by obtaining the expansion coefficients.
3.2 PCA for extracting eigen-basis functions
At present, the existing methods for solving the coefficients of PCE, such as Garrerkin projection method (Wu et al., 2017) and collocation point method (Tang et al., 2016), will face problems such as complicated operation and dimension disaster. Because the expansion of random variables is usually sparse, compressive sensing algorithm can be used to restore the expansion coefficients. By introducing PCA, PCA-CS further improves the application of traditional compressive sensing algorithm in PPF solution. It overcomes the dimensional problem of the PCE method while inheriting the feature that the MC method is easy to operate.
In more detail, PCA method is used to map random variables to their eigen-space, so that the expansion of random variables is sparser in the expression of eigen-space.
First, the eigen-basis function
where:
• C(X, XT) represents the covariance matrix of random variable X and XT (the transpose of X) that can be calculated as follows:
•
During calculation, the eigenvalues are arranged in descending order by default. Because the covariance matrix is symmetric and positive definite, the eigenvalues
After obtaining the eigen-basis function
3.3 Improved compressive sensing algorithm
After the expansion of X is obtained, the expansion coefficient
3.3.1 Solution flow of traditional compressive sensing algorithm
Since the coefficient matrix S in expansion (12) is sparse, according to the sparse reduction theory (Marques et al., 2019), the expansion coefficient S can be restored by sampling. The specific process is as follows: select H random sample points [Y(1), Y(2), …, Y(H)] of Y, and then bring them into PPF Eq. 11 respectively to obtain corresponding sample solutions
where Ψ is called the measurement matrix, which is obtained by bringing multiple Hermite orthogonal polynomials from random sample points [Y(1), Y(2), …, Y(H)], namely:
and
The dimension of Ψ is H × P. When P > H, the system of (Eq. 19) is an underdetermined system of equations, and the coefficients
where ‖ ⋅‖0 refers to the l0-norm, which is calculated as the element count in
Seeing the fact that the l0-norm is discontinuous, optimization problem (21) is NP hard to solve, so it needs to be relaxed. Among them, l1-norm represents the sum of the absolute values of all elements in the matrix and is the most commonly used relaxation method. Thus, problem (21) becomes:
which is also called an l1-optimization problem.
It has been shown that the solution of problem (Eq. 21) can be accurately approximated by solving problem (Eq. 22), and the solution of l1-optimization problem is more convenient (Wang et al., 2020). It can be solved by the orthogonal matching pursuit (OMP) algorithm (Papadopoulos et al., 2019).
3.3.2 PCA-CS
The proposed PCA-CS algorithm is based on the traditional CS algorithm. Through the PCA theory, the random variables are transformed to make their expression coefficients sparser, and then compressed and restored. According to (18), sample solutions
where:
• Ψ is the measurement matrix in the same form as (20),
• Φ is the eigen-matrix composed of eigen-basis function,
• S is the expansion coefficient to be solved.
Furthermore, the coefficient S can be reduced through the following l1-optimization problem:
The sparsity of S is given by the following theorem:
Theorem 1. The expansion coefficient S of X and eigenvalues
where μj represents the jth eigenvalue of the eigen-decomposition problem.
Proof of Theorem 1.Hermite polynomial ψi satisfies
so
Combining (27) and (17), we can get:
By introducing (28) into eigen-decomposition Eq. 16:
Then the theorem is proved.
Theorem 1 shows that the value of each column of the expanded coefficient matrix of random variables can be roughly controlled by the corresponding eigenvalue. In addition, in practical application, the eigenvalues in descending order decline very fast. Therefore, when the eigenvalues tend to 0, the component element values of the corresponding columns of the coefficient matrix tend to 0. In other words, the faster the eigenvalue decreases, the sparser the coefficient matrix is represented by this set of eigen-basis functions. This will also be proved in the following numerical examples.
To sum up, the whole PPF solution process is as follows:
1. Perform the PCE on input variable X according to (12);
2. Randomly select H sample points [Y(1), …, Y(H)] based on normal distribution and obtain corresponding solutions
3. Solve the eigen-decomposition problem (Eq. 16) and obtain eigen-basis functions
4. Under the expression of eigen-basis functions, construct the compression reduction problem (Eq. 22);
5. Obtain the coefficient matrix S by OMP algorithm;
6. Bring the coefficient S back to the expansion (18) to obtain the statistics of Y, the state variable, and then analyze it.
4 Numerical analysis
In this section, the PCA-CS algorithm for PPF proposed in Section 3 is verified on IEEE 118 node. We use MATLAB r2020 as the develop tool of our program, and we perform PPF calculation on a laptop with Intel i7-8586u CPU with the help of Matpower package.
4.1 Simulation settings
In this example, on the basic grid of IEEE 118 node, WTs are connected at nodes 6, 15, 42, 60, 92, 115 respectively, PVs are connected at nodes 2, 7, 27, 41, 58, 98, and nodes 3, 11, 23, 50, 57, 75, 84, 88, 93, 102 are selected as load nodes. The parameter settings of loads, WTs, and PVs are listed in Table 1, Table 2, and Table 3 respectively.
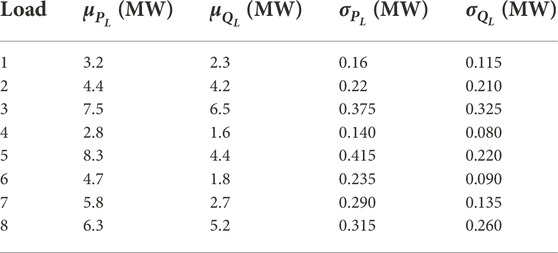
TABLE 1. Parameters of random loads.
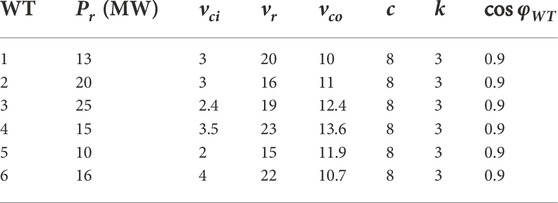
TABLE 2. Parameters of WTs.
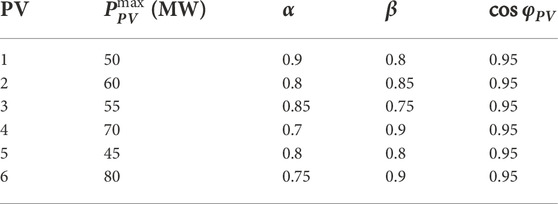
TABLE 3. Parameters of PVs.
4.2 Simulation results
In order to verify the effectiveness of PCA-CS algorithm in solving PPF equation, this section makes numerical analysis of PCA-CS from the aspects of algorithm accuracy and calculation efficiency, and compares it with MC method and traditional CS method. We use the results of traditional MC method with a sampling scale of 100,000 times as the error reference standard.
4.2.1 Algorithm accuracy
In order to evaluate the accuracy of PCA-CS, we need to select performance indicators to measure the accuracy first. Table 4 shows the relative error values of the mean (with subscription
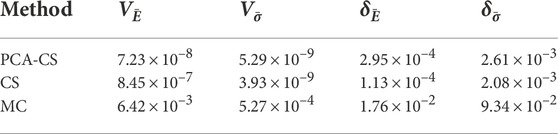
TABLE 4. Relative errors of three methods with 30 sample points.
Specifically, three representative random nodes 50, 58, and 60 are selected here to visualize the probability distribution of output state variables of random load, PV, and WT node respectively. Figure 1 shows the probability density functions of V and δ of nodes 50, 58, and 60 obtained by PCA-CS algorithm and CS algorithm, and compares them with the standard reference obtained by MC method with 100,000 sample solutions. It can be seen from the figure that the distribution functions calculated by PCA-CS and CS algorithm basically coincide with each other and are consistent with the standard reference solution, which further shows the accuracy of PCA-CS.
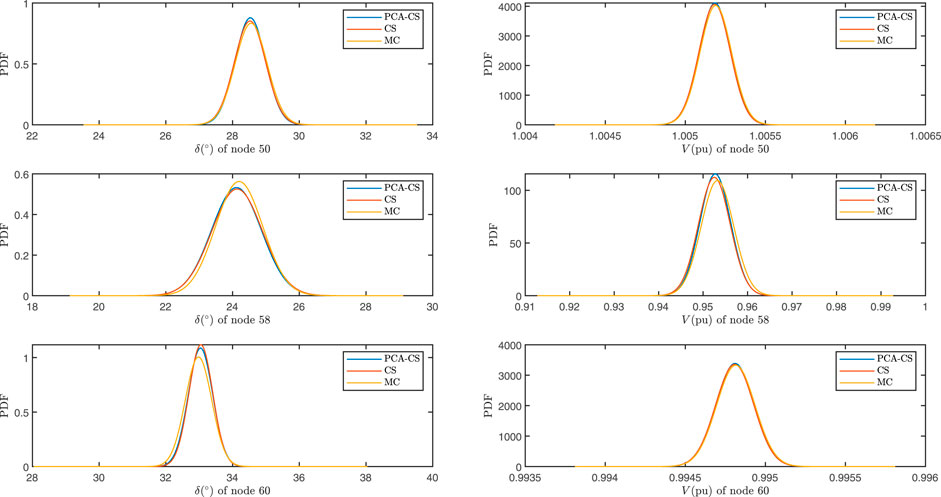
FIGURE 1. Probability density function (PDF) of node voltage amplitude V and phase angle δ.
From the numerical analysis of accuracy, we can see that although PCA-CS performs a basis function transformation through principal component extraction based on the traditional CS method, it does not affect the accuracy of the results. This is because PCA-CS algorithm only obtains a set of orthogonal eigen-basis functions through the eigen-decomposition of PCA, but does not abandon the basis functions corresponding to small eigenvalues when expanding random variables, thus ensuring the accuracy of transformation to the greatest extent. On the contrary, after the transformation, the sparsity of the expansion is improved. According to the error theory of compressive sensing (Candes and Wakin, 2008), the sparsity is improved and the number of sample solutions required to achieve the same accuracy is reduced. Therefore, compared with the traditional CS method, PCA-CS can further improve the operation efficiency under the same accuracy.
4.2.2 Computational efficiency
After verifying the accuracy, we further explains the advantages of PCA-CS algorithm in computational efficiency through experimental data. First, we introduce the concept of sparse ratio λ that can be calculated as follows:
where:
• #{|S|≥ τ} is the element counts in matrix S whose elements are greater than or equal to the threshold τ,
• P represents the dimension equal to the random basis function.
In other words, sparse ratio λ indicates the proportion of the coefficients in S that are greater than or equal to a reference value τ. The highest order of the truncated basis here is p = 2, and the dimension of the random variable d = 40. The number of basis is therefore calculated by:
The dimension of the expansion coefficient S is 881 × 118-dimensional. The smaller the sparse ratio λ is, the sparser the sparse matrix is.
Figure 2 and Figure 3 respectively show the visual display of the sparsity of PCE coefficients of V and δ of 118 nodes calculated by PCA-CS and traditional CS algorithm and the value of total sparsity ratio.
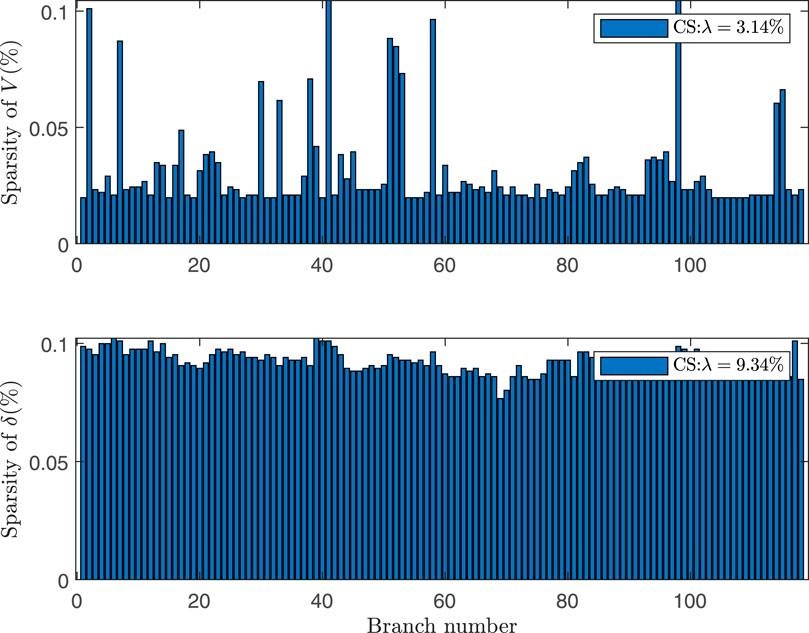
FIGURE 2. Sparsity of coefficient matrix of CS method.
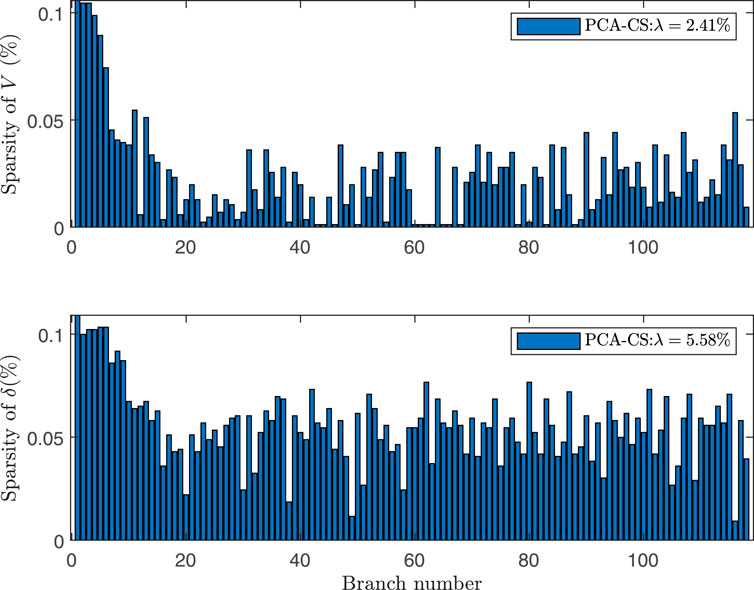
FIGURE 3. Sparsity of coefficient matrix of PCA-CS method.
From Figure 2 and Figure 3, we can see the sparsity of V and δ of each node under the Hermite orthogonal expansion. The average sparsity of the two methods is less than 1%, which shows the applicability of compressed sensing idea. By comparison, after the introduction of principal component analysis, the sparsity of the expansion coefficient of voltage amplitude V decreases from 3.14% to 2.41%, the sparsity increases by 23.2%, the sparsity of phase angle δ decreases from 9.34% to 5.58%, and the sparsity increases by 40.3%. It is proved that the sparsity of the results of PCA-CS algorithm is significantly improved compared with CS algorithm, and the results accord with the analysis of Theorem 1. Therefore, PCA-CS algorithm can achieve the same calculation accuracy as CS algorithm through a smaller number of sample solutions. The error convergence comparison and calculation time comparison data of the two methods are given in Figure 4 and Table 5 respectively.
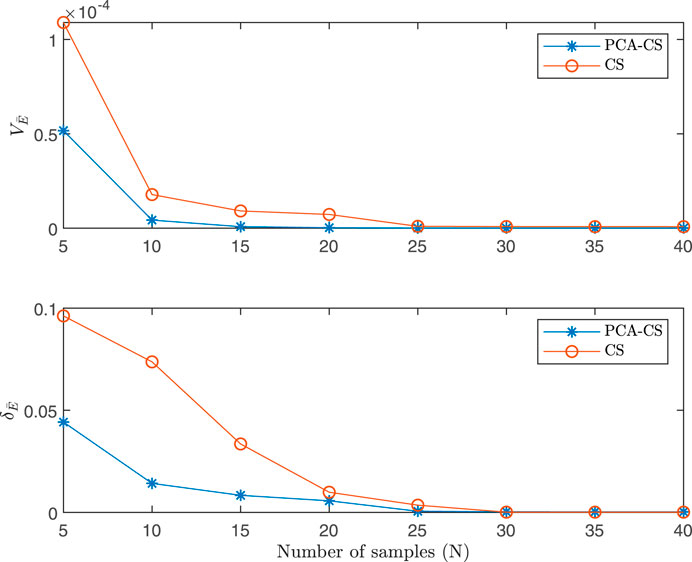
FIGURE 4. Error estimation of PCA-CS and CS.
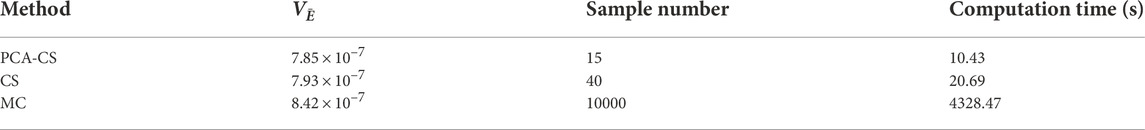
TABLE 5. Comparison of computational efficiency of PCA-CS, CS, and MC methods.
According to Figure 4, the errors of both PCA-CS and CS fall as the number of sample points increases at the beginning, and then the errors are basically unchanged after the sample scale reaches a certain level. However, at the same sample level, the error of PCA-CS algorithm is lower than that of CS algorithm. According to the data in Table 5, to reach the same accuracy level, the running time of PCA-CS is roughly 10 s less than CS, and the time consumption of the two methods is much less than that of MC. Like MC, the PCA-CS uses sample solution in PPF calculation to simplify the implementation process of the algorithm.
To sum up, PCA-CS can significantly enhance the solution efficiency with little compromise in accuracy.
5 Conclusion
In this paper, we study the PPF calculation problem with the consideration of the input uncertainty caused by the injection of PVs and WTs into the power grid system. We propose a PCA-CS algorithm for PPF calculation uses the principle of PCA to perform eigen-transformation on the result of PCE expansion. This method is similar to the traditional CS method and MC method. It inherits the advantage of simple principle, easy implementation, and more suitable for practical application. In our future research, we will consider continuing to improve the PCA-CS algorithm by using the principles of weighted l1-optimization in optimization theory to further enhancing the solution efficiency (Sun et al., 2016). Moreover, given the excellent performance of artificial intelligence (AI) in dealing with dimensional disasters, we can also consider solving PPF equations using AI-based methods (Hua et al., 2022a). Based on PPF analysis, we can further consider studying probabilistic stability control of microgrid systems (Hua et al., 2019).
Data availability statement
The raw data supporting the conclusion of this article will be made available by the authors, without undue reservation.
Author contributions
TW: Conceptualization, Investigation, Writing-Original Draft; HL: Methodology, Software, Formal Analysis, Data Curation, Visualization; JC: Supervision, Project administration, Funding acquisition; YZ: Resources, Validation, Writing-Review and Editing.
Funding
This work is supported by the China National Key R&D Program intergovernmental international scientific and technological innovation cooperation project (2019YFE0120200).
Conflict of interest
HL was employed by the company Meihua Holdings Group Co., Ltd.
The remaining authors declare that the research was conducted in the absence of any commercial or financial relationships that could be construed as a potential conflict of interest.
Publisher’s note
All claims expressed in this article are solely those of the authors and do not necessarily represent those of their affiliated organizations, or those of the publisher, the editors and the reviewers. Any product that may be evaluated in this article, or claim that may be made by its manufacturer, is not guaranteed or endorsed by the publisher.
References
Blanco-Solano, J., Petit, J. F., Ordóñez-Plata, G., Kagan, N., and Almeida, C. F. M. (2021). Voltage sag state estimator based on compressive sensing in distribution systems. Int. J. Electr. Power & Energy Syst. 130, 106892. doi:10.1016/j.ijepes.2021.106892
Candes, E. J., and Wakin, M. B. (2008). An introduction to compressive sampling. IEEE Signal Process. Mag. 25, 21–30. doi:10.1109/msp.2007.914731
Constante-Flores, G. E., and Illindala, M. S. (2019). Data-driven probabilistic power flow analysis for a distribution system with renewable energy sources using Monte Carlo simulation. IEEE Trans. Ind. Appl. 55, 174–181. doi:10.1109/tia.2018.2867332
Dalton, A., Bekker, B., and Koivisto, M. J. (2021). Classified atmospheric states as operating scenarios in probabilistic power flow analysis for networks with high levels of wind power. Energy Rep. 7, 3775–3784. doi:10.1016/j.egyr.2021.06.060
Gugliani, G. K., Sarkar, A., Ley, C., and Matsagar, V. (2021). Identification of optimum wind turbine parameters for varying wind climates using a novel month-based turbine performance index. Renew. Energy 171, 902–914. doi:10.1016/j.renene.2021.02.141
Hua, H., Li, Y., Wang, T., Dong, N., Li, W., and Cao, J. (2022a). Edge computing with artificial intelligence: A machine learning perspective. ACM Comput. Surv. (Just Accepted). doi:10.1145/3555802
Hua, H., Qin, Y., Hao, C., and Cao, J. (2019). Stochastic optimal control for energy internet: A bottom-up energy management approach. IEEE Trans. Ind. Inf. 15, 1788–1797. doi:10.1109/tii.2018.2867373
Hua, H., Qin, Z., Dong, N., Qin, Y., Ye, M., Wang, Z., et al. (2022b). Data-driven dynamical control for bottom-up energy internet system. IEEE Trans. Sustain. Energy 13, 315–327. doi:10.1109/tste.2021.3110294
Hua, H., Wei, Z., Qin, Y., Wang, T., Li, L., and Cao, J. (2021). Review of distributed control and optimization in energy internet: From traditional methods to artificial intelligence-based methods. IET Cyber-phys. Syst. 6, 63–79. doi:10.1049/cps2.12007
Jaramillo, A. F. M., Laverty, D. M., del Rincon, J. M., Hastings, J., and Morrow, D. J. (2020). “Supervised non-intrusive load monitoring algorithm for electric vehicle identification,” in 2020 IEEE international instrumentation and measurement Technology conference (I2MTC) (IEEE). doi:10.1109/i2mtc43012.2020.9128529
Le, D. D., Ngo, D. V., Nguyen, N. T. A., and Huynh, K. V. (2021). Probabilistic assessment of power systems with renewable energy sources based on an improved analytical approach. Int. J. Renew. Energy Dev. 10, 811–818. doi:10.14710/ijred.2021.38226
Li, H., Zhang, Z., and Yin, X. (2020). A novel probabilistic power flow algorithm based on principal component analysis and high-dimensional model representation techniques. Energies 13, 3520. doi:10.3390/en13143520
Liang, H., Hua, H., Qin, Y., Ye, M., Zhang, S., and Cao, J. (2022). Stochastic optimal energy storage management for energy routers via compressive sensing. IEEE Trans. Ind. Inf. 18, 2192–2202. (in press). doi:10.1109/tii.2021.3095141
Liang, H., Wang, T., Guo, J., and Cao, J. (2021). “Probabilistic power flow calculation of microgrid based on ℓ1-minimization,” in 2021 IEEE international Conference on energy internet (ICEI) (IEEE). Available at: http://www.mit.edu/∼caoj/pub/doc/jcao_c_powerflow.pdf. doi:10.1109/icei52466.2021.00013
Lin, X., Jiang, Y., Peng, S., Chen, H., Tang, J., and Li, W. (2020). An efficient nataf transformation based probabilistic power flow for high-dimensional correlated uncertainty sources in operation. Int. J. Electr. Power & Energy Syst. 116, 105543. doi:10.1016/j.ijepes.2019.105543
Liu, H., Tang, C., Han, J., Li, T., Li, J., and Zhang, K. (2017). Probabilistic load flow analysis of active distribution network adopting improved sequence operation methodology. IET Gener. Transm. &. Distrib. 11, 2147–2153. doi:10.1049/iet-gtd.2016.0406
Liu, Z., Zhang, X., Su, M., Sun, Y., Han, H., and Wang, P. (2020). Convergence analysis of Newton-raphson method in feasible power-flow for DC network. IEEE Trans. Power Syst. 35, 4100–4103. doi:10.1109/tpwrs.2020.2986706
Ma, H., Wang, H., Xu, X., Yan, Z., and Mao, G. (2021). Efficient probabilistic load flow calculation considering vine copulabased dependence structure of renewable energy generation. J. Donghua Univ. Engl. Ed. 38, 6.
Marques, E. C., Maciel, N., Naviner, L., Cai, H., and Yang, J. (2019). A review of sparse recovery algorithms. IEEE Access 7, 1300–1322. doi:10.1109/access.2018.2886471
Memon, Z. A., Trinchero, R., Manfredi, P., Canavero, F., and Stievano, I. S. (2020). Compressed machine learning models for the uncertainty quantification of power distribution networks. Energies 13, 4881. doi:10.3390/en13184881
Papadopoulos, A. D., Zygiridis, T. T., Glytsis, E. N., Kantartzis, N. V., and Antonopoulos, C. S. (2019). Uncertainty study of periodic-grating wideband filters with sparse polynomial-chaos expansions. IEEE Photonics Technol. Lett. 31, 1499–1502. doi:10.1109/lpt.2019.2935322
Rawat, M. S., and Vadhera, S. (2018). Impact of photovoltaic penetration on static voltage stability of distribution networks: A probabilistic approach. Asian J. Water, Environ. Pollut. 15, 51–62. doi:10.3233/AJW-180043
Shen, D., Wu, H., Liu, L., and Gan, D. (2020). “Solving probabilistic power flow with wind generation by polynomial chaos expansion method from the perspective of parametric problems,” in 2020 IEEE power & energy society general meeting (PESGM).
Son, J., and Du, Y. (2021). An efficient polynomial chaos expansion method for uncertainty quantification in dynamic systems. Appl. Mech. 2, 460–481. doi:10.3390/applmech2030026
Sun, B., Zhao, W., and Zhu, X. (2016). Compressed sensing for implantable neural recordings using co-sparse analysis model and weighted ℓ1-optimization.
Sun, X., Wang, B., Chen, J., Yinhong, L. I., Zhao, H., Duan, X., et al. (2019). Sparse polynomial chaos expansion based uncertainty quantification for available transfer capability. Proc. CSEE 39, 2904–2914. (in Chinese). doi:10.13334/j.0258-8013.pcsee.180743
Tang, J., Ni, F., Ponci, F., and Monti, A. (2016). Dimension-adaptive sparse grid interpolation for uncertainty quantification in modern power systems: Probabilistic power flow. IEEE Trans. Power Syst. 31, 907–919. doi:10.1109/tpwrs.2015.2404841
Wang, S., Du, H., Zhang, G., Lu, J., and Yang, J. (2020). Robust canonical correlation analysis based on l1-norm minimization for feature learning and image recognition. J. Electron. Imaging 29, 1. doi:10.1117/1.jei.29.2.023001
Keywords: probabilistic power flow, principal component analysis, compressive sensing, renewable energy, polynomial chaos expansion
Citation: Wang T, Liang H, Cao J and Zhao Y (2023) Probabilistic power flow calculation using principal component analysis-based compressive sensing. Front. Energy Res. 10:1056077. doi: 10.3389/fenrg.2022.1056077
Received: 28 September 2022; Accepted: 31 October 2022;
Published: 16 January 2023.
Edited by:
Haochen Hua, Hohai University, ChinaReviewed by:
Zeqing Xiao, Changsha Normal University, ChinaBoquan Zhang, Guangdong University of Technology, China
Copyright © 2023 Wang, Liang, Cao and Zhao. This is an open-access article distributed under the terms of the Creative Commons Attribution License (CC BY). The use, distribution or reproduction in other forums is permitted, provided the original author(s) and the copyright owner(s) are credited and that the original publication in this journal is cited, in accordance with accepted academic practice. No use, distribution or reproduction is permitted which does not comply with these terms.
*Correspondence: Yuming Zhao, eW16aGFvQHpxdS5lZHUuY24=