 Andreas Gantenbein
 Tilman J. Schildhauer
- Bioenergy and Catalysis Laboratory, Research Division Energy and Environment, Paul Scherrer Institute (PSI), Villigen, Switzerland
Direct methanation of biogas enables the storage of electrical energy in carbon-neutral (bio-)methane and subsequent injection into the national gas distribution grid. The intermittent availability of renewable electricity, as well as the varying nature of biogas production by e.g. anaerobic digestion, necessitate enhanced operational flexibility of such a Power-to-Gas process and intermediate buffer storage. This work provides experimental data of dynamic part load operation of a TRL 5 methanation plant with gas upgrading to grid-ready biomethane. Full recycling of unreacted H2 could be achieved by a commercial biogas upgrading membrane (Evonik SEPURAN® Green). Using real biogas, a sequence of load levels down to 45% of the full load capacity were tested. Stable operation of the plant could be demonstrated and grid injection limitations could be fulfilled after equilibration of the system. Additionally, an idealised PtG process chain was simulated with the focus on a sensitivity analysis of the H2 storage capacity on the methanation operation hours. It was shown that increasing the hydrogen storage capacity decreases the number of start-up and shut down procedures of the methanation plant. It could be shown that by using an equally sized electrolyser and methanation unit, allowing part load operation of the methanation only during the emptying of the H2 tank leads to longer activity phases of the methanation unit, while allowing part load operation of the methanation reactor during filling of the H2 storage tank had a negative effect.
1 Introduction
In the energy system of the future, fluctuating power generation techniques, such as wind and solar power will gain importance (International Energy Agency (IEA), 2021). Power-to-Gas (PtG) technologies can be a way to absorb and store electricity production from these sources (Estermann et al., 2016; Simonis and Newborough, 2017) that cannot be used at the time or place of its production. Simultaneously, PtG allows decreasing the carbon footprint of the natural gas grid by using renewable hydrogen and biogenic or not avoidable CO2 as feedstock. A cost efficient way to access biogenic CO2 is the direct methanation of biogas and subsequent grid injection (Collet et al., 2017; Witte et al., 2018).
While catalytic processes, such as methanation, require some flexibility to operate on fluctuating feed streams, synergistic combinations with adequate buffer solutions are needed to increase the resilience of such processes and to optimise the operation of the reactors.
A modelling study by Kreitz et al. (2020) shows nicely the behaviour of a cooled plate reactor for methanation in a fluctuating, un-buffered feed gas stream. The study assumes an alkaline electrolyser, which is directly operated on wind energy, following its production curve. Based on this fluctuating hydrogen input, the thermal conditions in the reactor are modelled. As no intermediate gas buffer storage is considered, the reactor temperature and gas quality are highly dependent on the flow rates and the CO2 content in the feed gas stream. The study showed that such highly fluctuating, un-buffered feed flows could cause high thermal stresses to the catalyst and the reactor, especially in such microstructured reactor types. When no intermediate gas storage solutions are considered, an adaptation of the PtG plant towards higher part load capability of the reactor or more advanced product gas upgrading is necessary.
When buffer tanks are introduced to the gas feed of a PtG system, the highest operational flexibility is required in the electrolysis, which represents the first process step. State-of-the-art technology enables a fast ramping of the nominal power in order to follow the supply curves of electricity (Buttler and Spliethoff, 2018). Gorre et al. (2020) state that proton exchange membrane electrolysers (PEM) are capable of ramping up from cold stand-by to nominal load within 10 s. Furthermore, the load range can be varied from 0% to 100% (Buttler and Spliethoff, 2018). For alkaline electrolysers (AEL), the minimum load is limited to around 20% (Buttler and Spliethoff, 2018) and load changes of 20%/min are possible (Gorre et al., 2020).
For the methanation case, Gorre et al. (2020) presented a Monte Carlo-based simulation study where hydrogen storage size and methanation capacity were economically optimised for a 10 MW alkaline electrolyser. The study considers three different power sources (wind, solar and grid balancing operation) and two different operation concepts to compensate for H2 overproduction by the size difference of the methanation and the electrolyser. The study shows that a gas production cost decrease of up to 17% is possible by optimising the methanation capacity. Nevertheless, it also indicates that no single optimum system design is possible, but rather a range of capacities where the production cost change is only limited. The fixed-bed methanation considered in this study operates down to an assumed part load level of 40% and varies linearly with the tank level (i.e., pressure in the tank). The methanation is only started at around 50% tank level in order to prevent frequent on-off cycles.
Gorre et al. (2020) found the largest required H2 tank sizes when solar energy is used, as regular day/night periods have to be compensated. Less storage capacity is required when a PtG plant is connected to a wind farm, as the fluctuations are distributed over the full day. The grid balancing scenario required the least capacity, as only short-term peaks and under-coverages had to be compensated.
Inkeri et al. (2021) present a similar study, which considers further parameters of thermal dynamics for the reactor, such as a load ramp, thermal ramp, a cooling rate and a maximum stand-by time. Their considerations are also based on a fixed-bed methanation reactor. The storage capacity for H2 was varied between 2 and 12 h. Similar to the study of Gorre et al. (2020), the methanation is operated in a load range between 20% and 100% depending on the H2 storage level. Apart from a scenario where H2 is produced by overproduction from wind and solar power, a further scenario is considered where grid electricity is used below a fixed price threshold.
Both studies show that specific optimisations of unit sizes (i.e. electrolysis, methanation and H2 storage size) have to be performed based on the purpose of the plant and the temporal availability of electricity.
In the previous work (Gantenbein et al., 2021), the necessity to increase the flexibility of power-to-gas process chains was discussed. Especially during times when electricity costs are high, operating a PtG facility might be uneconomic. Phases with high electricity cost are likely to increase in the future energy system, as renewable energies reach a high penetration in the market. This will lead to a high fluctuation on the production side of the electricity market, which subsequently requires additional flexibility at the demand side. A measure to monitor and react to such fluctuations is the European Power Exchange (EPEX) spot price, which reflects the settling price of short-term electricity auctions (European Energy Exchange (EEX), 2022).
A flexible PtG and biogas upgrading system was presented in previous work (Gantenbein et al., 2021), which allows for a fast switching between PtG operation and membrane-based biogas upgrading. Based on this bi-modal operation mode, the system was analysed for its economic feasibility in the previous work (Gantenbein et al., 2022). In this mode, the plant is either operated in full-load membrane-based upgrading or in full-load PtG operation depending on the availability of hydrogen, which itself is generated using renewable electricity. It could be shown that additional flexibility in the PtG plant allows for a more economic production of biomethane even at lower possible PtG operation hours per year by actively avoiding times of scarce and thus expensive electricity.
In this work, we investigate to what extent such a flexible system can be improved by operating the methanation in part load. This is done by 1) experimental investigation, performed at TRL 5, which has a high relevance for industry-like applications, and 2) by analysing operation heuristics based on the electricity cost distribution.
Here, we consider a part load case where hydrogen is fed to the methanation process according to the stoichiometric requirement, based on the availability of biogas or CO2. Such part load situations occur when the biogas production fluctuates or the carbon-containing gas can be stored for longer time periods. When the CO2 source is limited, full-load PtG operation is not possible and the H2 supply can be throttled. Therefore, part load in the reactor as well as in the hydrogen recycle membrane can be expected and is investigated in this work.
2 Materials and methods
In this work, experimental work during a field campaign was performed to prove part load of the methanation reactor alone and in combination with the membrane based upgrading system. Furthermore, an algorithm was developed, which allows the analysis of the operation of a power-to-methane plant.
2.1 Pilot plant experiments
The experiments in this work were performed in a container-based methanation set-up (COSYMA, 10–20 kW, TRL 5). As shown in a previous campaign, this plant can be used for direct methanation of biogas (Witte et al., 2019) and biogas upgrading (Calbry-Muzyka et al., 2019). In this experimental campaign, the COSYMA pilot plant was installed at a biogas plant (Swiss Farmer Power Inwil, SFPI) in Inwil (Switzerland). This biogas plant mainly uses manure and municipal biowastes as feedstock. The composition of the biogas feed-stream coming to the plant was not monitored continuously. Although it was prone to fluctuations, frequent measurements showed a composition of around 40% CO2 and 60% CH4. The relevant gas compositions were recorded by micro gas chromatography (μGC, Varian CP-4900) in a 3–4 min interval during the experiments.
The main components of the pilot plant were identical to the previous experimental campaigns, as shown in Figure 1. The gas mixtures used in the experiments were prepared using biogas from the digester plant, mixed with additional gas from cylinders (H2), dosed with thermal mass flow controllers (MFCs). The biogas from the digester plant was compressed to system pressure and fed through two sorbent beds to remove contaminants to prevent poisoning of the methanation catalyst and damage to the biogas upgrading membrane. After the main compressor, a cooled condensate trap was installed (4°C), which removed condensable contaminants. The gas flow rate to the sorbent beds was monitored with a Coriolis mass flow meter (Promass A, Endress + Hauser, Switzerland).
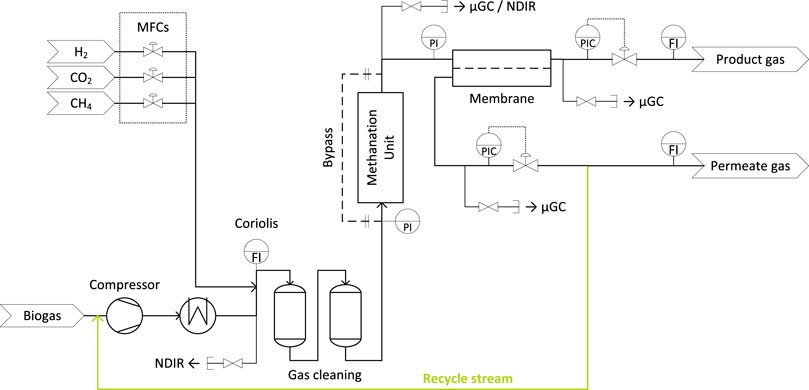
FIGURE 1. P&ID of the COSYMA plant in the configuration for symmetrical part load experiments. The optional connection for H2 recycling is drawn in green. For reasons of readability, the water bath for temperature control in the membrane module is no shown and the reactor unit is drawn in a simplified way.
The raw gas mixture was pre-heated to reaction temperature and mixed with steam (approx. 0.5 mole H2O per mole CO2) to prevent coke formation and reduce catalyst stress.
The methanation reactor was filled with 800 g of a commercial, Ni/Al2O3-based catalyst (Geldart B type particles). The reactor vessel had an inner diameter of 5.2 cm. In contrary to larger-scale BFB reactors (Schillinger, 2018), the only internals present in the reactor volume were lances for gas sampling and temperature probing. The vessel was cooled by a heated air stream, which was passed through a shell from the bottom to the top of the reactor. This way, a near-isothermal temperature profile could be achieved, as shown by Witte et al. (2019).
The product gas from the reactor was fed to a condenser unit, cooled to 4°C in order to remove reaction water. The dried product gas was then directed to the gas separation membrane.
The single biogas upgrading membrane module (Evonik SEPURAN® Green, 2 inch) was already used to perform the membrane characterisation experiments of the previous work (Gantenbein et al., 2021). It remained installed in a temperature-controlled water bath to ensure a constant temperature. To ensure pre-heating of the feed gas, it was fed through a coiled section of tube, which was also submerged in the water bath. Throughout the complete experimental work, the membrane module was operated at 40°C.
The permeate side of the module was equipped with two exits, which allowed to change the flow configuration from co-current to counter-current operation. For the experiments in this work, counter-current operation was chosen. For tests investigating the performance of the complete plant (and not only of the reactor itself), the permeate was recycled to the inlet of the compressor. At the retentate outlet, as well as on the permeate outlet, pressure regulators were installed to set a defined pressure regime in the membrane module. The volumetric flow rates of the retentate and permeate streams were recorded by two mechanical gas meters (Wohlgroth G4).
Throughout the plant, various sampling positions were available for the analysis of the gas composition. All three streams entering and leaving the membrane module were monitored by μGCs, which allowed a full concentration measurement every 3–4 min. Furthermore, as part of the control system, the plant had two non-dispersive IR spectroscopy (NDIR, Siemens Ultramat 23) devices available, which continuously recorded the gas composition before the gas cleaning and the product gas of the reactor.
2.1.1 Part load operation with limited biogas and H2 supply
In the experiments, the part load behaviour of the methanation pilot plant should be investigated for the case, where the carbon source and the hydrogen supply are limited to the same extent. In this case, the reactor operates with a slightly over-stoichiometric amount of hydrogen, but at a fraction of the full methanation capacity, i.e. the overall feed gas flow rate is reduced.
2.1.1.1 Operation window of the methanation reactor and of the complete PtG plant
In a first experiment, the part load option of only the methanation reactor was tested. The membrane module was used for single-stage hydrogen removal with an open hydrogen recycle loop, therefore the permeate of the membrane module was merged with the product gas stream again and not recycled. During these first tests, the lower limit of the reactor operation window was defined by the minimum flow rates that could be provided by the compressor and the MFCs. The maximum possible load was given by the maximum cooling rate of the reactor, which was identified as the point where the reactor temperature could be kept constant at the full cooling rate. This maximum point was determined for different fluidisation states.
The feed flow rate to the reactor was determined by the Coriolis flow meter. The conversion to a volumetric flow was performed using the NDIR concentration measurement, assuming that H2 can be calculated from the sum of all other species (CO2, CH4 and traces of CO).
In a second series of experiments, the possible part load range of the complete PtG plant was tested, i.e. including the hydrogen separation and recycle. For this operation with a closed recycle loop, the permeate stream of the membrane was merged with the raw biogas stream at the main compressor’s inlet.
2.1.1.2 Load profile
In order to simulate the dynamic operation of a PtG plant and to demonstrate the capability of a fluidised bed methanation with membrane-based upgrading in sequential part load operation, a load profile was followed during the experiments that is based on the availability of renewable energy.
The load profile was defined as part of the ReMaP1 project (Energy Science Center of ETH Zurich, 2022; Witte et al., 2022; Hofer and Jansohn, 2022; Boulouchos et al., 2020). It has the goal to cover a local hydrogen demand for public transport by PV, wind turbines and a seasonal storage system combining a battery, an electrolyser, a hydrogen tank, a methanation unit, and a steam reformer unit. To simulate and experimentally assess such a system, a control framework connected the infrastructures of Paul Scherrer Institute (PSI) and Swiss Federal Laboratories for Materials Science and Technology (Empa). This hardware-in-the-loop (HIL) approach allowed a simultaneous operation of the experimental facilities (i.e. electrolysis, battery, and methanation) as well as real-time simulation of virtual components (i.e. electricity input and H2 tank), as shown in Figure 2 (Boulouchos et al., 2020; Hofer and Jansohn, 2022). It is therefore possible to demonstrate the technical feasibility of such a system at a high TRL-level of 5 and above (Hofer and Jansohn, 2022). To match the nominal capacity of the process units to the capacity defined in the system-wide simulation, scaling factors were applied as indicated in Figure 2 (Hofer and Jansohn, 2022).
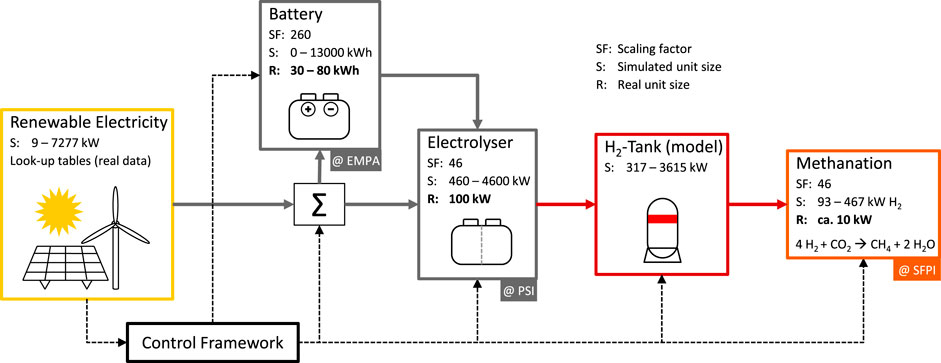
FIGURE 2. Topology of the system for the ReMaP experiment, adapted from Hofer and Jansohn (2022). The unit size of PSI and EMPA facilities are increased to the required unit scale (simulated unit size) by a scaling factor. The methanation unit is operated at a biogas plant (SwissFarmerPower Inwil).
For the experiment, five representative days of a full-year simulation of the system were chosen, where the capacity of the methanation unit was varied between 0% load and full capacity (Hofer and Jansohn, 2022). In real systems, load changes in the PtG plant more frequently than few times per day are not needed due to the dampening effect of the hydrogen tank. Such a tank has to be installed, as the methanation–due to its thermal inertia–cannot follow directly the production curve of the electrolyser. Therefore, the duration of the experiment was scaled by a factor of 24. The goal of the experiments was therefore to maintain stable operation at each load level for 1 h and then change to the next level. The sequence of part load levels tested in the methanation plant was 45%, 100%, 89% and 59%.
2.2 System analysis
To understand the potential of part load for the operation of a PtG plant under the condition of fluctuating electricity prices, a system analysis was performed to identify advantages such as longer operation and less start-up/shut-downs of the methanation plant.
Three different algorithms for the operation scheduling of the electrolyser and the methanation unit were developed (see Figure 3). In all of them, no part load of the electrolyser unit is considered, i.e. the electrolyser is either switched off or runs at full load. In this base-case, we assume that the methanation unit and the electrolyser are of equal size. Meaning that the nominal hydrogen output of the electrolyser corresponds to the stoichiometric requirement of the methanation plant at full load. The H2 tank size was defined as a capacity in hours, relative to the H2-feed of the methanation unit under full-load operation. Four different main tank sizes were considered in the analysis: 3, 6, 12, and 24 h. Two extreme values were added (48 and 200 h) to investigate the influence of very large storage capacity.
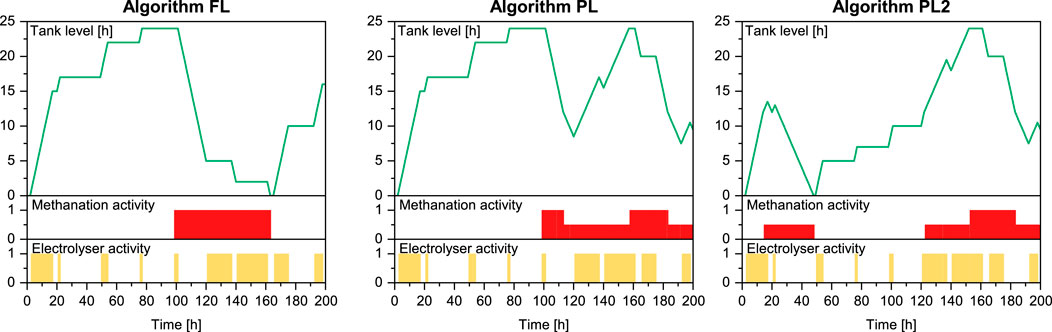
FIGURE 3. Comparison of the different algorithms for scheduling the operation of the methanation unit and the tank filling. The H2 tank level, methanation activity and electrolyser operation is shown over the same period of 200 h. In this example, an electricity threshold of 42.5 €/MWh and a H2 tank size of 24 h was considered. In all three cases, the activity of the electrolyser is identical. Based on the tank level, the methanation unit is operated.
In all algorithms, the electricity price curve is monitored at the market and based on a pre-defined threshold value the electrolyser is switched on or off. This threshold range was varied between 5 €/MWh and 200 €/MWh. As a time-horizon for the analysis, we obtained market data from the European Power Exchange and considered the years from 2007 to 2019 (European Energy Exchange (EEX), 2022).
Such a consideration based on pure electricity cost does not directly reflect the use of renewable electricity and does not automatically lead to a renewable PtG process. Nevertheless, it is assumed that renewable electricity generation will have a higher influence in the future energy system and will affect the electricity cost based on their present availability. An increased, but stochastic availability of wind energy and the more predictable availability of solar energy might cause a high overproduction of electricity during certain times, and this will lead to higher fluctuations in the energy market, an increasing share of renewable energies and therefore to a more sustainable energy system.
The hydrogen storage tank cannot only serve as a decoupling unit of the electrolyser and the methanation unit; it may also extend the methanation activity under highly fluctuating conditions on the electricity supply. In order to enable this behaviour, the electrolyser requires a higher nominal capacity than the methanation unit does. In this work, an electrolyser capacity increase of 10%, 20%, 60% and 100% was considered, while the existing CO2 source (biogas plant) defines the size of the upgrading unit–either methanation or membranes.
When the hydrogen production rate of the electrolyser is increased above the maximum capacity of the methanation unit, excess hydrogen is produced during long periods of low-cost electricity. As storage is limited, a strategy for handling the excess is required. Gorre et al. (2020) fix the electrolyser power and either optimise the tank size and methanation unit size to allow for a full use of hydrogen or they even allow for a certain discarding of H2 by flaring biomethane. Having a limited amount of biogas available for methanation, flaring is not an option. In this work, the electrolyser is switched off as soon as the tank level reaches the maximum. This is based on the assumption, that the plant is connected to the electricity grid and not required to perform balancing operations.
2.2.1 Basic algorithm (full load, FL)—No part load allowed
In the basic version of the algorithm, the electrolyser is switched on, as soon as the electricity cost of the upcoming 1 h-period is below the pre-defined threshold value. In the first priority, the H2 storage tank is filled to the maximum level. As soon as the tank is full, the methanation unit is started and runs at full capacity until the storage tank is empty. Depending on the electricity cost, hydrogen production is ongoing or not, causing the tank level to remain constant or not. The methanation unit is shut down as soon as the tank is empty. It is only restarted again when the tank level is at maximum.
2.2.2 Algorithm PL1
This algorithm operates the same way as in the basic version, but it considers part load operation of the methanation unit. When the tank is emptied below a level of 50% of the full capacity, the methanation unit changes operation to 50% part load, extending its operation time. The part load operation is maintained until the tank is empty and the methanation is shut down, or the tank reaches full capacity, which causes the methanation to switch again to full capacity.
2.2.3 Algorithm PL2
This algorithm also allows part load operation of the methanation unit. In addition to the operation concept explained in the previous section, this algorithm also enables 50% part load during the filling of the storage tank. As soon as the tank level reaches 50% capacity, the methanation is switched on at 50% part load. The load of the methanation unit is increased to 100% when the tank reaches the maximum capacity, turned down to 50% part load at 50% tank filling, or it is shut down when the tank is empty. Although we only consider discrete load changes, this operation mode corresponds in principle to the heuristics implemented in the simulations of Gorre et al. (2020) and Inkeri et al. (2021).
3 Results and discussion
3.1 Field experiments
3.1.1 Part load operation of the methanation reactor
The heat removal limit of the fluidised bed methanation reactor was determined without a closed recycle stream. It was identified as operation point, where the temperature in the reactor rises although the cooling was set to the maximum level.
The operation limit was tested at four different system pressures between 4 and 7 barg (see Table 1). As shown by the red points in Figure 4, higher pressures lead to lower maximum flow rates. The heat production is proportional to the molar flow of biogas, as full conversion is targeted for all pressures. Therefore the slightly lower operation limits at higher pressures indicate the impacts of the fluid-dynamics in the reactor where higher molar flows and lower pressures both lead to higher linear gas velocities and in consequence to more particle movements and better heat transfer to the cooling surface. Even larger capacity of the reactor would be possible by installing more heat transfer area within the given catalyst volume, i.e. by smaller hydraulic diameter of the reactor.
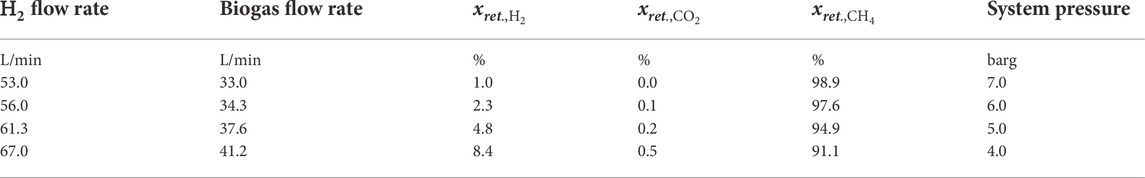
TABLE 1. Experimental settings used to determine the upper limit of the plant’s operation window, given by the maximum heat removal rate in the reactor. The plant was operated with an open recycle loop, the gas quality after the membrane upgrading is given by the retentate concentration measurement.

FIGURE 4. The operation window of the plant COSYMA is shown in terms of system pressure and H2 feed flow (energy input). The optimal fludidisation regime of the reactor is indicated by green shading. Three sets of experiments are shown: Sequential load change experiments (45%–100% load) with H2 recycling, the determination of the upper operation limit (plant operation limited by heat removal capacity, no recycling loop operated), and tests of the plant at the lower operation limit.
Further constraints are given as minimum and maximum fluidisation states in the reactor. Those are values based on experience with BFB methanation. The lower limit ensures a minimal fluidisation in the catalyst bed, which allows sufficiently high mass and heat transport for isothermal operation. More importantly, this also prevents the catalyst bed from settling, which would lead to fixed-bed-like behaviour, subsequent hot spot formation and catalyst deactivation. Operation of the reactor above the upper limit would lead to slightly increased attrition and carrying-out of the bed material.
As shown in Figure 4, the highest H2 flow rates applied were 67.0 L min−1. The lowest tested flow rate amounted to 13.3 L min−1, which corresponds to a part load level of 19.8%. Note that this lowest operation point in Figure 4 was reached by using mass flow controllers mimicking the biogas composition, as the operation line of the installed compressor would not allow such low flow rates at low pressures. In commercial scale systems, such operation points can be operated with a bypass flow around the compressor.
3.1.2 Part load operation of the complete PtG plant
While the previous tests showed that 20% part load in the reactor is possible, the performance of the complete plant with closed recycle loop had to be tested in a subsequent experiment to determine the maximum possible flow rate, i.e. the upper operation limit. Due to the manual regulation of the compressor duty and hydrogen supply to the plant, maintaining a stable operation was challenging to achieve. During several pre-tests, it could be observed that a slight over- or under-stoichiometric amount of hydrogen in the reactor’s feed could lead to positive/negative feedback effects in the system. The compressor operates with a fixed volumetric flow rate at a certain duty. When the hydrogen concentration in the reactor feed largely exceeds the stoichiometric ratio, a correspondingly large amount of unreacted hydrogen enters the membrane separation. Due to the high permeance of H2, the permeate stream increases, which displaces raw biogas from the compressor’s feed. This causes the amount of CO2 fed to the plant to decrease, which increases the amount of unreacted hydrogen in the product gas even more. It could be seen that the gas hold-up of the current set-up could be replaced by accumulated hydrogen within a few minutes. The same effect occurs when an over-stoichiometric amount of CO2 is fed to the reactor leading to a CO2 accumulation in the loops.
The NDIR provided fast measurements of the CO2 concentration after the reactor. During dynamic testing, this value proved as a reliable indicator for the gas compositions in the feed. As soon as the hydrogen concentration approached an under-stoichiometric level, the CO2 concentration in the product gas stream increased, which allowed a timely adjustment of the process parameters.
A hydrogen flow of 49.5 L min−1 was found as the maximum possible energy input for this configuration while still allowing to reach grid injection specifications. This means that not the heat removal, but the upgrading performance of the installed membrane limits the operation window.
Operation of the plant at this H2 flow rate showed a certain instability of the overall process, leading to the risk of accumulation of H2 in the system. In order to maintain a larger margin in adjusting process parameters and therefore a higher stability of the process, the maximum hydrogen feed flow rate for the subsequent series of part load experiments was reduced to 45 L min−1, which was defined as the 100% load operation. To allow higher H2 feed flow rates at the given pressure difference in the membrane without the H2 concentration in the product gas exceeding the 2% limit, a larger membrane module would be required to ensure grid quality. Therefore, in the current set-up, the compressor (which has a lower operation limit) and the membrane unit are limiting factors. As discussed above, with a bypass around the compressor (and more installed membrane area), also the complete PtG plant could reach a larger operation window, similar to that of the methanation reactor. Alternatively, in case of low fluidisation in the reactor, a short-cut connection between the membrane feed and the permeate could be operated, which directly recycles methane-rich product gas. At the same time, the total gas flow rate in the membrane module is reduced, which allows reaching grid injection limitations at lower pressure differences.
3.1.3 Sequential load changes
The final goal of the field test was to sequentially go through different part loads in a dynamic experiment, while still producing grid-compliant biomethane. In between the constant operation phases, the feed flows, pressure levels and compressor duties had to be adapted manually. The sequence is shown in Table 2 with the corresponding flow rate and pressure settings.
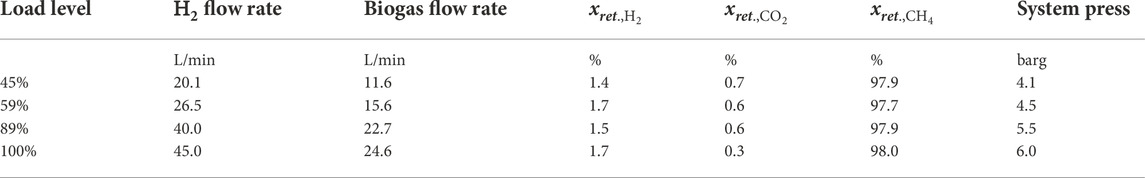
TABLE 2. Part load levels tested during the sequential experiment with corresponding average process conditions and product gas concentrations.
The composition of the product gas stream is shown in Figure 5. In this dynamic experiment, each setting was kept constant for around 1 h. After each load change, several adjustments of process parameters were required to maintain a stable operation of the process. As shown by the concentration measurement in the product gas stream, the grid injection limitations for CO2 and CH4 were fulfilled throughout the whole experiment. The H2 concentration showed a slight violation of the 2% limit after each load change. This is caused by an accumulation of hydrogen in the permeate stream, which was recycled to the feed of the plant. Since there was no faster concentration measurement than the μGC available in the recycle stream, it was challenging to adjust the H2 flow to the reactor. It was therefore not possible to immediately compensate the overshooting H2 concentration in the product gas stream by reducing the H2 feed to the plant, which lead to limit violations for around 5–25 min after each load change. This indicates that with improved process analytics (e.g. NDIR to record all carbon-species) and more automated process control procedures, a load change would be possible in much shorter time on one hand and with less hydrogen accumulation in the recycle loop, on the other hand.
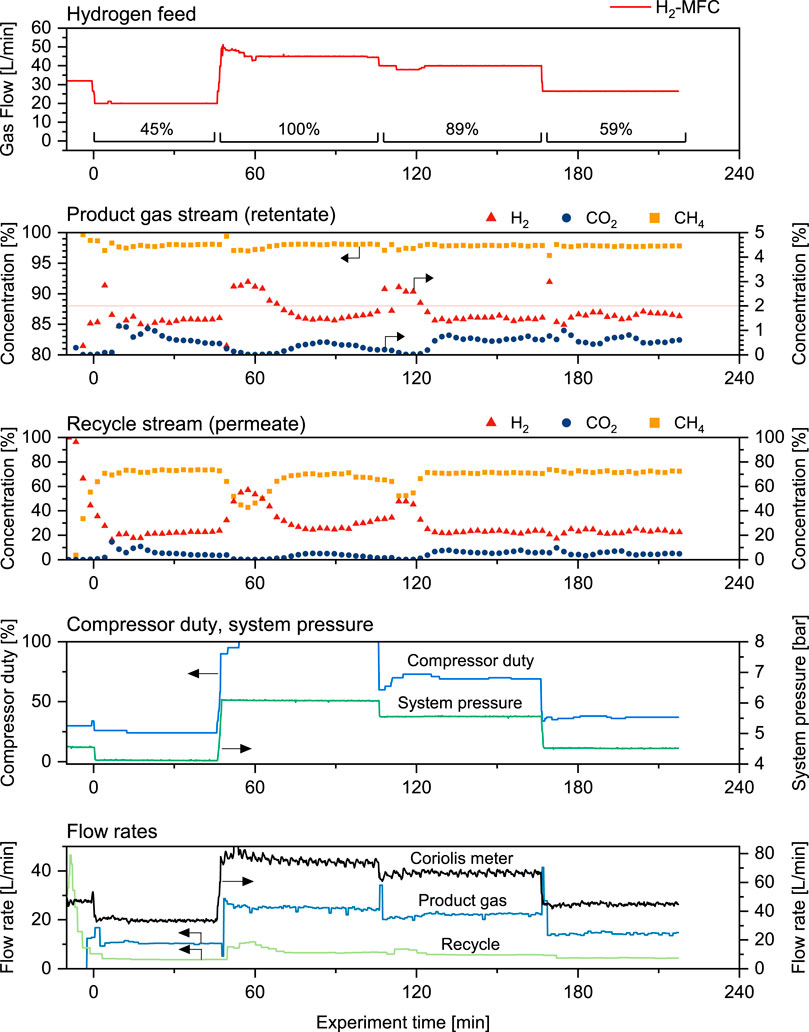
FIGURE 5. Dynamic methanation experiment–the most important process conditions and resulting concentration measurements are shown along the experimental time.
The operation points of the sequential load test are indicated in the operation window of the COSYMA plant in Figure 4.
3.2 System analysis
An analysis of the current EPEX electricity cost data was performed using the three algorithms presented before. Based on a threshold cost for electricity, these algorithms decide when the electrolyser unit is active, and subsequently they calculate the hydrogen storage tank level and the load of the methanation unit.
With increasing threshold value, more activity hours of the electrolyser are possible, and the higher is the amount of hydrogen produced. Obviously, that also leads to a longer operation span of the methanation unit. In this consideration, we decouple the operation of the electrolyser and the methanation unit by using the hydrogen storage tank. This means, that we can effectively use the hours with low electricity cost.
The buffer tank serves as accumulation unit to avoid short operation phases of the methanation unit that are connected to start-up and shut downs, thermal stresses in the plant, electricity consumption for re-heating and performance loss. For each algorithm, the number of start-ups of the methanation unit per year was determined. This gives an indication on the efficiency of the overall process, as each start-up operation is associated with a short operation state where grid injection limitations are not met and the product gas has to be flared. Figure 6 shows the average number of start-up operation per year for the three algorithms at four different tank sizes (3, 6, 12, and 24 h). The underlying electricity cost distribution corresponds to the current market situation.
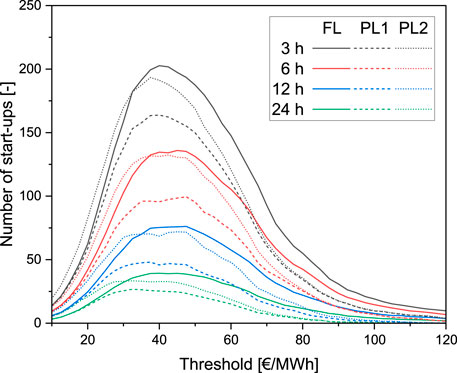
FIGURE 6. Average number of start up operations per year based on the price threshold for electricity is shown for all algorithms and tank sizes between 3 and 24 h capacity. The electricity cost profiles from 2007 to 2019 was considered for the evaluation.
As a general trend, it can be seen that larger tank sizes lead to a lower number of switching operations. Obviously, having a larger storage capacity available allows to bridge larger time spans with no hydrogen production on one hand, as well as operating the methanation unit longer with a single tank filling. Therefore, less start ups and shut downs are necessary.
Algorithm FL can be considered as a reference, as it only allows for full-load operation after the buffer tank is completely filled. In the case of a 6 h tank size, this leads to a maximum number of around 135 switching operation per year at a threshold of 40–50 €/MWh. At lower thresholds, the starts are less frequent, as the threshold is too low to produce large amounts of hydrogen. Above a threshold of 50 €/MWh, the number of switching operations decreases again for all algorithms. In this case, the threshold is above the main fluctuations and only peaks with high electricity cost cause the electrolyser to stop. Therefore, the methanation unit only shuts down for shorter periods of longer-term high electricity cost.
The maximum number of 135 starting operations mentioned before correspond to a start up every 2–3 days. This number decreases to around 55 in the case of 12 h tank size and 40 in the case of 24 h tank capacity. The maximum of this curve represents the threshold where the methanation is active for more than half of the year.
Similar to the full-load algorithm, the two part load versions show a steep increase of switching operations at low thresholds. The PL1 case even shows an identical behaviour as the full-load case, which is a consequence of the condition that the methanation is only allowed to start at full tank level. The algorithm PL2 allows a start of the methanation unit in part load operation at 50% tank level. This reflects in higher starting operations at low thresholds. In this case, the methanation is started in part load at relatively low tank level and therefore only operates for short times. It is therefore advisable to store hydrogen until at least one full tank capacity can be methanated. The advantage of part load starting can only be seen at high thresholds leading to high availability of hydrogen.
The algorithm PL1 initially shows an identical behaviour as the full-load case, but in the mid-range of thresholds, it leads to a lower amount of switching operations. This is the effect of switching the methanation to part load as soon as 50% tank level is reached. This leads to an extension of the operation time of the methanation, which ideally merges with the next operation period. Instead of several full-load operation cycles, an extended part load at 50% level is possible. As mentioned before, this leads to a reduction of starting and shut down operations, which unavoidably produce product gas losses and decrease the overall process efficiency.
It is important to mention that the number of full-load-equivalent operation hours of the electrolyser and the methanation unit are identical in all cases as the two units are designed for the same hydrogen capacity. Only the distribution over the year is different. Furthermore, the specific production costs of the biomethane are not directly affected as the same amount of biomethane is produced. An indirect contribution originates from the difference in tank size, i.e. lower CAPEX.
The hydrogen buffer tank acts as an integration unit for electricity cost. It is only filled when the current cost for electricity is below a certain threshold. The methanation operation hours can therefore be associated with the corresponding averaged electricity cost.
In Figure 7 (left), the operation hours of the methanation unit are shown against the electricity threshold cost. With increasing threshold, more of the electricity price curve can be covered, and a higher operation time of the electrolyser and the methanation unit is reached. The operation hours are shown for all three algorithms and tank sizes of 6 and 12 h capacity.
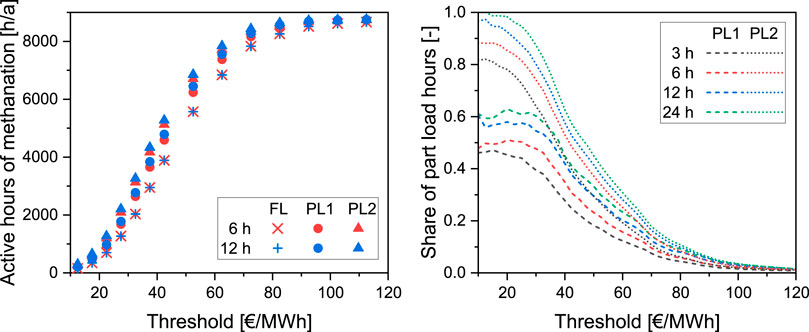
FIGURE 7. On the left side, the activity hours of the methanation unit, based on different threshold prices for electricity are shown. The right side shows the share of activity hours, where the methanation unit is operated in part load, in dependence of electricity threshold cost.
The distribution for the full-load algorithm is identical for all tank sizes. This algorithm does decouple the operation times of the electrolyser and the methanation, but does not extend the operation time of the methanation unit. This leads to a rescheduling of the activity of the methanation unit and a merging of short operation phases according to the tanks capacity.
The operation times of the methanation unit can only be extended when part load is allowed. In this operation, a certain influence of the tank capacity can be observed, nevertheless, as presumably large fluctuations cannot be covered by this relatively small tank sizes, the influence on operation cost is marginal.
The largest influence on the operation hours of the methanation unit has the chosen algorithm. This means that the heuristics of plant management are crucial in the effective use of the resources. Compared to the full-load algorithm at a threshold of 50 €/MWh, the part load algorithm increases the operation time by almost 1,000 h per year, the second part load algorithm by around 1,500 h per year. It is important to mention that this does not change the overall biomethane output of the plant, as a share of this operation hours refer to part load operation. As a fraction of these operation hours refer to operation in part load, this mode has also no influence on the cost of the electricity, which was used in the electrolyser, therefore no cost benefit arises from the current design. It simply allows the plant to be kept at operation temperature for 1,000 and 1,500 h more per year, which decreases intermediate cooling cycles or unproductive hot-standby phases.
As shown in Figure 7 (right), the operation heuristics of the plant have a great influence on the load-level of the methanation plant. At low thresholds, the first part load algorithm favours full-load operation, whereas the second operates almost only at part load. With increasing thresholds, the hydrogen production phases become more continuous and the share of part load hours of the methanation unit decreases. Even at thresholds around 50 €/MWh, the values obtained with algorithm PL1 are clearly lower than for the second but still at around 20%–30% part load operation.
The analysis shows that the two part load algorithms have different influence on the share of part load and full-load operation hours. The first algorithm clearly favours full-load operation, which is more desirable from plant operation perspective. It allows for an operation closer to the design specifications of the plant and therefore a more efficient use of resources. The first algorithm furthermore triggers less start-up cycles of the plant, which is another key advantage and efficiency gain of this heuristic.
Figure 8 (left) shows the benefit of introducing part load capability in the plant in terms of additional biomethane production time, compared to the full-load algorithm. It considers 15 min of gas flaring during the start-up of the methanation reactor. The algorithm PL1 shows a clear positive influence at all considered tank sizes. Using 3 and 6 h tanks, the algorithm allows an increase of 10 h per year. Larger tank sizes decrease the benefit even further, as generally less start-ups are performed. The second algorithm shows even a negative effect, which is caused by short part load intervals at low thresholds.
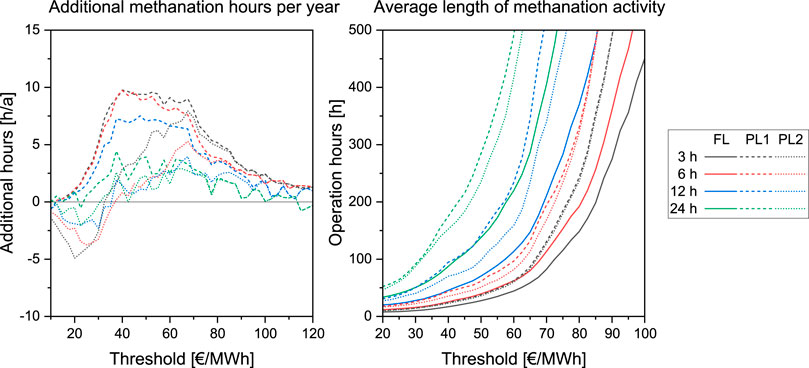
FIGURE 8. Left: Average number of additional biomethane production hours per year, compared to the full-load algorithm at different electricity cost thresholds. Each start-up operation is associated with a penalty of 15 min lost gas production time (i.e. flaring). Right: Duration of a methanation operation phase regardless of load level, as an average over the whole considered time period (2007–2019).
In Figure 8 (right), the operation time spans of the methanation unit are shown as an average over the whole considered time period. Both part load algorithms clearly increase the operation time compared to the full-load reference case. Already relatively low tank capacities allow to bridge interruptions in H2 supply and increase the methanation activity. At the larger tanks sizes investigated, it can be seen that the algorithm PL1 results in a larger increase of methanation activity. The methanation activity spans start to increase over-proportionally with larger tank sizes and higher price thresholds. This is a result of more short-termed fluctuations, which are bridged. The effect of extending the operation phases of the methanation unit can also be seen in the example shown in Figure 3: Algorithm PL2 leads to an early start-up of the methanation unit in part load and a subsequent shut down from 50 to 120 h. Algorithm PL1 favours an accumulation of H2 and leads to a start-up of the methanation at 100 h in full load. This consolidated operation of the methanation decreases the number of start-up and shut down operations.
The benefit indicated here is almost negligible in terms of additional methane production and therefore also in terms of cost. Nevertheless, in terms of plant operation, it is important to see that there is no negative impact on the methane production due to starting procedures.
3.2.1 Increasing the electrolyser power
Increasing the capacity of the electrolyser compared to the methanation results in a more frequent start-up of the methanation unit. A larger amount of hydrogen is available and the tank level reaches the trigger point to start the methanation faster (see Figure 9).
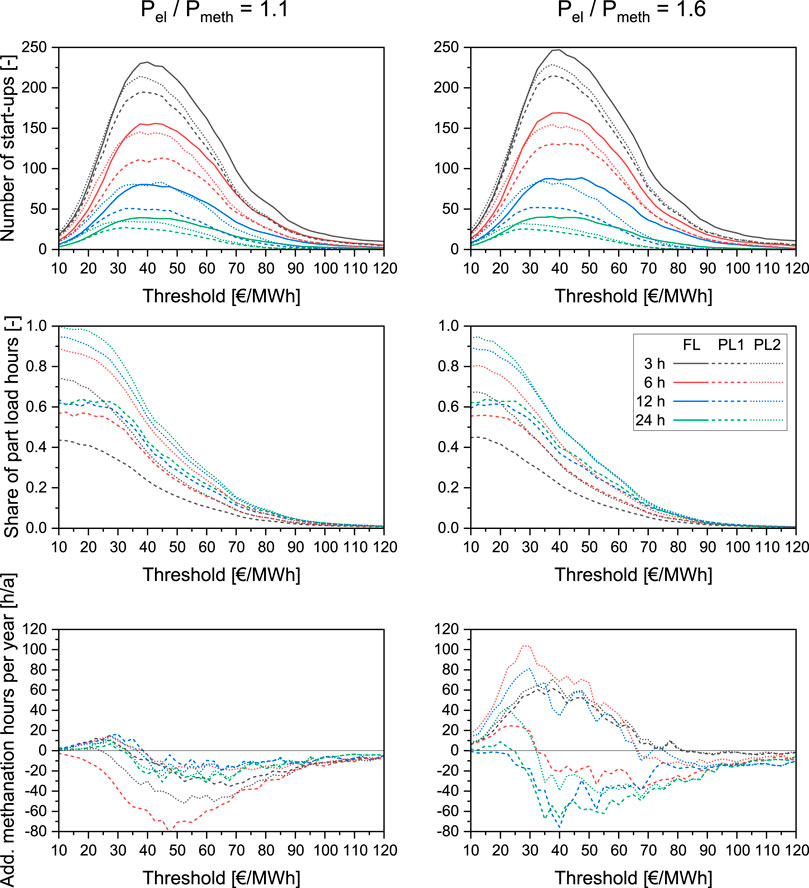
FIGURE 9. Effect of increasing the electrolyser power 10% and 60%, relative to the methanation capacity.
The second part load algorithm becomes more beneficial with increasing electrolyser power. The number of additional PtG operation hours and therefore the amount of produced biomethane increases with higher electrolyser power. Algorithm PL2 provides better use of the produced hydrogen, as it allows for a start-up of the methanation plant before the storage is full. Therefore, a higher amount of hydrogen can be converted through the system than with the first part load algorithm or no part load at all.
A beneficial effect of the tank and the electrolyser size on the average cost of the electricity used could only be observed at extreme cases. Increasing the tank size to 200 h capacity and over-sizing the electrolyser by 100%, resulted in an increase of the operation time of the methanation unit of around 1,000 h per year in the mid-range of the distribution curve. Such a tank and electrolyser size are economically unfeasible for a stand-alone biogas plant to realise. Nevertheless, if tank and electrolyser are available from another process, flexible methanation can be included as a synergy. Although this is only a simplified consideration, which opens room for further optimisation, these insights justify the use and the need for part load capability of the methanation unit. On one hand to decrease gas losses by flaring during start-up procedures, on the other hand by decreasing time-consuming heating of the methanation unit by enabling hot-standby phases. Overall, a process with higher stability in the downstream part is possible. This is especially also favourable in terms of lifetime of the methanation unit, as less thermal stress is caused and catalyst deactivation is reduced due to more stable process operations. An additional aspect refers to the adsorptive raw gas cleaning, which can also be operated more stably, which reduces desorption of contaminants and subsequent poisoning of the methanation catalyst (Calbry-Muzyka et al., 2019).
4 Conclusion
In this work, we investigated how part load operation increases the flexibility of a PtG process chain for biogas upgrading. The system considered is based on a concept of earlier work, which allows a flexible upgrading of biogas, either by direct methanation or by membrane separation of CO2.
The part load behaviour of the process chain was tested in a TRL 5 methanation pilot plant during a field campaign using real biogas. In a first set of experiments, it was shown that the load maximum of the plant was given by the heat removal capacity in the reactor. In a second set of experiments, the minimum load of the bubbling fluidised bed reactor was determined to be 20% of the full load (based on H2 flow rate).
A stable operation of the full process chain including the upgrading membrane and subsequent H2-recycling could be successfully shown. Grid-ready biomethane was produced in a load range of 45%–100%. Nevertheless, special attention had to be taken to prevent H2 and CO2 accumulation in the recycle loop, which led to a displacement of raw biogas in the plant’s feed and subsequently to a decreased conversion in the reactor. In newly designed plants, specific sensors and automated control mechanisms could prevent such feedback loops. The lower part load limit was given in this specific set-up by the installed membrane area, which was insufficient to remove H2 at lower pressure levels.
Furthermore, a system analysis (regarding electrolyser, H2 storage tank, and methanation) was performed, which shows the necessity to enable part load operation of the PtG plant. Operation times of the methanation unit could be increased, as part load operation phases bridge between times, where cheap, renewable electricity is available. Larger H2 tank sizes further decrease the average number of start-up operations of the methanation unit per year. To find the optimum tank size, further optimisation is required, which includes economic factors in the analysis.
In the system analysis, three different heuristics for plant operation were tested. It revealed that the trigger point for methanation start up (i.e. H2 storage tank level) has a high influence on the average number of start up and shut down operations. Allowing the methanation plant to start up in part load before the H2 storage level reaches its maximum results in a higher number of short operation phases of the methanation unit. Accumulating H2 in the tank to be able to run the methanation for at least one tank capacity proved to be more favourable in terms of start up operations and consecutive methanation operation.
Data availability statement
The raw data supporting the conclusion of this article will be made available by the authors, without undue reservation.
Author contributions
AG investigation, conceptualisation, design of experiments, data evaluation and software, writing—original draft. TS conceptualisation, design of experiments, writing—editing.
Funding
This work was supported by the Swiss Federal Office of Energy as well as by Professor Alexander Wokaun and the ETH Zurich Foundation within the ReMaP project. Open access funding provided by PSI - Paul Scherrer Institute.
Acknowledgments
All authors would like to acknowledge financial and other support from the ESI Platform at PSI. The authors thank Marlene Lasser for supporting the experimental work and data evaluation. Julian Indlekofer, Robert Janz, Martin Künstle, Hansjörg Wagenbach, and Tanja Wieseler shall be thanked for operating and maintaining the experimental set-up. The operators of the biogas plant of Swiss Farmer Power Inwil (SFPI) are thanked for providing access to their facilities. Julian Indlekofer, Robert Janz, Martin Künstle, Tanja Wieseler, Hossein Madi, Philippe Buchecker (Energy Science Center, ETH Zurich), Markus Obrist (ESI platform, PSI), and Christian Peter (ESI Platform, PSI) are thanked for preparing and performing the experiment related to the ReMaP project.
Conflict of interest
The authors declare that the research was conducted in the absence of any commercial or financial relationships that could be construed as a potential conflict of interest.
Publisher’s note
All claims expressed in this article are solely those of the authors and do not necessarily represent those of their affiliated organizations, or those of the publisher, the editors and the reviewers. Any product that may be evaluated in this article, or claim that may be made by its manufacturer, is not guaranteed or endorsed by the publisher.
Footnotes
1Renewable Management and Real-Time Control Platform, Homepage: https://remap.ch/.
References
Boulouchos, K., Brenzikofer, A., Demiray, T., von Euw, M., Flamm, B., Haselbacher, A., et al. (2020). Remap: Forschungsplattform für multienergiesysteme. Aqua Gas, 14–15.
Buttler, A., and Spliethoff, H. (2018). Current status of water electrolysis for energy storage, grid balancing and sector coupling via power-to-gas and power-to-liquids: A review. Renew. Sustain. Energy Rev. 82, 2440–2454. doi:10.1016/j.rser.2017.09.003
Calbry-Muzyka, A. S., Gantenbein, A., Schneebeli, J., Frei, A., Knorpp, A. J., Schildhauer, T. J., et al. (2019). Deep removal of sulfur and trace organic compounds from biogas to protect a catalytic methanation reactor. Chem. Eng. J. 360, 577–590. doi:10.1016/j.cej.2018.12.012
Collet, P., Flottes, E., Favre, A., Raynal, L., Pierre, H., Capela, S., et al. (2017). Techno-economic and Life Cycle Assessment of methane production via biogas upgrading and power to gas technology. Appl. Energy 192, 282–295. doi:10.1016/j.apenergy.2016.08.181
Energy Science Center of ETH Zurich (2022). ReMaP - renewable management and real-time control platform. Available at: https://remap.ch/ (Accessed July 19, 2022).
Estermann, T., Newborough, M., and Sterner, M. (2016). Power-to-gas systems for absorbing excess solar power in electricity distribution networks. Int. J. Hydrogen Energy 41, 13950–13959. doi:10.1016/j.ijhydene.2016.05.278
European Energy Exchange (EEX) (2022). Electricity spot price. Available at: https://www.epexspot.com/ (Accessed July 19, 2022).
Gantenbein, A., Lasser, M., and Schildhauer, T. J. (2022). A rate-based membrane model to simulate seasonally flexible electricity storage by Power-to-Gas and conventional biogas upgrading. manuscript in preparation.
Gantenbein, A., Witte, J., Biollaz, S. M., Kröcher, O., and Schildhauer, T. J. (2021). Flexible application of biogas upgrading membranes for hydrogen recycle in power-to-methane processes. Chem. Eng. Sci. 229, 116012. doi:10.1016/j.ces.2020.116012
Gorre, J., Ruoss, F., Karjunen, H., Schaffert, J., and Tynjälä, T. (2020). Cost benefits of optimizing hydrogen storage and methanation capacities for Power-to-Gas plants in dynamic operation. Appl. Energy 257, 113967. doi:10.1016/j.apenergy.2019.113967
Hofer, M., and Jansohn, P. (2022). ESI achievements report. Tech. Rep. Villigen: Paul Scherrer Institute. doi:10.3929/ethz-b-000553744
Inkeri, E., Tynjälä, T., and Karjunen, H. (2021). Significance of methanation reactor dynamics on the annual efficiency of power-to-gas -system. Renew. Energy 163, 1113–1126. doi:10.1016/j.renene.2020.09.029
International Energy Agency (IEA) (2021). Renewables 2021 – analysis and forecast to 2026. Tech. rep. Paris: International Energy Agency.
Kreitz, B., Brauns, J., Wehinger, G. D., and Turek, T. (2020). Modeling the dynamic power-to-gas process: Coupling electrolysis with CO 2 methanation. Chem. Ing. Tech. 92, 1992–1997. doi:10.1002/cite.202000019
Schillinger, F. (2018). Systematic assessment and application of local optical and two-dimensional X-ray measurement techniques for hydrodynamic characterization of bubbling fluidized beds. Ph.D. thesis, ETH Zurich. doi:10.3929/ethz-b-000306127
Simonis, B., and Newborough, M. (2017). Sizing and operating power-to-gas systems to absorb excess renewable electricity. Int. J. Hydrogen Energy 42, 21635–21647. doi:10.1016/j.ijhydene.2017.07.121
Witte, J., Calbry-Muzyka, A., Wieseler, T., Hottinger, P., Biollaz, S. M., and Schildhauer, T. J. (2019). Demonstrating direct methanation of real biogas in a fluidised bed reactor. Appl. Energy 240, 359–371. doi:10.1016/j.apenergy.2019.01.230
Witte, J., Kunz, A., Biollaz, S. M., and Schildhauer, T. J. (2018). Direct catalytic methanation of biogas – Part II: Techno-economic process assessment and feasibility reflections. Energy Convers. Manag. 178, 26–43. doi:10.1016/j.enconman.2018.09.079
Keywords: power-to-gas, part load, biogas upgrading, grid injection, fluidised bed methanation, system analysis, hydrogen recycle, field experiment
Citation: Gantenbein A and Schildhauer TJ (2022) Challenges in part load operation of biogas-based power-to-gas processes (part I). Front. Energy Res. 10:1049687. doi: 10.3389/fenrg.2022.1049687
Received: 20 September 2022; Accepted: 15 November 2022;
Published: 08 December 2022.
Edited by:
John Bøgild Hansen, Haldor Topsoe, DenmarkReviewed by:
Pedro Haro, Universidad de Sevilla, SpainShiplu Sarker, Norwegian University of Science and Technology, Norway
Copyright © 2022 Gantenbein and Schildhauer. This is an open-access article distributed under the terms of the Creative Commons Attribution License (CC BY). The use, distribution or reproduction in other forums is permitted, provided the original author(s) and the copyright owner(s) are credited and that the original publication in this journal is cited, in accordance with accepted academic practice. No use, distribution or reproduction is permitted which does not comply with these terms.
*Correspondence: Tilman J. Schildhauer, dGlsbWFuLnNjaGlsZGhhdWVyQHBzaS5jaA==