 Bin Zhu
 Xiaorui Hu
- State Grid Chongqing Electric Power Company Marketing Service Center Metrology Center, Chongqing, China
In recent years, with the development of new energy technology and the country’s strong support for electric vehicles, there is a lack of effective electric vehicle charging fault analysis and diagnosis methods at this stage. A comprehensive analysis of the working principle of the charging process of electric vehicles, based on the clarification of the failure mechanism of the power battery and charging equipment, analyzes the fault-related factors affecting the power battery and charging equipment from multiple angles, and summarizes the relationship between the power battery and charging equipment. The feature parameters related to equipment failure are discretized by the k-means clustering algorithm. Using the optimized FP-Growth algorithm based on weights, the association rules between the power battery and charging equipment failures and the characteristic parameters of the failure factors are mined, and the correlation of the failures is analyzed based on the association rules, and the correlation between the failure factors and the failures is obtained relevant level.
1 Introduction
1.1 Motivation and incitement
With the rapid development of social economy and science and technology, China has done a lot of work in the construction of transportation infrastructure. The developed transportation industry and the increasing living standards of residents have led to a gradual increase in residents’ demand for automobiles as a means of transportation. However, the increasing number of motor vehicles means an increase in energy consumption, and at the same time it will cause continued environmental degradation. In this context, the country vigorously promotes the use of clean energy electric vehicles to replace traditional fuel vehicles in the field of transportation. At the same time, it has also issued a large number of preferential policies for electric vehicles to encourage residents to purchase and use electric vehicles as a means of family transportation (Zhu et al., 2021). In the charging process of electric vehicles, due to the operation of a large number of power electronic devices, various failures will occur, and in serious cases, safety accidents may even occur, threatening the personal and property safety of users (Tang and Cao, 2020).
1.2 Literature review
Research on the charging failure of electric vehicles is still in the preliminary stage, and the standards issued by the state and enterprises for the safety of electric vehicle charging also need to be improved. Wu Chao (Wu, 2019) designed an abuse experiment for lithium iron phosphate power batteries, summarized the failure mechanism of each component of the lithium battery, and proposed diagnostic methods and diagnostic strategies for typical failures of lithium iron phosphate batteries. However, the impact of charging facilities is not taken into consideration. Ma et al. (2020) constructed characteristic parameters that can characterize the characteristics of power batteries, and extracted the characteristic parameter thresholds for safe charging of power batteries by analyzing the changes of characteristic parameters, providing a basis for power battery failure mode identification. In this paper, the characteristic parameters of power battery characteristics and the characteristic parameters of charging facility operation characteristics are combined and analyzed to study their fault correlation and dig out the causes of charging faults of electric vehicles. Wilhelmiina Hämäläinen (Hämäläinen., 2016) used Fisher’s exact test method to solve the problem of unreliable results in dependency rule mining. At the same time, the new solution-Fisher’s exact test, has lower time complexity and higher accuracy. V. J. Rayward-Smith (Rayward-Smith, 2007) proposed a new technology to measure the correlation between real value data and nominal data, which relies on the definition of assigning nominal value to actual value. The proposed assignment is defined to be the most favourable of all such assignments and can be efficiently computed. Wu et al. (2020) applied the time series model to the fault diagnosis of the power battery of electric vehicles, using the principle of moving window deviation as an evaluation index for monitoring battery faults, and established a battery fault model on the MATLAB platform to conduct experiments. In order to adapt to the rapid increase in the number of electric vehicles, Western countries have begun to establish electric vehicle charging networks in the form of cooperation between traditional car companies and energy companies. At present, a series of standards have been formulated for the safety of charging equipment (IEC 62196-1-2014, 2014), which stipulate electric vehicles. Equipment related parameters and safety features involved in the process of car charging and discharging. Ru et al. (2017) conducted a safety evaluation on the electrical safety protection measures of electric vehicle charging equipment, established an evaluation index system for electrical safety, and verified the effectiveness of the evaluation method through experiments. Meng Jianzhong (Meng, 2018) designed the DC charging device and AC charging device of electric vehicles, and formulated the fault diagnosis strategy of the charging equipment using the finite state machine method, and verified the charging equipment’s charging overvoltage fault, insulation fault, and insulation fault through experimental tests. Successfully realize fault diagnosis when communication faults and emergency stop faults occur. However, the correlation between faults is not deeply explored and the internal factors of faults cannot be accurately identified. Yu Chang (Yu, 2020) analyzed the safety influencing factors of electric vehicle charging equipment, developed an index system for evaluating the health of charging equipment from two aspects: electrical performance and safety performance, and designed the health of charging equipment based on the uncertainty analytic hierarchy process. Comprehensive evaluation method of state. In terms of artificial intelligence, the main idea is to make intelligent machines think and react in an artificial manner. In the field of equipment failure analysis, artificial intelligence technologies such as expert systems, neural networks, and data mining have also begun to have a large number of applications. It provides a thought for the analysis of fault correlation factors in this paper, but does not investigate the fault cause and mechanism. Zhao et al. (Zhao and Jiang, 2020) designed a fault diagnosis method for vehicle electronic accelerator pedal based on PNN and BP neural network methods, and verified the effectiveness of the method through experiments. Hu Jun (Hu et al., 2017) and others discovered the law of the state recording data of power transmission and transformation equipment through big data mining technology, and realized the fault diagnosis of power transmission and transformation equipment based on this. Qiu. (2020) analyzed EMU fault alarm data through data mining technology, and obtained the knowledge of EMU fault alarm correlation, which provided a basis for EMU fault location. Zhang X C et al. proposed a fault analysis method for power distribution terminal units based on association rule mining algorithms, which can objectively and comprehensively analyze and diagnose faults (Zhang et al., 2021). Zhang Y L et al. (Zhang et al., 2020) proposed a Right-Hand Side Expanding Algorithm suitable for association rule mining, which can quickly and accurately process frequent itemsets and accurately find all maximal frequent itemsets. However, this method has some limitations. Inspired by this, we propose an FP-growth algorithm based on weighted optimization, which solves the problem that high-level faults may be missed if the minimum support is set too small.
1.3 Contribution and paper organization
In summary, it is important to make full use of the advantages of artificial intelligence technology, improve the research on the correlation analysis of electric vehicle charging faults, and obtain the correlation knowledge between different faults in the charging process of electric vehicles. This article first analyzes the working principles of power batteries and DC charging piles. Based on this, the fault-related factors are analyzed and the fault-related characteristic parameters are designed. The clustering method is used to discretize the fault-related characteristic parameter data, and the application is obtained. Transaction data set for mining association rules. Finally, the weighted optimized FP-Growth algorithm is used to mine the association rules between the power battery and charging equipment faults and their characteristic parameters, and the correlation between the power battery and charging equipment faults is analyzed based on the association rules, and the optimization is verified by experiments. Compared with the original FP-Growth algorithm, the method has superiority in algorithm performance.
The rest of this article is arranged as follows. Section 2 discusses the working principle of electric vehicle charging. Section 3 discusses the fault factor correlation model and proposes the FP-growth algorithm based on weighting, and then establishes the charging fault data mining model. Section 4 tests the data mining model and shows some fault association rules mined by the algorithm. Section 5 is the conclusion.
2 Working principle of electric vehicle charging
2.1 Working principle of power battery
2.1.1 Analysis of the working principle of lithium iron phosphate battery
The lithium iron phosphate battery relies on the transfer of lithium ions inside the battery to form current in the external circuit. Figure 1 shows the internal structure of the lithium iron phosphate battery. The internal structure of the lithium iron phosphate battery mainly has the following parts (Chang et al., 2020): First is the positive and negative electrodes of the battery. The lithium-ions inside the battery complete the deintercalation and intercalation reactions on the positive and negative electrodes. The main material of the positive electrode of the lithium-iron phosphate battery is lithium iron phosphate, and the negative electrode material is often graphite. Second is the positive and negative current collectors. The function of the positive and negative electrode current collectors of the battery is mainly to collect the current generated by the active material of the battery and output it to the outside. The positive electrode current collector material often uses aluminium foil, and the negative electrode current collector often uses copper foil. Third is the electrolyte. The migration of lithium ions inside a lithium iron phosphate battery requires electrolyte as a medium. Fourth is the diaphragm. In the lithium iron phosphate battery, it plays a role of isolating the positive and negative electrodes to prevent the internal short circuit of the battery.
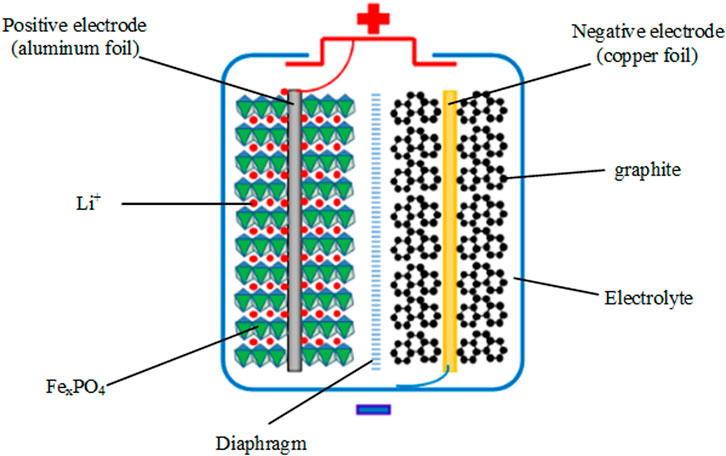
FIGURE 1. Internal structure of lithium iron phosphate battery.
When a lithium iron phosphate battery is charged, positively charged lithium ions are extracted from the positive electrode material of the battery into the electrolyte inside the battery, and are inserted into the negative electrode after passing through the diaphragm. Negatively charged electrons flow from the positive pole of the battery to the negative pole through an external circuit, so that the charge state of the positive and negative poles of the battery reaches a balance.
2.1.2 The working principle of ternary lithium battery
The composition structure of the ternary lithium battery is basically the same as that of the lithium iron phosphate battery. It is mainly composed of positive and negative electrodes, current collectors, separators, and electrolyte. The positive electrode material of the lithium battery is composed of three materials of lithium nickelate, lithium-cobaltate, and lithium manganate mixed in a certain proportion. The ternary lithium battery has a higher energy density, and more car companies apply it to their flagship models to obtain a higher cruising range.
When a ternary lithium battery is charged, positively charged lithium ions are extracted from the positive electrode material of the battery into the electrolyte inside the battery, and are inserted into the negative electrode after passing through the diaphragm. Negatively charged electrons flow from the positive pole of the battery to the negative pole through an external circuit, so that the charge state of the positive and negative poles of the battery reaches a balance.
2.1.3 Power battery charging characteristics
The electric vehicle power battery pack is composed of a certain number of single cells combined in series and parallel. The main performance parameters of the single power battery include nominal capacity, nominal voltage, internal resistance, charging voltage range, etc. The performance parameters of single power batteries produced by different manufacturers also have certain differences. This article selects a single battery with a nominal voltage of 3.2 V and a charging voltage range of 2.5V–3.65 V to show its own parameter changes and charging characteristics during charging.
Generally, the charging of lithium-ion batteries is a dynamic process of constant current, then constant voltage and then constant current (Guo, 2020). At the beginning of the charging process, the voltage of the battery is quickly raised to the cut-off voltage with a constant current, and then the battery is charged with a constant cut-off voltage until the charging current drops to a certain level (Li, 2015). After this process is completed, the battery has completed most of the charge, and then keeps a small current constant current charge to continue to replenish the power (Tan, 2020). Figure 2 shows the change curve of battery voltage with time during the charging process of a single lithium-ion battery at different charging rates.
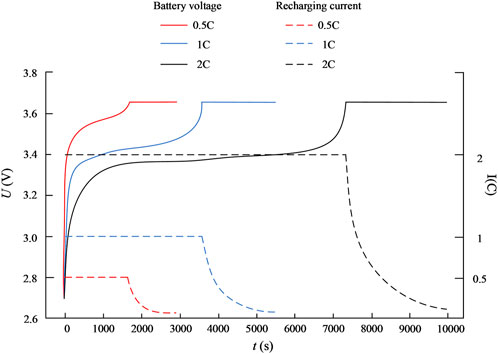
FIGURE 2. Changes in battery voltage and charging current under different charging rates.
2.1.4 Working principle of DC charger
The DC charger can output DC power to directly charge the power battery of the electric vehicle. Its charging power is large, also called a fast-charging pile. Since the fast-charging speed of DC chargers can meet the charging needs of more users, DC chargers have begun to become the mainstream of electric vehicle charging methods. The National Energy Administration has formulated an industry standard for DC chargers (NB/T 33001-2010, 2010), which stipulates that the DC charger is composed of the following parts. Figure 3 shows the composition and electrical structure of the DC charger.
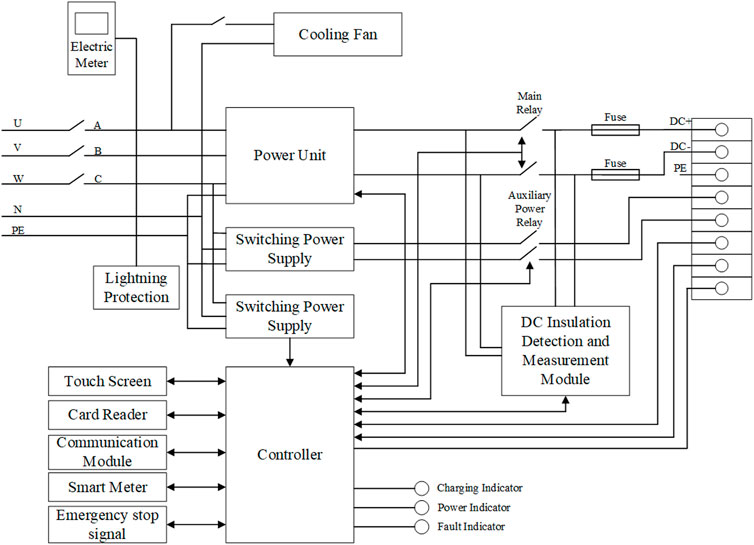
FIGURE 3. Electrical structure diagram of DC charger.
The DC charging pile includes four modules: power unit, control unit, metering unit and human-computer interaction interface. Among them, the power unit realizes the rectification and power factor correction of the AC power of the grid and then converts it into charging DC. The control unit can receive the user’s operation instructions to control the power unit, and then complete the charging start and stop control of the charging pile, power unit output control and other functions. The metering unit can record the electrical energy output by the DC charger to the power battery. The human-computer interaction interface can monitor the operating data of the charging process in real time and display the information on the screen to the user. At the same time, it supports the user’s operation instruction input and parameter setting, and informs the control. The unit completes the control of the start and stop of the charging process and the charging state.
The most critical part of the structure of the DC charger is the power unit, which can realize the rectification function from alternating current to direct current. The basic structure of the power unit is shown in Figure 4. The front part of the power unit has a rectification function to rectify the AC power of the grid into a direct current. The latter part has a DC conversion function to achieve electrical isolation and voltage conversion.
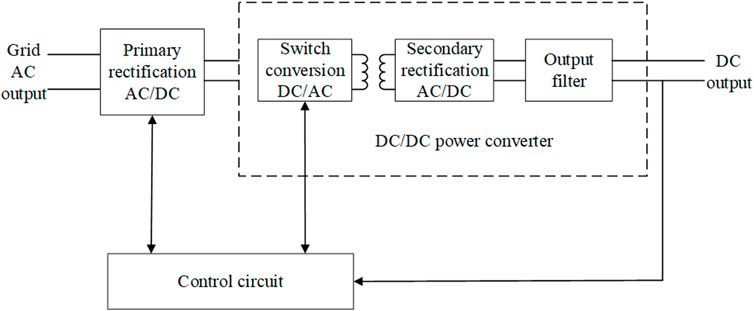
FIGURE 4. Basic structure diagram of DC charger power unit.
At present, the pre-stage circuit of the DC charger power unit is mainly selected as the VIENNA rectifier circuit. The voltage stress of the switch tube is half of the DC side bus voltage, which is suitable for high-voltage environments. The topological structure of VIENNA rectifier circuit of the front stage circuit is shown as in Figure 5.
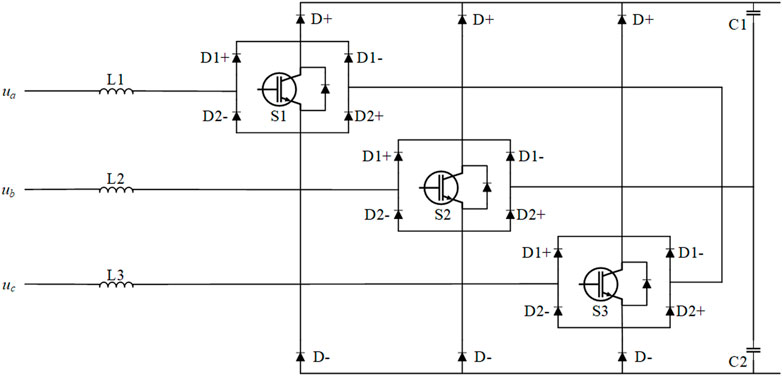
FIGURE 5. Topological structure of VIENNA rectifier circuit of front-end circuit.
The back-stage circuit of the DC charger power unit mainly adopts a phase-shifted full-bridge converter, which can realize electrical isolation and voltage conversion at the same time to realize soft switching of the circuit, thereby improving the transmission efficiency of electric energy. The circuit topological structure of the phase-shifted full-bridge converter of the latter stage circuit is shown as in Figure 6.
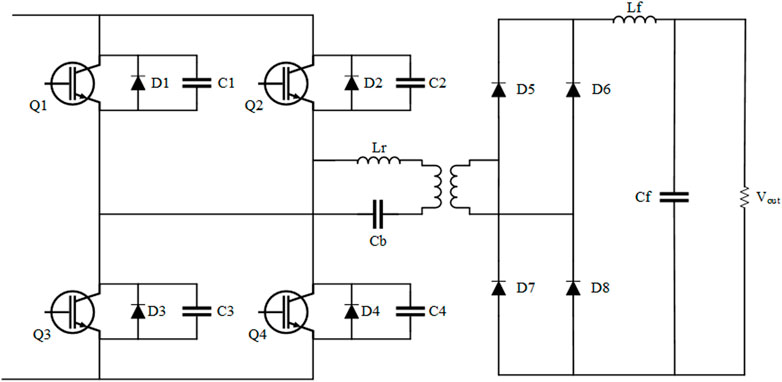
FIGURE 6. The circuit topology structure of the phase-shifted full-bridge converter of the back-stage circuit.
2.2 Analysis of failure mechanism and correlation factors of electric vehicle charging process
2.2.1 Analysis of power battery failure mechanism and related factors
Lithium-ion battery cathode material is lithium alloy metal oxide. The temperature at which the positive electrode of the lithium iron phosphate battery reacts with the electrolyte is around 230°C, and the temperature at which the other positive electrode materials react with the electrolyte is lower than this level. Therefore, the lithium iron phosphate battery has a higher temperature and thermal stability than other types of lithium-ion batteries. The excessive intercalation and deintercalation of lithium ions in the positive electrode, that is, overcharge will damage the lattice of the positive electrode material to accommodate the lithium ions, thereby reducing the capacity of the lithium-ion battery.
The anode material of lithium-ion battery is mainly graphite. In the pre-charging stage of the lithium-ion battery, the graphite of the negative electrode of the battery can react with the electrolyte to form a solid electrolyte interface (SEI) film on the surface. The SEI film can prevent the battery performance due to the continuous decomposition of the electrolyte in the battery. Decreases, but the formation of the SEI film consumes lithium-ions. During the charging process of a lithium-ion battery, the negative electrode of the battery will continuously insert lithium ions. If the speed of lithium-ion insertion into the negative electrode material is lower than the speed at which the negative electrode receives lithium-ions, this part of the lithium metal will be permanently withdrawn from the lithium cycle inside the battery, and decrease lithium-ion battery capacity.
The speed at which lithium ions are inserted into the negative electrode material is lower than the speed at which the negative electrode receives lithium-ions, which often occurs in the low-temperature charging and overcurrent charging conditions of lithium-ion batteries. It is necessary to strictly control the charging rate of lithium-ion batteries and reduce the charging current. Table 1 shows the phenomena and causes of power battery failure.
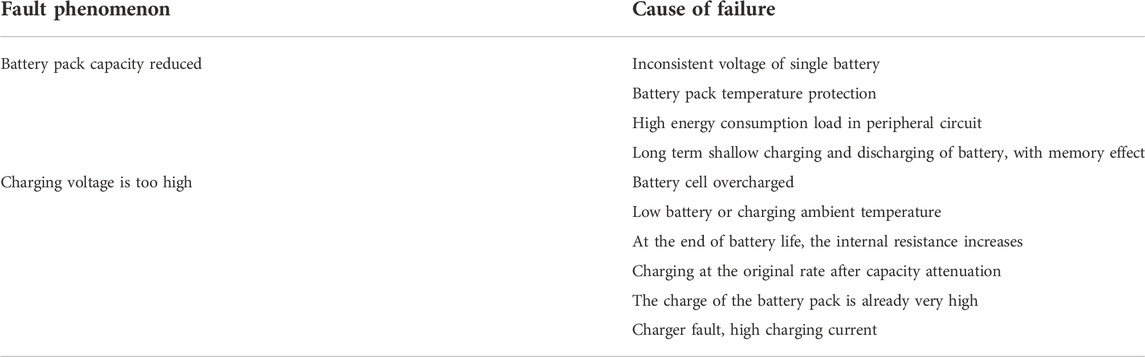
TABLE 1. Failure phenomena and causes of power battery.
In summary, the factors related to the failure of the power battery pack can be summarized as battery overcharge, ambient temperature, and charge rate.
2.2.2 Analysis of DC charger failure mechanism and related factors
Under the strong power input of the power distribution system, the insulating material of the charging equipment may break down, which will lead to the loss of insulation of the charging equipment. The insulation fault of the charging equipment is a serious fault, which may endanger personal safety. Once the insulation fault of the charging pile occurs, the charging pile will be shut down immediately and wait for professional maintenance personnel to repair.
The same environment will have different effects on the working conditions of the charging equipment such as excessive ambient temperature may cause over-temperature failure of charging equipment under normal use, higher humidity can affect the electrical insulation of charging equipment, the smoke and dust environment will affect the heat dissipation function of the charging and discharging equipment, etc. During the working process of the charging equipment, it is inevitable that abnormality will occur. For example, the failure of the temperature sensor may cause the charging and discharging equipment to generate an over-temperature false alarm. If the output current threshold of the charging and discharging equipment is set too small, it may cause an output over-current alarm. The circuit breaker of the charging and discharging equipment, contactor and other devices will trigger the protection of charging and discharging equipment to stop working when there is a failure.
The protection measures of charging equipment include equipment detection function, which can monitor the real-time operation status of the pile during the charging and discharging process, and also need to have protection against problems such as over-temperature of the pile, abnormal input and output, and short circuit. Insufficient protection measures for charging and discharging equipment will lead to equipment failures of different severity. Table 2 shows the fault phenomena and causes of DC charger.
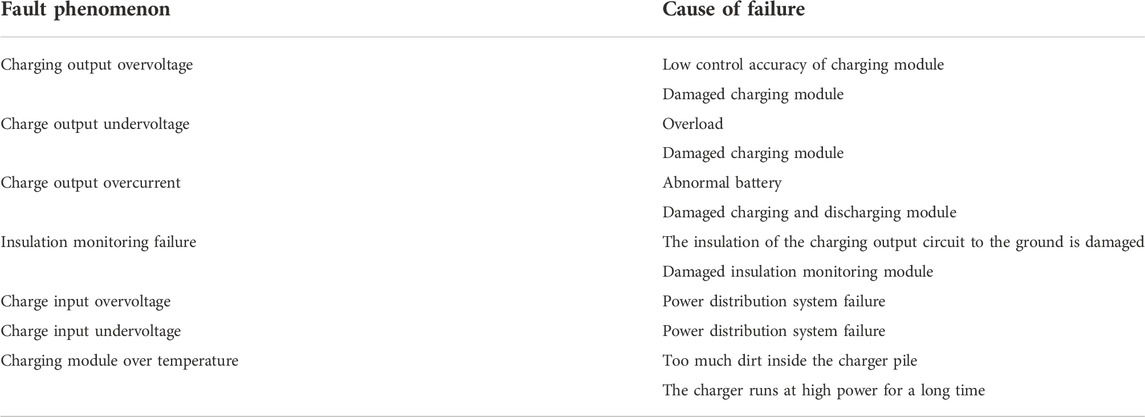
TABLE 2. Fault phenomenon and cause of DC charger.
In summary, the fault factors related to charging equipment are summarized as electrical insulation of charging and discharging equipment, environmental factors Charging and discharging equipment itself factors and pile protection measures.
3 Data mining model of electric vehicle charging failure
3.1 Page layout
In the field of electric vehicle charging, my country has initially formed a systematic standard and system. With reference to various national standards, industry standards, and related engineering and scientific research materials, we determine the temperature change rate of power battery packs, ambient temperature, battery charging overvoltage rate. The parameters of battery internal resistance, battery pack historical failure times, battery state of charge SOC, battery internal resistance change rate, charging voltage error rate and charging current error rate are used as characteristic parameters to characterize the correlation factors of charging equipment failures. Among them, the calculation formulas for battery charging overvoltage rate, charging voltage error rate and charging current error rate are expressed as follows:
3.1.1 Battery charging overvoltage rate
The normal power battery charging process has a specified charging voltage. Charging the power battery with a voltage exceeding the specified charging voltage will affect the battery. The charging overvoltage rate is calculated by the following formula.
3.1.2 Charge voltage error rate
The charging output error rate reflects the electrical performance of the charging equipment. Normal charging equipment requires that the charging output voltage error should not exceed
3.1.3 Charging current error rate
The charging output current error rate also reflects the electrical performance of the charging equipment. Normal charging equipment requires that the charging output current error should not exceed
Electric vehicle charging data is measured by sensor equipment, and various abnormalities will inevitably occur during the actual operation of the sensor. In view of this situation, this article deals with the data in consideration of the integrity and accuracy of the data.
First of all, from the perspective of data integrity, we should focus on checking for data lack of value. For missing data, calculate the mean of the two data points before and after the missing data point, and replace the missing data with the mean. Secondly, considering the accuracy of the data, selectively find out the wrong data points in the original data. This paper uses the calculation of the forward and backward third-order difference of the power battery SOC to determine whether the current data is wrong. The specific process is as follows:
Calculate the forward and backward third-order differences of all SOC data in turn:
The
For the data of the charging process, the following judgments are made:
If the current SOC data meets this condition, it is judged to be normal data, otherwise it is wrong data. For the SOC data judged to be wrong, the average value method is used for all the data collected this time, that is, the average value of the preceding and following items replaces this data point.
3.2 Association rule model
Life Science Identifiers (LSIDs) for ZOOBANK registered names or nomenclatural acts should be listed in the manuscript before the keywords with the following format:
Association rule mining is based on a large amount of data. By analyzing which data items appear together frequently, a collection of data items with many frequent items appearing together can be obtained (Nalini, 2016). In a transaction set, the frequency of the data item set can be represented by the concept of support. Suppose there is an item set X in the transaction set T. Define the number of occurrences of the item set X in the transaction set T as
With the definition of support, we can show how frequently the itemset X appears in the transaction set T. Here we introduce a definition of minimum support min sup. The criterion for item set X as a frequent item set is that its support is not less than min sup.
Use expressions
Both non-empty subsets
After setting a minimum degree of confidence, the association rules can be filtered through the minimum support and minimum confidence. When applying the association rule model to fault correlation analysis, you can choose the preceding item of the association rule as a symptom, and the latter item of the association rule as the failure phenomenon. Such an association rule can reflect the correlation between the symptom and the failure phenomenon, and the confidence level reflects. The credibility of fault association rules (Peng et al., 2019; Wang, 2020; Zhao and Su, 2021). In this paper, the association rule model is used in the analysis of the relevance of electric vehicle charging failures. The first item of the association rule is the characteristic parameter obtained after the K-means clustering algorithm is used to discretize the characteristic parameter data. It can be reflected by using the association rule mining algorithm. Fault association rules for the correlation between characteristic parameters and fault phenomena in the charging process of electric vehicles. The specific process of discretization is shown in Figure 7.
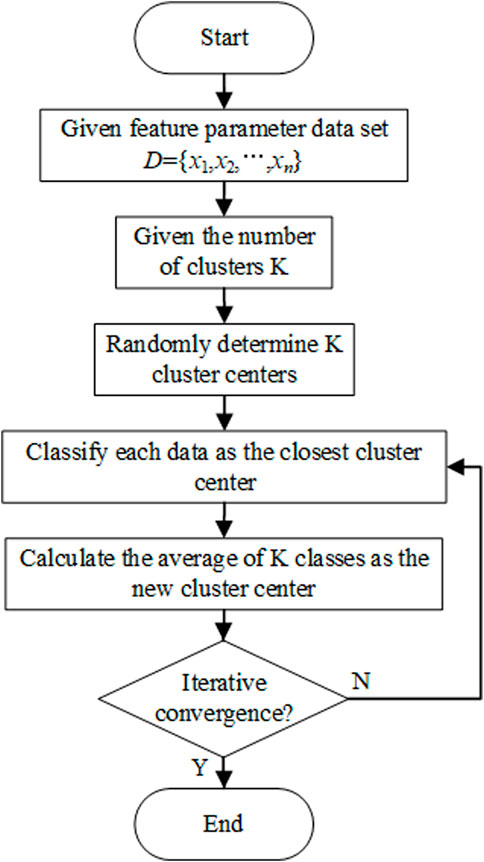
FIGURE 7. Process of discretizing feature data using K-means clustering algorithm.
3.3 Optimized FP-growth algorithm model based on weight
3.3.1 FP-growth algorithm model
FP-Growth uses frequent itemset growth to conduct correlation mining. By recursively searching for frequent patterns on the FP tree, add a suffix to each frequently mined pattern to obtain all frequent patterns suffixed with a frequent item (Zeng et al., 2019). FP-Growth algorithm has better efficiency when mining a large amount of data, so it is suitable for complex charging fault data mining. The flow of the FP-Growth algorithm is shown in Figure 8.
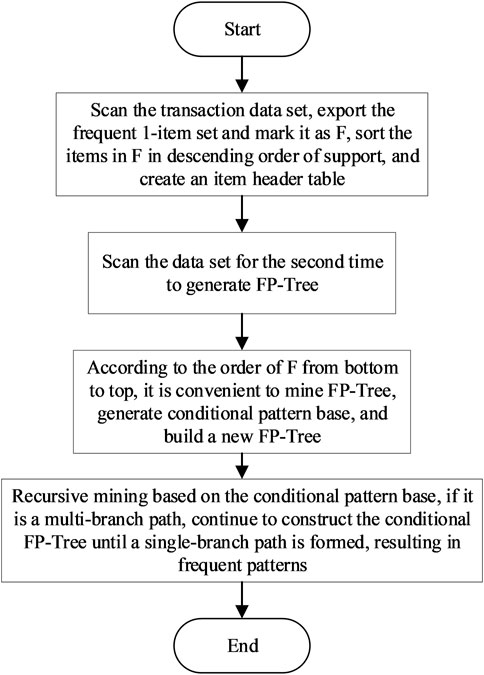
FIGURE 8. FP-Growth algorithm flow chart.
Take the transaction set in Table 3 as an example to introduce the principle of the FP-Growth algorithm.
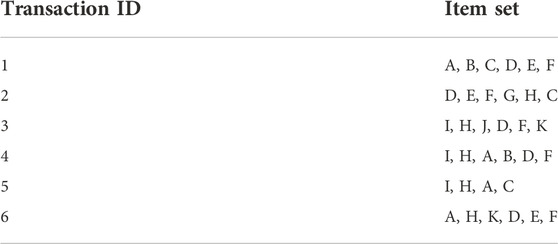
TABLE 3. Example table.
Set the minimum support to 3, the first step of the algorithm is to scan the transaction set to obtain frequent 1-itemsets, and arrange the itemsets according to the support to form the item header table F = {{F:5}, {H:5}, {D:4}, {E:4}, {A:4}, {C:3}, {I:3}}. Scan all transactions in the transaction set T, access each item in the order in F, and do not deal with infrequent items. The sorted transaction set is shown in Table 4.
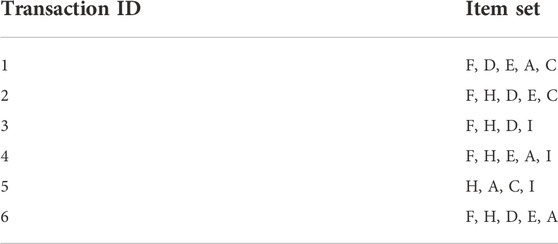
TABLE 4. Transaction set in descending order of support.
The root node of FP-Tree is marked as Null, and each sorted transaction record is scanned in turn to form each branch of FP-Tree. The final FP-Tree is shown in Figure 9. It can be seen that FP-Tree contains all the information needed to mine frequent itemsets in the transaction set T.
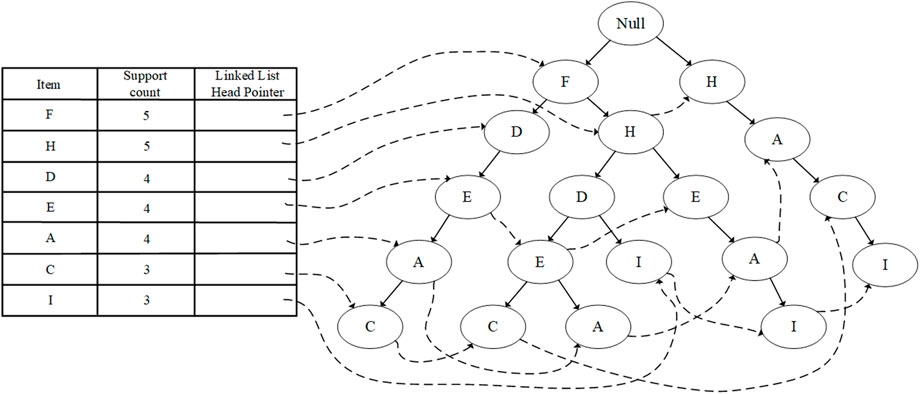
FIGURE 9. Complete FP-Tree.
The item header table has been arranged according to item support, so in each frequent pattern, the item with high support must be in front of the item with low support, so that the divide and conquer strategy can be used to mine all frequent items. First, mine the frequent patterns suffixed with I to obtain the conditional pattern library of I. After removing the infrequent items from the conditional pattern library, the database and its corresponding conditional FP-Tree are shown in Table 5; Figure 10.
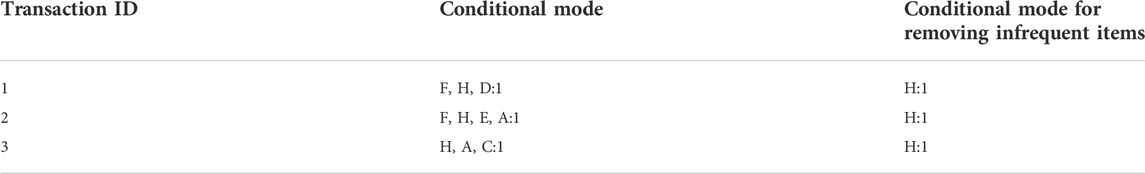
TABLE 5. Conditional pattern library.
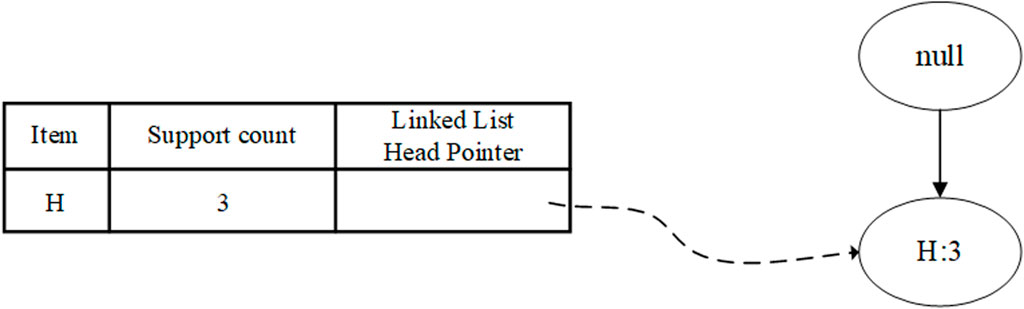
FIGURE 10. I’s condition FP-Tree.
FP-Tree is composed of a path. The combination mode of all nodes on the path is only {H:3}. After adding the conditional suffix I and outputting, all frequent patterns {H, I:3} with I as the suffix can be obtained, which is the association rule
3.3.2 Optimization of FP-growth algorithm based on weight
Electric vehicle charging faults are divided into levels. The national standard divides electric vehicle charging faults into three levels: personal safety level faults, equipment safety level faults, alarm prompt level faults (GB/T 27930, 2015), the higher the level of faults charging electric vehicles, the greater the impact of normal progress. In the actual working conditions of the equipment, the number of high-level faults is often very small, which will lead to the failure of the FP-Growth algorithm to mine fault association rules. If the minimum support is set too small, high-level faults may be missed. To solve this problem, this paper uses the idea of weighting to optimize the FP growth algorithm, comprehensively considering the weight of the characteristic data of fault correlation factors, which can increase the support of fault factors with large weight to a certain extent, avoid the omission of association rules, and reduce the support of fault factors with low weight. In this way, some useless feature data with high degree of occurrence may be deleted, so as to reduce the useless association rules mined by the algorithm.
Aiming at the shortcomings of the original FP-Growth algorithm, this paper uses the weighting idea to optimize the algorithm. With feature parameter data set
Define the discretized feature parameter type. All feature parameter types in the transaction item set I have a corresponding weight, and the weight set corresponding to I is
Each piece of feature data is composed of k-dimensional feature parameters, and the weight of each piece of feature data is defined as the average value of all parameter weights under that piece of data:
Define the weighted support degree of the characteristic parameter transaction item:
Define the weighted support of feature parameter data xn:
Define the weighted support of association rule
Define the weighted confidence of association rule
After defining the weighted support and weighted confidence, replace all support and confidence calculations with weighted support and weighted confidence in FP growth algorithm, so as to increase the support of fault correlation factor characteristic data with large weight to a certain extent and avoid the omission of association rules due to too small minimum support setting. At the same time, it can reduce the support of feature data with low weight, which may delete some feature data with high degree of occurrence but useless, so as to reduce the useless association rules mined by the algorithm.
4 Example analysis
4.1 Examples
This paper uses the Hadoop distributed computing platform as the basic platform of this experiment to build an experimental environment for the correlation analysis of electric vehicle charging failures. Hadoop is a distributed system infrastructure, which is currently widely used in various academic research and industrial applications (Ragaventhiran and Kavithadevi, 2020). Its core components are the Hadoop Distributed File System (HDFS) and the MapReduce engine. Using the operating data provided by a company in Nanjing, Jiangsu Province when the charging of electric vehicles failed, the characteristic data was extracted and processed to obtain characteristic data that can reflect the factors related to the failure of the power battery and the charging equipment.
This experiment uses three computers to form a cluster to build a three-node distributed computing environment. One of the master nodes is used as the name node, the NameNode is responsible for cluster scheduling and data storage and calculation, and the two slave nodes are used as the data nodes, and the DataNode is responsible for data storage. And computing, the cluster structure is shown in Figure 11.
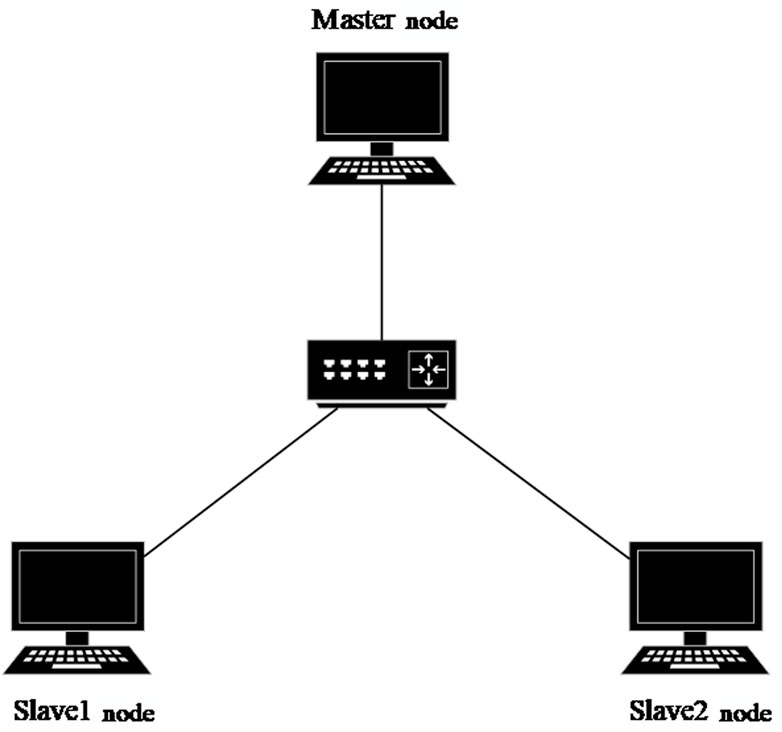
FIGURE 11. Cluster structure diagram.
4.1.1 Fault association rules and correlation analysis
The weighted optimized FP growth algorithm is applied to mine association rules for the characteristic data of power battery fault correlation factors of electric vehicles. The minimum weighted support is set to
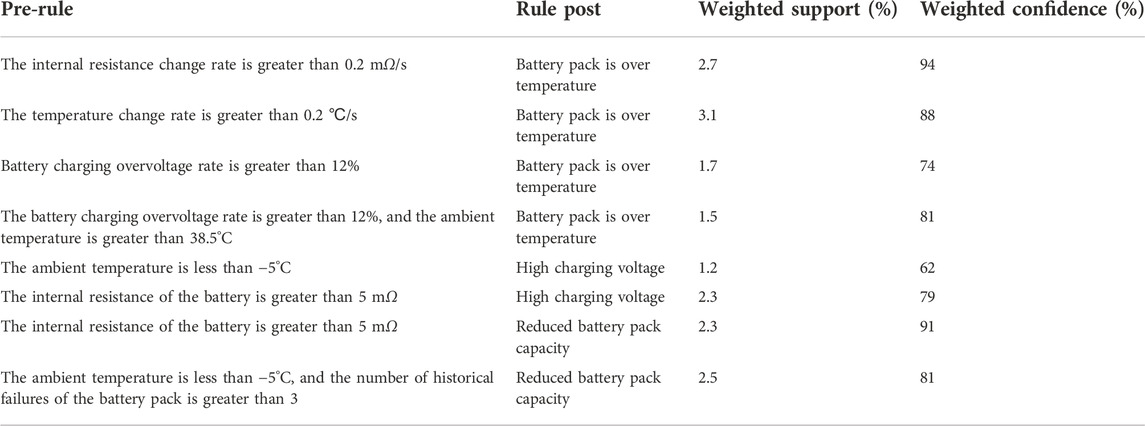
TABLE 6. Power battery failure association rules.
Table 6 shows some strong association rules based on power battery charging fault data mining. They describe the relationship between power battery fault related factors and fault forms. For example, the first association rule indicates that when the internal resistance conversion rate of the battery is greater than 0.2
These association rules are only a small part of the mining results. All the association rules obtained are counted, and the temperature change rate in the battery, the ambient temperature, the battery charging overvoltage rate, the battery charging overcurrent rate, and the battery internal resistance, battery internal resistance change rate, battery state of charge SOC, battery pack failure history related to the average level of confidence in association rules to evaluate the correlation level of factors and failures. The results are shown in Table 7, and the radar chart of the correlation level is shown in Figure 12.
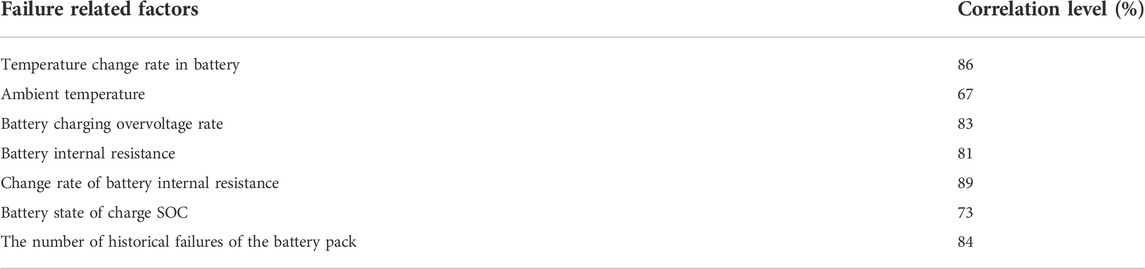
TABLE 7. Correlation level of power battery failure factors.
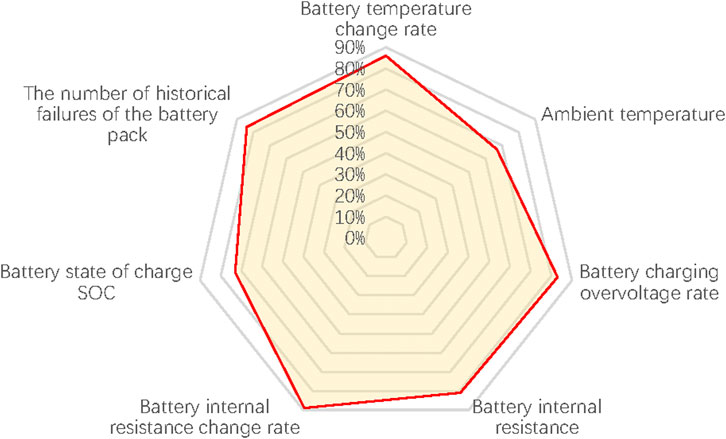
FIGURE 12. Correlation level of power battery failure factors.
The weighted optimized FP growth algorithm is applied to mine the association rules of the characteristic data of DC charger fault correlation factors, and the minimum weighted support is set to
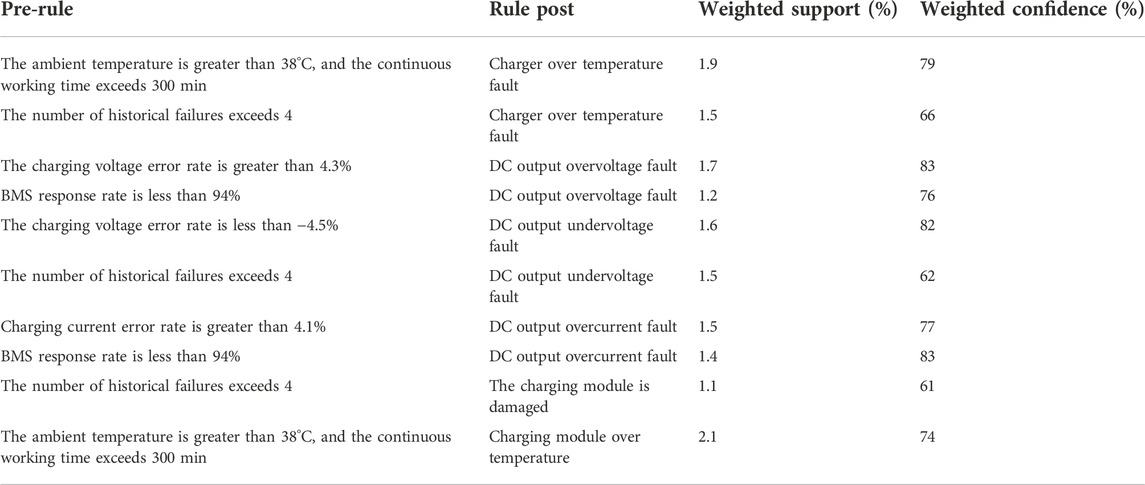
TABLE 8. DC charger fault association rules.
Table 8 shows some strong association rules based on DC charger charging fault data mining, which describe the association relationship between DC charger fault correlation factors and fault forms. For example, the first association rule indicates that when the ambient temperature is greater than 38 °C and the continuous working time of the charging pile exceeds 300 min, 79% may lead to the over temperature fault of the charger. The second association rule indicates that when the number of historical faults exceeds 4, 66% may lead to over temperature fault of charger, and so on.
All the obtained association rules are counted, and the correlation level between factors and faults is evaluated by calculating the average confidence level of association rules related to DC charger fault related factors, such as charging voltage error rate, charging current error rate, ambient temperature, charger and BMS response rate, charger continuous working time and charger historical fault times. The results are shown in Table 9, and the correlation level values are drawn into the radar diagram, as shown in Figure 13.
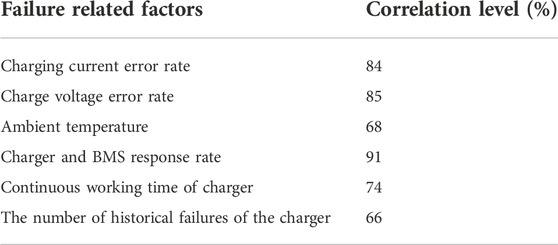
TABLE 9. Correlation level of DC charger failure factors.
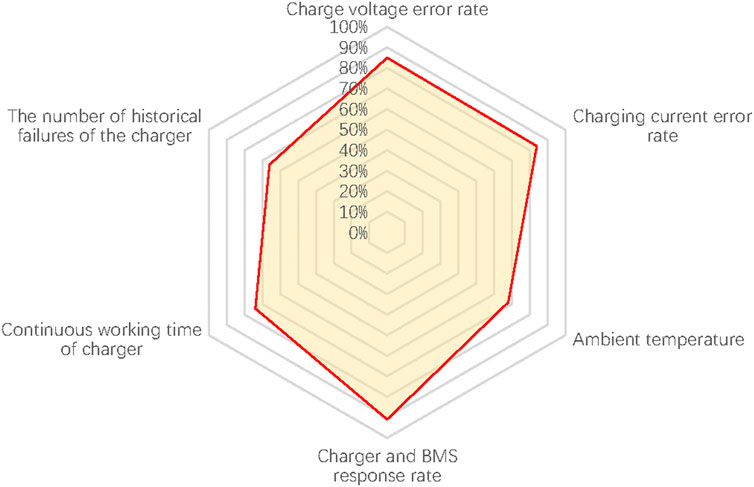
FIGURE 13. Correlation level of DC charger failure factors.
In order to verify the optimization effect of the proposed weighted FP-Growth algorithm, this paper conducts experiments on both the optimized FP-Growth algorithm and the original FP-Growth algorithm.
Figure 14 shows the changes in the running time of the original FP-Growth algorithm and the optimized FP-Growth algorithm under different minimum support degrees. It can be seen that when the minimum support setting is small, the running time of the algorithm is relatively long due to the large number of transactions that need to be calculated. With the increase of the minimum support degree, the running time of the two algorithms is decreasing. However, when the minimum support is the same, the weighted optimized FP-Growth algorithm has a significant computational time advantage compared to the original FP-Growth algorithm, which shows that the weighted optimized FP-Growth algorithm improves the efficiency of association rule mining.
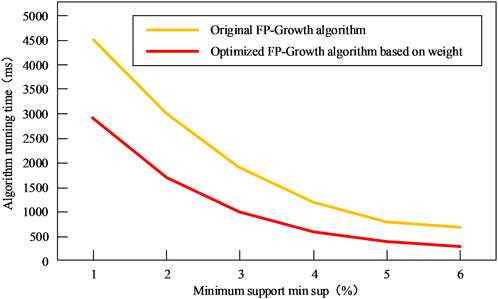
FIGURE 14. Variation of algorithm running time with minimum support.
Figure 15 shows the changes in the number of association rules mined by the original FP-Growth algorithm and the optimized FP-Growth algorithm under different minimum support degrees. It can be seen that when the minimum support setting is small, the number of association rules mined by the algorithm is relatively large, and there may be more invalid rules and duplicate rules among them. As the minimum support increases, the number of association rules mined by the two algorithms is decreasing. However, when the minimum support is the same, the number of association rules mined by the weighted optimized FP-Growth algorithm is significantly smaller than that of the original FP-Growth algorithm, which shows that the weighted optimized FP-Growth algorithm has achieved the expected reduction. The support of feature data with lower weight can reduce the useless association rules mined by the algorithm and avoid the omission of association rules due to the too small minimum support setting.
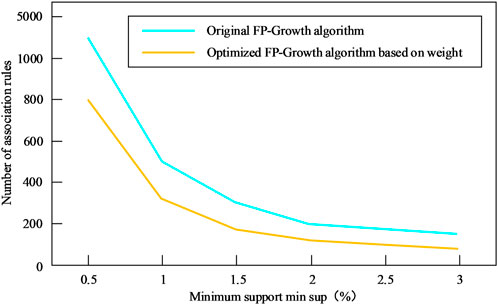
FIGURE 15. The number of association rules changes with the minimum support.
5 Conclusion
Aiming at the problems that the failure forms of power battery and charging and discharging equipment involved in the charging process of electric vehicles are diverse, and the failure mechanism load is difficult to analyze and diagnose, this paper analyzes and summarizes the common failure forms and failure mechanisms of power battery and charging equipment based on the working principle and failure mechanism of power battery and charging equipment, The correlation factors that may affect the failure of EV charging are analyzed at the two levels of EV power battery and charging equipment, and the characteristic parameters that can reflect the failure correlation of EV power battery and charging equipment are extracted. Discretize the characteristic parameter data of the K-means clustering algorithm, and then use the weight-based optimized FP-growth algorithm to mine the association rules of the discretized data, and obtain the fault association rules for the charging process of electric vehicles. The association rule analysis obtains the correlation level of the correlation factor to the failure, which provides certain technical support for realizing the intelligent diagnosis of the charging process of electric vehicles.
Data availability statement
The original contributions presented in the study are included in the article/Supplementary Material, further inquiries can be directed to the corresponding author.
Author contributions
Conceptualization, BZ; methodology, BZ; software, XH; validation, LC and TX; formal analysis, BZ; resources, BZ; data curation, XH; writing—original draft preparation, BZ and MH; writing—review and editing, BZ; supervision, LC and TX.; project administration, BZ; funding acquisition, BZ, MH, and XH. All authors have read and agreed to the published version of the manuscript. All authors have read and agreed to the published version of the manuscript.
Funding
This research was funded by the State Grid Chongqing Electric Power Company Technology Project, grant number 5220002000C1.
Conflict of interest
BZ, XH, MH, LC, and TX were employed by State Grid Chongqing Electric Power Company Marketing Service Center Metrology Center.
The authors declare that this study received funding from the State Grid Chongqing Electric Power Company Technology Project. The funder had the following involvement in the study: collection, analysis, the study design.
Publisher’s note
All claims expressed in this article are solely those of the authors and do not necessarily represent those of their affiliated organizations, or those of the publisher, the editors and the reviewers. Any product that may be evaluated in this article, or claim that may be made by its manufacturer, is not guaranteed or endorsed by the publisher.
Abbreviations
References
Chang, B., Li, Y. E., and Ma, Z. Y. (2020). Study on the heat generation characteristics of ternary lithium-ion power battery. Power Technol. 44 (12), 1729–1731+1739. doi:10.3969/j.issn.1002-087X.2020.12.005
GB/T 27930 (2015). The communication protocol between the electric vehicle off-board conductive charger and the battery management system.
Guo, H. (2020). Research on fast charging method of lithium battery of electric vehicle. Intern. Combust. Engine Accessories 13, 212–213. doi:10.3969/j.issn.1674-957X.2020.13.098
Hämäläinen., W. (2016). New upper bounds for tight and fast approximation of Fisher’s exact test in dependency rule mining. Comput. Statistics Data Analysis 93, 469–482. doi:10.1016/j.csda.2015.08.002
Hu, J., Yi, L. Q., and Li, Z. (2017). Fault diagnosis method of power transmission and transformation equipment based on big data mining technology. High. Volt. Technol. 43 (11), 3690–3697. doi:10.13336/j.1003-6520.hve.20171031026
IEC 62196-1-2014 (2014). Plugs, electrical sockets, vehicle connectors and vehicle lead-in wires. Conductive charging of electric vehicles. China: Part 1 General requirements.
Li, C. J. (2015). Research on intelligent evaluation method of lithium-ion battery health. Nanjing: Nanjing University of Aeronautics and Astronautics. MS thesis.
Ma, Y. Y. (2020). Li-ion battery system fault diagnosis and software development. Beijing: Beijing Jiaotong University. MS thesis.
Meng, J. Z. (2018). State detection and fault diagnosis technology of intelligent charging device for electric vehicle. Heifei: Hefei University of Technology. MS thesis.
Nalini, C. (2016). Correlation associative rule induction algorithm using ACO. Circuits Syst. 7 (10), 2857–2864. doi:10.4236/cs.2016.710244
NB/T 33001-2010 (2010). Technical requirements for off-board conductive chargers for electric vehicles.
Peng, G., Tang, S. P., and Zeng, L. (2019). Research on association rules of power grid faults based on data mining. Comput. Digital Eng. 47 (9), 2369–2374.
Qiu, Y. (2020). Research on the correlation of EMU fault warning based on data mining. Beijing: Beijing Jiaotong University. MS thesis.
Ragaventhiran, J., and Kavithadevi, M. K. (2020). Map-optimize-reduce CAN tree assisted FP-growth algorithm for clusters based FP mining on Hadoop. Future Gener. Comput. Syst. 103, 111–122. doi:10.1016/j.future.2019.09.041
Rayward-Smith, V. J. (2007). Statistics to measure correlation for data mining applications. Comput. statistics data analysis 51 (8), 3968–3982. doi:10.1016/j.csda.2006.05.025
Ru, Y., Yin, Z., and Zhang, K. (2017). Quantitative assessment of electric safety protection for electric vehicle charging equipment. J. Electr. Eng. 12 (10), 25–30.
Tan, M. X. (2020). Study on electrochemical and thermal characteristics of lithium iron phosphate battery during charge and discharge. Guangzhou: South China University of Technology. MS thesis.
Tang, Y., and Cao, Z. P. (2020). Explore new energy vehicles and motor drive control technology. Electron. World 10 (20), 200–201.
Wang, W. J. (2020). Research on fault diagnosis technology of monitoring equipment based on FP-growth algorithm. Electron. Test. 22 (2).
Wu, C. (2019). Research on typical failure mechanism and diagnosis method of lithium iron phosphate power battery. Harbin: Harbin Institute of Technology. PhD thesis.
Wu, Y. W. (2020). Fault monitoring and diagnosis of power battery of electric vehicle. Zhejiang Institute of Technology. MS thesis.
Yu, C. (2020). Research on comprehensive evaluation method of health state of electric vehicle charging pile. Harbin: Harbin University of Science and Technology. MS thesis.
Zeng, W., Li, Q., and Zhang, Y. F. (2019). UAV flight fault diagnosis based on improved FP-Growth algorithm. Technol. Innovation Appl. 13, 16–19.
Zhang, X. C., Tang, Y., Liu, Q., Liu, G. F., Ning, X., and Chen, J. K. (2021). a fault analysis method based on association rule mining for distribution terminal unit. Appl. Sci. 11 (11), 5221–3982. doi:10.3390/app11115221
Zhang, Y. L., Yu, W., Zhu, Q. Q., Ma, X., and Ogura, H. (2020). ECLAT algorithm for frequent item set generation with association rule mining algorithm. Int. J. Sci. Res. Comput. Sci. Eng. Inf. Technol. 11 (21), 306–309. doi:10.32628/cseit206247
Zhao, G. C., and Su, J. Y. (2021). Research on association rules of aircraft system faults based on data mining. J. Civ. Aviat. Flight Univ. China 32 (2), 10–14.
Zhao, X. H., and Jiang, Y. X. (2020). PNN and BP neural network fault diagnosis research on electronic accelerator pedal detection. Recent Pat. Eng. 14 (2), 205–220. doi:10.2174/1872212113666190911124334
Keywords: association rules, charging equipment, renewable energy, data mining, electric car, fault correlation
Citation: Zhu B, Hu X, He M, Chi L and Xu T (2023) Research on data mining model of fault operation and maintenance based on electric vehicle charging behavior. Front. Energy Res. 10:1044379. doi: 10.3389/fenrg.2022.1044379
Received: 14 September 2022; Accepted: 31 October 2022;
Published: 16 January 2023.
Edited by:
Yingjun Wu, Hohai University, ChinaReviewed by:
Srete Nikolovski, Josip Juraj Strossmayer University of Osijek, CroatiaHaowei Yao, Zhengzhou University of Light Industry, China
Copyright © 2023 Zhu, Hu, He, Chi and Xu. This is an open-access article distributed under the terms of the Creative Commons Attribution License (CC BY). The use, distribution or reproduction in other forums is permitted, provided the original author(s) and the copyright owner(s) are credited and that the original publication in this journal is cited, in accordance with accepted academic practice. No use, distribution or reproduction is permitted which does not comply with these terms.
*Correspondence: Bin Zhu, c2hlZXAxMDU1QDE2My5jb20=