 Jia Han
 Zhiyong Yu1
- 1Department of Computer, Rocket Force University of Engineering, Xi’an, Shaanxi, China
- 2Department of Engineering, Rocket Force University of Engineering, Xi’an, Shaanxi, China
Wireless Internet of Things (IoT) is widely accepted in data collection and transmission of power system, with the prerequisite that the base station of wireless IoT be compatible with a variety of digital modulation types to meet data transmission requirements of terminals with different modulation modes. As a key technology in wireless IoT communication, Automatic Modulation Classification (AMC) manages resource shortage and improves spectrum utilization efficiency. And for better accuracy and efficiency in the classification of wireless signal modulation, Deep learning (DL) is frequently exploited. It is found in real cases that the signal-to-noise ratio (SNR) of wireless signals received by base station remains low due to complex electromagnetic interference from power equipment, increasing difficulties for accurate AMC. Therefore, inspired by attention mechanism of multi-layer perceptron (MLP), AMC-MLP is introduced herein as a novel AMC method for low SNR signals. Firstly, the sampled I/Q data is converted to constellation diagram, smoothed pseudo Wigner-Ville distribution (SPWVD), and contour diagram of the spectral correlation function (SCF). Secondly, convolution auto-encoder (Conv-AE) is used to denoise and extract image feature vectors. Finally, MLP is employed to fuse multimodal features to classify signals. AMC-MLP model utilizes the characterization advantages of feature images in different modulation modes and boosts the classification accuracy of low SNR signals. Results of simulations on RadioML 2016.10A public dataset prove as well that AMC-MLP provides significantly better classification accuracy of signals in low SNR range than that of other latest deep-learning AMC methods.
Introduction
AMC refers to the automatic and fast classification of unknown signal modulation types by algorithms. AMC has been widely used in military and civil wireless communications, which can efficiently manage spectrum resources. In the power wireless Internet of Things (IoT), there are many types of wireless communication terminals, diverse modulation methods, and complex electromagnetic environment of wireless channels, which render AMC operation extremely difficult. AMC algorithm can not only be compatible with a variety of wireless communication terminals, but also reduce the price of the system (Abdel-Moneim et al., 2021). Traditional AMC methods can be sorted into two categories, namely likelihood based (LB) and feature based (FB) methods. As the name implies, LB algorithm is based on likelihood, where different types of likelihood functions are used to improve the classification accuracy. There are four common likelihood functions: maximum likelihood (ML) (Wen and Mendel, 2000), average likelihood ratio test (ALRT) (Huan and Polydoros, 1995; Hong and Ho, 2003), generalized likelihood ratio test (GLRT) (Panagiotou et al., 2000) and hybrid likelihood ratio test (HLRT) (Hong et al., 2001). Due to the high space complexity and time complexity of LB algorithm in condition of too many modulation types and unknown parameters, the classification accuracy is low when faced with the new modulation mode, which cannot meet the requirements. Many researchers are committed to the research of FB algorithm: Nandi and Azzouz (1998) and Shen and Gao (2014) proposed spectrum as the main classification feature, but the classification accuracy drops sharply when it comes to intra class modulation; Orlic and Dukic (2009), Mirarab and Sobhani (2007) proposed a method to classify signals based on statistical distribution features. However, there are also problems such as computational complexity and dependence on prior knowledge, and only a few modulation types with obvious features can be identified; Yu et al. (2003), Zhou et al. (2017), and Satija et al. (2015) proposed a method to classify using signal transformation domain features, which has better classification accuracy at high SNR and lower classification accuracy at low SNR; Mobasseri (2000) proposed to use the constellation diagram for classification, which achieved good results under high SNR, but failed to classify new modulation methods. To sum up, the traditional AMC classification method cannot to meet the classification task of new modulation methods, and encounters a problem of excessive space-time consumption.
With the development of artificial intelligence technology, DL has been used in data processing and analysis, and is being applied in the field of AMC. In recent years, DL has been widely used to solve AMC problems. Convolutional neural network (CNN) was first used to directly perform AMC on I/Q raw data. Experiments show that its performance is significantly much better than the classification method based on cyclic spectral features (O'Shea et al., 2016). Long-Short Term Memory (LSTM) neural networks are used to establish the characteristics of the relationship between amplitude and phase of sequential I/Q data. When using a fully connected network for classification, the average classification accuracy of the proposed model is close to 90% under various SNR of 0–20 dB, and good experimental results have been obtained (Rajendran et al., 2018). Some researchers proposed to use the SCF to generate two-dimensional profiles of modulated signals, and then use CNN network for classification, which also achieved good classification results under low SNR (Zhang et al., 2021). Hou et al. (2021) transformed one-dimensional I/Q signals into SPWVD, and then used CNN to extract features for AMC, which also achieved good classification accuracy. Qiao et al. (2022) aimed to solve the problem of low classification accuracy with low SNR. A denoizing and a classification network were used for synchronous learning, which effectively improved the classification accuracy and performed better than the existing classification methods. In the 0 dB SNR environment, the proposed multi-task CNN method outperforms the traditional CNN method by 20%. Ke and Vikalo (2022) designed a learning framework for LSTM denoising encoder, which can automatically extract stable robustness features from noisy signals according to amplitude and phase, and use the learned robustness features for modulation classification. This model is structurally compact, easy to implement on low-cost embedded platforms, and can effectively classify received wireless signals. Mao et al. (2021) designed a multi constellation AMC framework, used CNN network to extract deep features, weighted the attention of feature vectors, and finally implemented AMC, which achieved good classification results on the open dataset. Xu and Darwazeh (2020) used Software Defined Radio (SDR) to test the real environment and evaluate various performances, providing specific test contents. Although DL method can quickly and accurately classify modulation modes under high SNR, due to the existence of electromagnetic interference of power equipment, he low SNR of wireless channel results in the low classification accuracy of DL method. The existing digital modulation modes cannot be classified accurately using I/Q data or using a single features map. It is necessary to study a DL model that can resist noise and intra class modulation methods.
In recent years, self-attention mechanism has gradually shifted from natural language processing to computer vision. Vaswani et al. (2017) used the self-attention mechanism under the transformer architecture to process natural language sequences in parallel, significantly improving the processing speed and accuracy, and obtained good experimental results. Dosovitskiy et al. (2020) introduced the self-attention mechanism into the field of computer vision and achieved excellent performance on several benchmark datasets, such as ImageNet, COCO and ADE20k. Compared with the traditional CNN algorithm, self-attention can establish the global relationship, which is different from the local relationship established by CNN, and it has a great improvement in visual application. Liu et al. (2021) and Tolstikhin et al. (2021), likewise achieved good classification accuracy on public datasets using MLP, proving that in addition to the transformer, MLP also efficiently achieves image data classification tasks. The AMC is qualified to classify signals in different spaces such as space-time features, statistical features and time-frequency features and unsuitable to classify existing modulated signals with a single feature. Therefore, it is necessary to extract and fuse features of multi-dimensional spatial information, and further use DNN using self-attention mechanism for AMC.
In the face of strong electromagnetic interference, in order to improve the classification accuracy and robustness of AMC algorithm, the modulated signal is characterized in multimodal in this paper, which avoids the lack of representation ability of a single feature. The modulated signal is characterized from the space-time characteristics, time-frequency characteristics and statistical characteristics respectively. Therefore, the constellation diagram, SPWVD and contour diagram of the SCF are used to represent the modulation characteristics of the signal. Constellation diagram can be used to classify the modulated signal in the space-time domain. SPWVD can classify modulation types in time-frequency domain. The SCF reflects the statistical characteristics of the signal and is insensitive to interference. It has good noise resistance and can keep the classification effect in the low SNR range. To reduce the computational complexity, we use the contour diagram of the SCF, and we use the above three images in the production of the dataset.
Unlike the existing research, most DL modulation classification schemes mainly select the characteristics of a single as the input of the network or optimize the network structure for high-dimensional mapping to improve modulation recognition performance, ignoring the complementarity between features in different transformation domains and different classifiers. Unlike the existing research, instead of inputting the signal into the classifier, we preprocess the data, including dataset construction of three feature diagram, image synchronization denoising using Conv-AE, feature vector extraction, construct global relationship construction using self-attention, implement AMC after multimodal feature fusion and verify the classification accuracy.
In summary, the main contributions of this study are as follows:
1. In the space-time domain, time-frequency domain and statistical domain, use the multi-modal characteristics of the constellation diagram, SPWVD and contour diagram of SCF as the network input.
2. The design uses Conv-AE for synchronous denoising and low dimensional feature extraction of feature maps, which is helpful to improve the robustness of the model and simplify the model parameters, thus simplifying the MLP model, accelerating the model training and reasoning.
3. Use multimodal feature fusion method, use the complementarities between feature maps, enhance the communication between different transform domains, improve the feature expression ability. Use MLP of self-attention mechanism for classification
4. Study the classification accuracy changes of different types of modulated signals in different additive white Gaussian noise (AWGN) channels and compared with the reference method.
The rest of this paper is organized as follows. This paper proposes a multimodal modulation classification modal based on MLP self-attention mechanism, which is composed of constellation diagram, SPWVD, SCF contour diagram data generation module, Conv-AE feature denoising and extraction module, and MLP self-attention classification module. We provide the architecture model of the system, and then complete the algorithm analysis and dataset generation of constellation diagram, SPWVD and SCF contour diagram, is presented in detail in Section 2. Then, in Section 3, we analyze the experimental process, simulation test and result analysis to prove the effectiveness of our algorithm and its superiority over the benchmark algorithm. Finally, a brief conclusion is given in Section 4.
Materials and methods
In this section, we introduce the proposed AMC system design, including the feature map generation module, the feature extraction module based on Conv-AE, and the classifier structure of MLP attention. The data set from RadioML 2016.10A (O’Shea and West, 2016) is used in our experiment to generate feature maps.
System model
The proposed AMC model, shown in Figure 1, classifies the modulation types of the Conv-AE eigenvectors of the constellation diagram, SPWVD, and the contour diagram of SCF. To reduce the noise influence and accurately distinguish intra-and inter-class modulation modes, we first sampled the unknown signal, and then generated the constellation diagram, SPWVD, and the contour diagram of the SCF, respectively. The purpose of this method is to improve the representation of signal in different fields and resist the influence of channel noise. Subsequently, CNN is used to extract the feature vectors of the three feature maps, after which the feature vectors are input into the MLP network of the self-attention mechanism for classification. The following four modulation types are most commonly used in digital communication: the binary phase-shift keying (BPSK), binary frequency-shift keying, Gauss frequency-shift keying (GFSK), quadrature phase-shift keying (QPSK), and 16 quadrature amplitude modulation (16QAM).
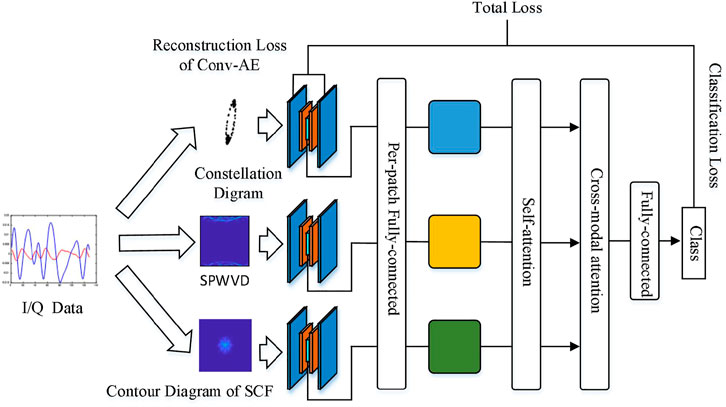
FIGURE 1. Schematic diagram of AMC system. Generation of three different feature maps was completed using the original baseband I/Q data. Conv-AE was used for feature extraction, and the modulated signal classification at different SNR was completed using multimodal attention.
Constellation diagram
Generally, the received signal is expressed as Eq. 1.
The constellation diagram is a 2-D image representation of scatterers drawn from baseband I/Q sampled data in the I/Q coordinate system. The generated image is shown in Figure 2. It is often used for modulation signal classification, as it can efficiently characterize the modulation type and data order. There is a good mapping relationship between the constellation diagram and modulation type, especially at classification accuracy. When the SNR is high, the modulation types are efficiently classified; however, due to interference of noise in the channel, it is difficult to identify high-order modulation signals at low SNR. Therefore, the modulation classification method using the constellation diagram is a difficult task in low SNR environments.
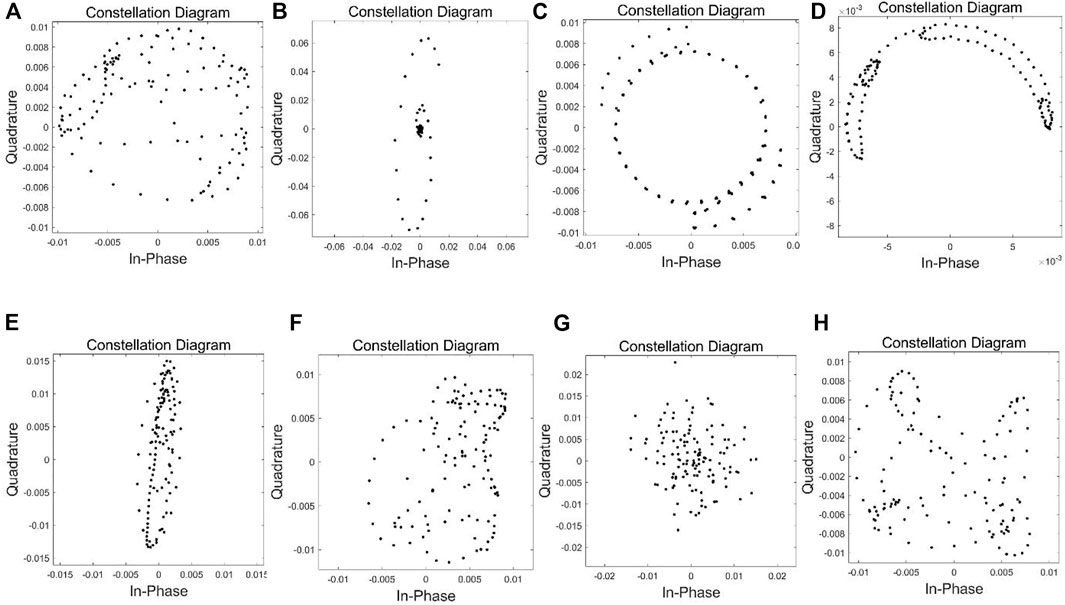
FIGURE 2. Constellation diagrams of modulated signals at SNR = 18 dB in RadioML 2016.10A dataset. (A) 8PSK, (B) BPSK, (C) CPFSK, (D) GFSK, (E) PAM4, (F) QAM16, (G) QAM64, (H) QPSK.
SPWVD
For the modulated signal
where
To suppress the influence of cross terms, the pseudo Wigner–Ville distribution (PWVD) is obtained by time-domain windowing based on WVD. The windowed method not only retains the excellent performance (better resolution) of the original algorithm WVD but also eliminates some cross-term interference.
SPWVD a one-time windowing process in the frequency domain based on PWVD, and its definition is given by Eq. 5.
Herein,
where
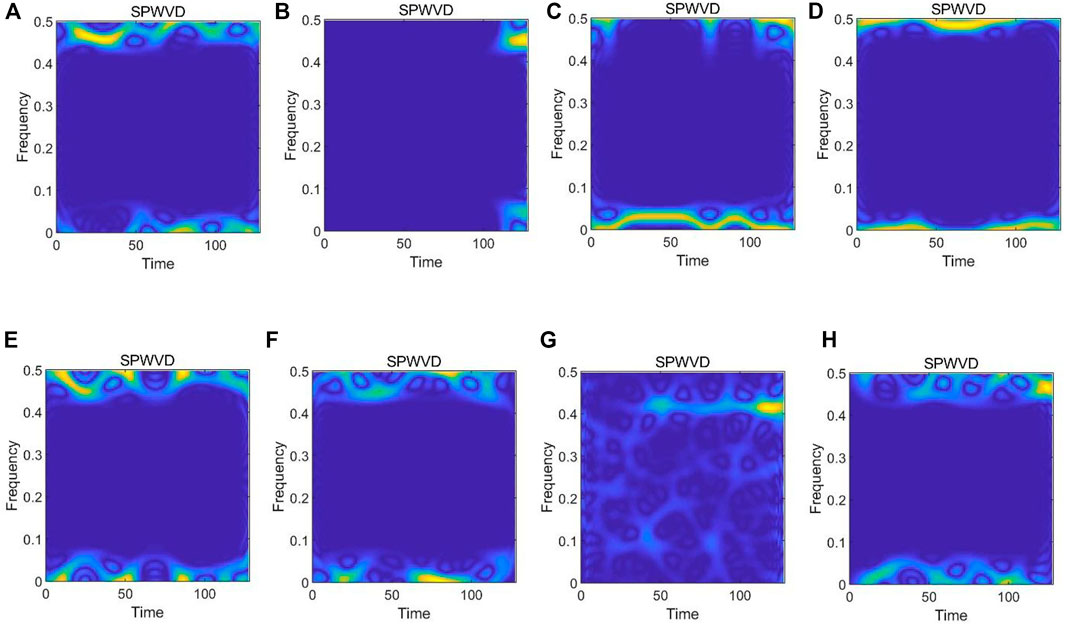
FIGURE 3. Smoothed pseudo Wigner–Ville distribution of modulated signals at SNR = 18 dB in RadioML 2016.10A dataset. (A) 8PSK, (B) BPSK, (C) CPFSK, (D) GFSK, (E) PAM4, (F) QAM16, (G) QAM64, (H) QPSK.
Contour diagram of spectral correlation function
Because the autocorrelation function
where
where α is the cycle frequency. When α = 0,
where
Eq. 10 shows that the cyclic spectral density value at a frequency
The FFT accumulation method (FAM) employed by Roberts et al. (1991) is used, where the discrete smoothed cycle period plot in the time domain is expressed as Eq. 12.
In Eq. 12,
where
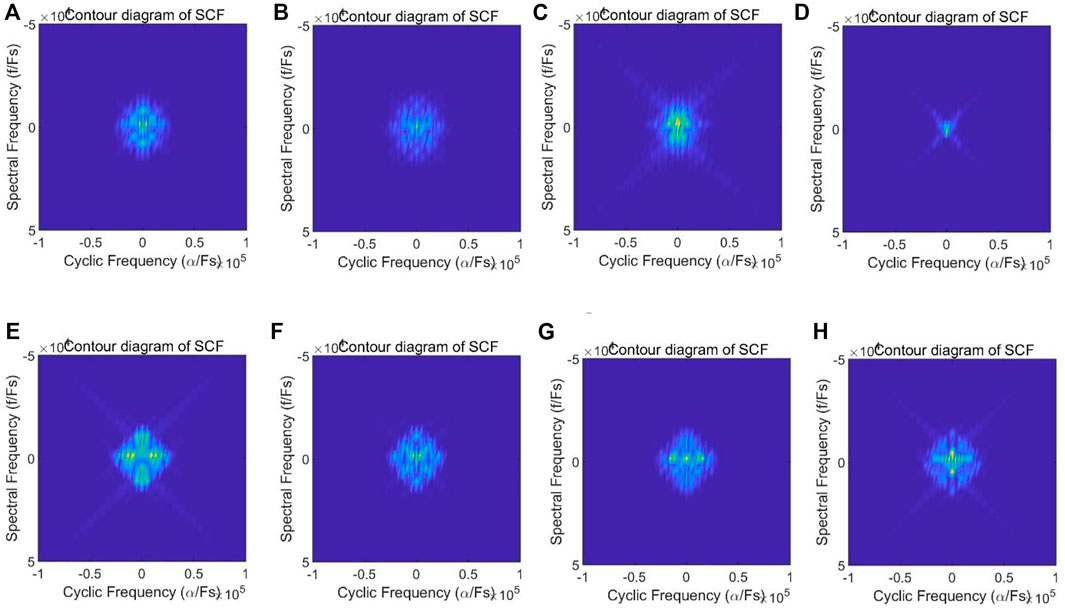
FIGURE 4. Contour diagram of spectral correlation function of modulated signals at SNR = 18 dB in RadioML 2016.10A dataset. (A) 8PSK, (B) BPSK, (C) CPFSK, (D) GFSK, (E) PAM4, (F) QAM16, (G) QAM64, (H) QPSK.
Conv-AE
To obtain the low-dimensional features of different feature maps under various modulation modes, we use a multi-layer Conv-AE, including a learnable convolution kernel and activation function, to extract the low-dimensional features of images. The structure of Conv-AE is summarized in Table 1.
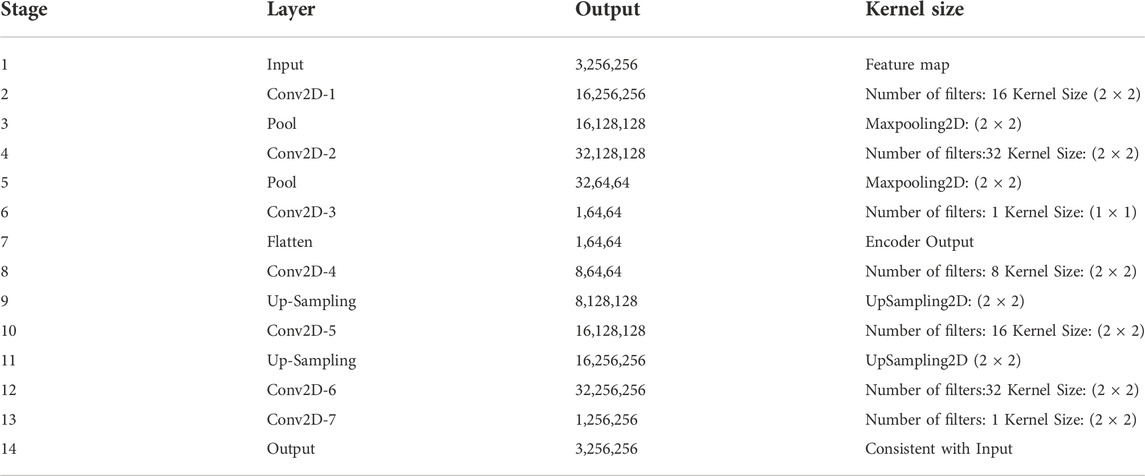
TABLE 1. Configuration of Conv-AE.
For three different feature maps, the same Conv-AE is used for feature extraction. First, the feature map is input and the convolution kernel is used to extract the features. Maximum pooling is used to extract the evident features. After multiple convolution and pooling operations, the feature vectors are obtained. During the entire training process, the input image and the reconstruction loss are calculated.
MLP classifier
To ensure the accuracy of the AMC method, we use the self-attention mechanism in the model, the main idea of which was derived by Liu et al. (2021). We improve the previous single feature classification method and use the attention mechanism to enhance the interaction of features between modules. In the subsequent experimental process, MLP is compared with the traditional methods. Vaswani et al. (2017) reported that the self-attention mechanism is good at capturing the direct relationship of long-distance features in the process of natural language processing, which is different from the CNN method for capturing local features. The self-attention mechanism takes the
Multi-head Self-attention
Multi-head Self-attention
Multi-head Self-attention
The common multi-head self-attention mechanism in the transformer allows the model to represent relationship information between subspaces of different locations. In the self-attention mechanism, the Query, Key, and Value are generated according to different patches. The self-attention mechanism can learn the interaction between itself and other parts, and predict the correlation between the input and output. This feature can be used for modulation classification. In the example used in this study, the feature vectors of the graph are respectively used as input to generate self-attention, including generating the Key, Query, and Value, after which the cross-attention mechanism (Tan and Bansal, 2019; Golovanevsky et al., 2022) is used to generate the relationship between the three feature graphs. Bi-directional, cross-modal attention can be performed in each multi-head attention module. Attention output between the three groups of feature maps is based on the attention layers that characterize the features, which can be manipulated as the following modules:
Concat (cross-attention
Concat (cross-attention
Concat (cross-attention
Finally, the full connection without attention mechanism of network connection is used to produce a dense layer of output. This method uses the attention mechanism to complete the most advanced algorithm of AMC in MLP, meets the requirements of multi-type, fast and accurate classification of wireless IoT base station, and has a very high practical significance for improving the communication capability in low SNR environment.
Loss function
The loss function of this model is mainly composed of two parts, namely, the reconstruction loss of Convolution-AE and the classification loss of MLP. The total loss of the algorithm is expressed as the weighted combination of two terms as follows:
where
In the above Eq. 16,
In the above Eq. 17,
Simulations and discussions
In this section, we test the performance of the model. We use the public dataset to construct the feature image dataset, and further conduct parameter adjustment and performance test of the algorithm to obtain the final test results. The model is further compared with the existing algorithms, and finally the experimental results are compared and analyzed.
Description of experimental dataset
We use the RadioML 2016.10A public dataset for model performance measurement. It includes 11 modulation types. The software defined radio is used for I/Q dual-channel sampling, and the length of a single data is 128. The SNR level of the signal ranges from –20 dB to 18 dB, where the step size is 2 dB, and there are 220,000 samples in total. The noise added by the channel is white Gaussian noise, and the specific data are shown in the following Table 2.
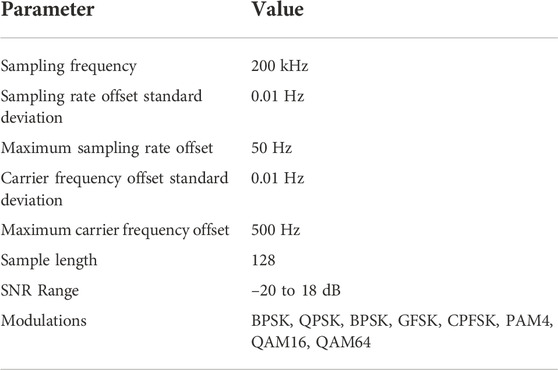
TABLE 2. Description of RadioML 2016.10A parameters.
Experimental procedure
First, the open dataset of RadioML 2016.10A is read, and eight kinds of digital signals are selected: 8BPSK, QPSK, BPSK, GFSK, CPFSK, PAM4, QAM16, and QAM64 were classified in different SNR environments. Contour diagrams were generated using the baseband data of I/Q, SPWVD, and the SCF, based on 20 different SNR samples, ranging from –20 dB to 18 dB, each with 128 samples length. Each signal has 1000 samples and a total of 160,000 I/Q sampling data. By generating three different feature maps, the total number of samples is 480,000. We use 70% of the samples as the training set, and the remaining samples as the test set. After the data set was made, three different feature maps were input into Conv-AE for feature extraction, and the three Conv-AE shared parameters. The optimal feature vector was found through the input and reconstructed loss function, and the following step was input into attention-MLP for classification. The classification loss was calculated, and the parameters were optimized by back propagation. The optimization of the whole model was achieved by the overall optimization of Conv-AE and attention-MLP. The dropout rate of the fully connected layer is set to 0.2, and the hyperparameter
Model testing
We used the RadioML 2016.10A dataset to compare and verify the algorithms mentioned in the reference ALRT (Hong and Ho, 2003), GLRT (Panagiotou et al., 2000), HLRT (Hong and Ho, 2003), CNN (O’Shea et al., 2016), MT-CNN (Qiao et al., 2022), SPWVD -CNN (Hou et al., 2021), LSTM-AE (Ke and Vikalo, 2022), LSTM (Rajendran et al., 2018) and SOTA (Zhang et al., 2021). The precision curves of various algorithms are shown in Figure 5.
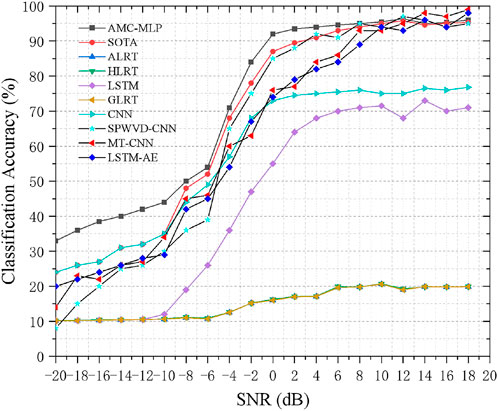
FIGURE 5. Classification accuracy of our proposed model vs existing models on RadioML 2016.10A dataset.
Figure 5 shows the modulation classification of several likelihood functions. Due to the uncertain calculation caused by too many unknown parameters and modulation types, GLRT, HLRT and ALRT, the three likelihood modulation classification methods, cannot perform good modulation classification even when 10 dB–18 dB. When the SNR ranges from –20 dB to 10 dB, the modulation classification can hardly be carried out. The LSTM modulation classification method, whose algorithm only focuses on the relationship between one-way data, cannot identify the features of high capture dimension, and the single feature faces difficulty to identify the spatial representation of the approximate modulation mode, especially when the SNR is less than –10 dB, showing almost no difference in the classification accuracy with the likelihood estimation method. Due to the innate local feature extraction, the CNN modulation classification method cannot extract global features. Compared with the LSTM method, it exhibits great improvement when SNR is –10 dB and below. Moreover, when SNR ranges from –10 dB to 2 dB, the classification accuracy is gradually improved with the increase in SNR. When SNR is more than 2 dB, the classification accuracy does not improve significantly.
The classification accuracy of MT-CNN and LSTM-AE has little difference within the SNR from –20 dB to 10 dB range, but LSTM-AE is more compact than MT-CNN’s model, with fewer parameters and lower computational complexity, which is conducive to deployment on low-cost platforms. The classification accuracy of SPWVD-CNN model has little difference with other models in the SNR from–20 dB to –4 dB range, but it is significantly higher than the MT-CNN model in the SNR from –4 dB to 18 dB range, but lower than AMC-MLP. The essential reason is that the representation ability of a single feature is insufficient.
The SOTA method uses a 2-D section graph of SCF for modulation and generation, and employs CNN for noise reduction. When deep neural networks is use for classification, it shows a considerably high classification accuracy. Especially when SNR is above –6 dB, the statistical characteristics of SCF itself show evident classification accuracy when fighting noise interference. After the CNN noise reduction, the features are extremely evident, and the overall energy absorption is relatively excellent. However, this also demonstrates the single use of features, which still has evident shortcomings at low SNR.
Conv-AE has strong data reconstruction and feature extraction abilities. We use the approximation between input and output to compare the reconstruction ability of AE, and use the middle low-dimensional feature vector to represent the features of the original image. The higher the approximation between input and output, the stronger the coding ability of AE. This experiment also showed that CNN in Conv-AE has a strong feature grabbing ability, which has a natural advantage compared with other AE.
This experiment also proves that MLP has the same capability as the transformer, which can not only be used for computer vision but also for radio frequency signal classification after optimization (Figure 5). This is because using the low-dimensional feature vectors extracted by AE as the input of MLP can significantly reduce the network scale, training time, and future inference time on the edge compared with directly using MLP. The setting of the loss rate of the fully connected layer further reduces the scale of the network and preliminarily realizes the compression of the network model.
Analysis of results
In this experiment, as Figure 6 shows, we compared with the latest AMC algorithm (Zhang et al., 2021) to study the overall classification accuracy variation trend of the model composed of Conv-AE and attention-MLP under the supervised condition of different SNR environments in the range of –20 dB–18 dB. AMC-MLP of the overall classification accuracy is higher than the existing classification method, especially in –20 dB–8 dB range, has obvious advantages, highlight the model of classification accuracy in low SNR environment. Through the classification confusion matrix of AMC-MLP under different SNR, the classification advantages of the new model can be clearly seen. In the SNR environment of 0 dB–18 dB, the AMC-MLP model can maintain good classification accuracy and robustness. In the SNR environment of –20 dB–0 dB, the classification accuracy of AMC-MLP model is greatly reduced by noise interference, but it has been greatly improved compared with SOTA model. The reason is that using the use of a variety of characteristics of attention ability greatly improve obviously against noise, better solve the complex electromagnetic environment in power energy system environment, AMC-MLP meets the requirements of fast and diverse modulation classification methods for base stations. It is very suitable for deployment on Xilinx Zynq UltraScale+™MPSoC. The multi-core architecture has significant advantages. The FPGA core uses a two-stage pipeline for baseband I/Q data sampling and feature map conversion. Then, the internal bus is used to transfer the low-dimensional feature data to Mali-400MP2 GPU for MLP acceleration, and the internal quad-core ARM is used to manage the model.
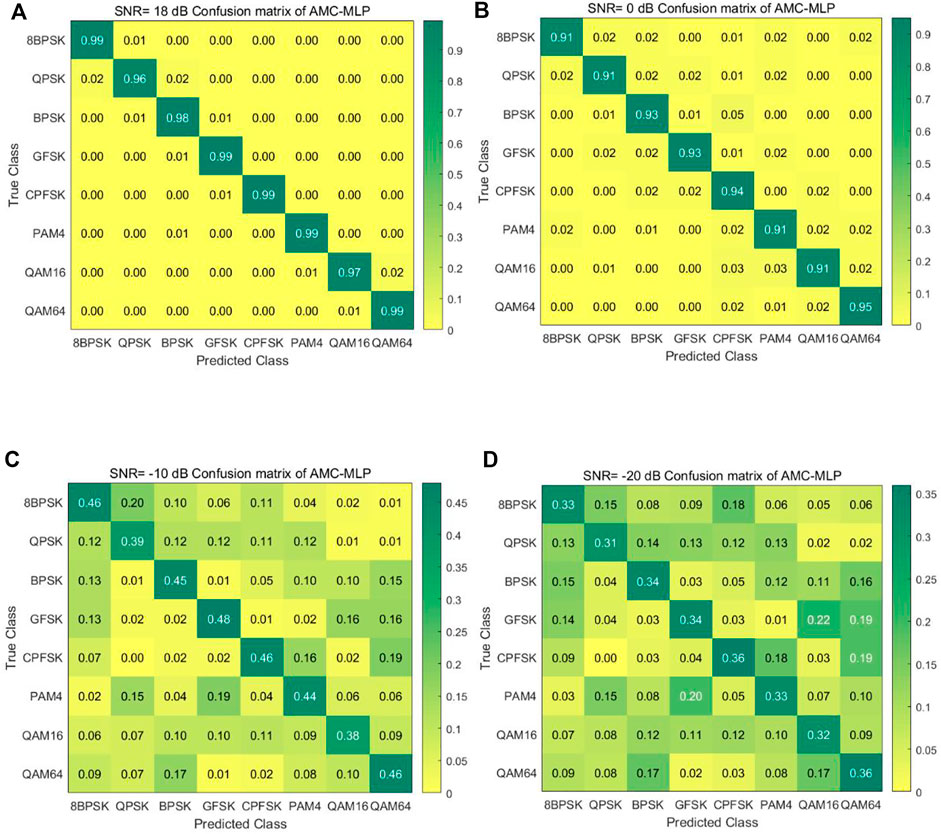
FIGURE 6. Accuracy confusion matrix of AMC-MLP algorithm with different SNR. (A) SNR = 18 dB, (B) SNR = 0 dB, (C) SNR = −10 dB, (D) SNR = −20 dB.
Conclusion and future work
We used the AMC method combining Conv-AE and attention-MLP. We employed Conv-AE for low-dimensional feature extraction of multi-feature maps and attention-MLP for AMC classification under attention. The method was verified by experiments and compared with the traditional AMC method. Under the condition of high SNR, AMC-MLP can not only obtain better classification performance, but also obtain higher classification accuracy under the condition of low SNR. The model has simple structure, few parameters, high robustness, and can maintain high classification accuracy and real-time performance when reasoning, which meets the requirements of power wireless Internet of things.
The following are suggestions for future researches. First, novel modulation type classification methods, such as orthogonal frequency division multiplexing, should be investigated to improve the generalization and robustness of the model. Second, hard and soft compute of resources in IoT systems are limited; hence, it is necessary to focus on lightweight and low-power classification methods used in IoT terminals. Finally, most existing algorithms are trained based on supervised learning, which requires a large amount of labeled data as the basis. Therefore, it is necessary to propose semi-supervised or few-shot samples modulation classification methods in AMC research.
Data availability statement
Publicly available datasets were analyzed in this study. This data can be found here: https://www.deepsig.ai/datasets.
Author contributions
JH completed the theoretical research, technical method design, experiment and analysis, and the writing and revision of the paper. ZY and JY conducted research guidance, technical method demonstration, and writing and review of the paper.
Funding
This project was supported by grants from the National Natural Science Foundation of China (62071481).
Acknowledgments
The authors would like to thank all of the people who participated in the studies.
Conflict of interest
The authors declare that the research was conducted in the absence of any commercial or financial relationships that could be construed as a potential conflict of interest.
Publisher’s note
All claims expressed in this article are solely those of the authors and do not necessarily represent those of their affiliated organizations, or those of the publisher, the editors and the reviewers. Any product that may be evaluated in this article, or claim that may be made by its manufacturer, is not guaranteed or endorsed by the publisher.
References
Abdel-Moneim, M. A., El-Shafai, W., Abdel-Salam, N., El-Rabaie, E. S. M., and El-Samie, F. E. A. (2021). A survey of traditional and advanced automatic modulation classification techniques, challenges, and some novel trends. Int. J. Commun. Syst. 34, e4762. doi:10.1002/dac.4762
Dosovitskiy, A., Beyer, L., Kolesnikov, A., Weissenborn, D., Zhai, X., Unterthiner, T., et al. (2020). An image is worth 16x16 words: Transformers for image recognition at scale. arXiv preprint arXiv:2010.11929.
Golovanevsky, M., Eickhoff, C., and Singh, R. (2022). Multimodal attention-based deep learning for alzheimer’s disease diagnosis. Priprint arXiv:220608826G.
Hong, L., and Ho, K. C. (2003). “Classification of BPSK and QPSK signals with unknown signal level using the Bayes technique,” in Proceedings of the 2003 IEEE International Symposium on Circuits and Systems (ISCAS), Bangkok, Thailand, 25-28 May, 2003, IV.
Hong, L., and Ho, K. C. (2001). “Modulation classification of BPSK and QPSK signals using a two element antenna array receiver,” in Proceedings of the 2001 MILCOM Proceedings Communications for Network-Centric Operations: Creating the Information Force (Cat. No.01CH37277), McLean, VA, USA, 28-31 Oct. 2001, 118–122.
Hou, C., Li, Y., Chen, X., and Zhang, J. (2021). Automatic modulation classification using KELM with joint features of CNN and LBP. Phys. Commun. 45, 101259. doi:10.1016/j.phycom.2020.101259
Huan, C. Y., and Polydoros, A. (1995). Likelihood methods for MPSK modulation classification. IEEE Trans. Commun. 43, 1493–1504. doi:10.1109/26.380199
Ke, Z., and Vikalo, H. (2022). Real-time radio technology and modulation classification via an LSTM auto-encoder. IEEE Trans. Wirel. Commun. 21, 370–382. doi:10.1109/twc.2021.3095855
Liu, H., Dai, Z., So, D. R., and Le, Q. V. (2021). Pay attention to MLPs. Priprint arXiv:2105.08050.
Mao, Y., Dong, Y. Y., Sun, T., Rao, X., and Dong, C. X. (2021). Attentive siamese networks for automatic modulation classification based on multitiming constellation diagrams. IEEE Trans. Neural Netw. Learn. Syst. 46, 1–15. doi:10.1109/TNNLS.2021.3132341
Mirarab, M. R., and Sobhani, M. A. (2007). “Robust modulation classification for PSK/QAM/ASK using higher-order cumulants,” in Proceedings of the 2007 6th International Conference on Information, Communications & Signal Processing, Singapore, 10-13 Dec. 2007, 1–4.
Mobasseri, B. G. (2000). Digital modulation classification using constellation shape. Signal Process. 80, 251–277. doi:10.1016/s0165-1684(99)00127-9
Nandi, A. K., and Azzouz, E. E. (1998). Algorithms for automatic modulation recognition of communication signals. IEEE Trans. Commun. 46, 431–436. doi:10.1109/26.664294
Orlic, V. D., and Dukic, M. L. (2009). Automatic modulation classification algorithm using higher-order cumulants under real-world channel conditions. IEEE Commun. Lett. 13, 917–919. doi:10.1109/LCOMM.2009.12.091711
O’Shea, T. J., Corgan, J., and Charles, C. T. (2016). Convolutional radio modulation classification networks. Priprint arXiv:1602.04105.
O’Shea, T. J., and West, N. (2016). Radio machine learning dataset generation with GNU radio. Proc. GNU Radio Conf. 1, 1–6.
Panagiotou, P., Anastasopoulos, A., and Polydoros, A. (2000). “Likelihood ratio tests for modulation classification,” in Proceedings of the MILCOM 2000 Proceedings. 21st Century Military Communications. Architectures and Technologies for Information Superiority (Cat. No.00CH37155), Los Angeles, CA, USA, 22-25 Oct. 2007, 670–674.
Qiao, J., Chen, W., Chen, J., and Ai, B. (2022). Blind modulation classification under uncertain noise conditions: A multitask learning approach. IEEE Commun. Lett. 26, 1027–1031. doi:10.1109/LCOMM.2022.3149284
Rajendran, S., Meert, W., Giustiniano, D., Lenders, V., and Pollin, S. (2018). Deep learning models for wireless signal classification with distributed low-cost spectrum sensors. IEEE Trans. Cogn. Commun. Netw. 4, 433–445. doi:10.1109/TCCN.2018.2835460
Roberts, R. S., Brown, W. A., and Loomis, H. H. (1991). Computationally efficient algorithms for cyclic spectral analysis. IEEE Signal Process. Mag. 8, 38–49. doi:10.1109/79.81008
Satija, U., Mohanty, M., and Ramkumar, B. (2015). “Automatic modulation classification using S-transform based features,” in Proceedings of the 2015 2nd International Conference on Signal Processing and Integrated Networks (SPIN), Noida, India, 19-20 Feb. 2015, 708–712.
Shen, W. G., and Gao, Q. X. (2014). “Automatic digital modulation recognition based on locality preserved projection,” in Proceedings of the 2014 International Conference on Wireless Communication and Sensor Network, Wuhan, China, 13-14 Dec. 2014, 348–352.
Tan, H., and Bansal, M. (2019). Lxmert: Learning cross modality encoder representations from transformers. Priprint arXiv:1908.07490.
Tolstikhin, I., Houlsby, N., Kolesnikov, A., Beyer, L., Zhai, X., Unterthiner, T., et al. (2021). MLP-Mixer: An all MLP architecture for vision. Priprint arXiv:2105.01601.
Vaswani, A., Shazeer, N., Parmar, N., Uszkoreit, J., Jones, L., Gomez, A. N., et al. (2017). Attention is all you need. Priprint arXiv:1706.03762.
Wen, W., and Mendel, J. M. (2000). Maximum-likelihood classification for digital amplitude-phase modulations. IEEE Trans. Commun. 48, 189–193. doi:10.1109/26.823550
Xu, T., and Darwazeh, I. (2020). “Deep learning for over the air NonOrthogonal signal classification,” in Proceedings of the 2020 IEEE 91st Vehicular Technology Conference, Antwerp, Belgium, 25-28 May 2020, 1–5. doi:10.1109/VTC2020Spring48590.2020.9128869
Yu, Z., Shi, Y. Q., and Su, W. (2003). “M-ary frequency shift keying signal classification based-on discrete Fourier transform,” in Proceedings of the 2003 IEEE Conference on Military Communications - Volume II, Boston, MA, 13-16 Oct. 2003, 1167–1172.
Zhang, L., Liu, H., Yang, X., Jiang, Y., and Wu, Z. (2021). Intelligent denoising-aided deep learning modulation recognition with cyclic spectrum features for higher accuracy. IEEE Trans. Aerosp. Electron. Syst. 57, 3749–3757. doi:10.1109/TAES.2021.3083406
Keywords: Internet of things, automatic modulation classification, auto-encoder, deep learning, spectrum sensing
Citation: Han J, Yu Z and Yang J (2022) Multimodal attention-based deep learning for automatic modulation classification. Front. Energy Res. 10:1041862. doi: 10.3389/fenrg.2022.1041862
Received: 11 September 2022; Accepted: 21 October 2022;
Published: 16 December 2022.
Edited by:
Dou An, MOE Key Laboratory for Intelligent Networks and Network Security, ChinaReviewed by:
Youcef Belkhier, Maynooth University, IrelandJing Tian, Shenyang Aerospace University, China
Hui Liu, Xi’an University of Posts and Telecommunications, China
Copyright © 2022 Han, Yu and Yang. This is an open-access article distributed under the terms of the Creative Commons Attribution License (CC BY). The use, distribution or reproduction in other forums is permitted, provided the original author(s) and the copyright owner(s) are credited and that the original publication in this journal is cited, in accordance with accepted academic practice. No use, distribution or reproduction is permitted which does not comply with these terms.
*Correspondence: Jia Han, aGFuamlhMjdAMTI2LmNvbQ==