 Peng Wei1
 Qiaoming Shi
95% of researchers rate our articles as excellent or good
Learn more about the work of our research integrity team to safeguard the quality of each article we publish.
Find out more
ORIGINAL RESEARCH article
Front. Energy Res. , 19 October 2022
Sec. Process and Energy Systems Engineering
Volume 10 - 2022 | https://doi.org/10.3389/fenrg.2022.1037825
This article is part of the Research Topic Planning and Operation of Hybrid Renewable Energy Systems, Volume II View all 12 articles
Long-distance transmission of renewable energy via DC is currently a more economical transmission scheme. As the proportion of renewable energy at the generation end continues to rise, the inertia and damping level of the system is reduced, causing serious frequency-related issues. This paper first analyzes the working principle and control method of the LCC-HVDC system, summarizes the frequency control methods of the sending end power grid and their existing problems, and proposes a frequency control scheme for the LCC-HVDC sending end system based on the concept of rapid power compensation (RPC). Finally, the LCC-HVDC system model integrated with the large-capacity wind farm and thermal power plant is built in MATLAB/Simulink. Under conditions of load power fluctuation and sudden wind speed change, the proposed strategy fully utilizes the spare capacity of the system, effectively improves the frequency indexes of the system, and improves the frequency characteristics of the renewable energy sending end grid.
In recent years, in order to reduce carbon emissions, the proportion of renewable energy in the power system, represented by wind power and photovoltaic power generation, has been increasing (Tamrakar et al., 2017; Ratnam et al., 2020; Song et al., 2022). Northwest China has sufficient renewable energy reserves, but the southeast coastal region is a large consumer of electric energy, which requires the vigorous development of renewable energy generation technology via the LCC-HVDC transmission system. LCC-HVDC system has the advantages of simple structure, low construction cost and more mature engineering construction, which is very suitable for long-distance large-capacity transmission of electric energy.However, the sending end system has a large proportion of renewable energy integration, resulting in a low level of system inertia and damping, insufficient system frequency regulation capability, and prominent frequency stability problems (Holttinen et al., 2022).
In order to analyze and solve the frequency stability problems brought by high proportion of renewable energy, Xiong et al. (2022) compared and analyzed typical frequency control strategies for renewable energy systems; Xiong et al. (2020) modeled and analyzed the stability of high-proportion renewable energy systems connected by voltage source converters (VSCs) and summarized the key techniques; Pawar et al. (2021) proposed a grid-connected control scheme for two-stage photovoltaic systems, which can effectively improve frequency stability; Morren et al. (2006) used the power reserve of the wind turbine to provide virtual inertia to support the primary frequency regulation of the grid. However, most of the above methods require the renewable energy generation side to reserve power, which leads to its inability to operate at the maximum power point, affecting the economical operation of the system and increasing the generation cost of the renewable energy system. In addition, operation of this mode causes damage to electrical/mechanical components and seriously shortens their service life in long-term operation.
The high voltage direct current (HVDC) transmission has the advantages of large transmission capacity, long transmission distance, and high regulation capability, which are well suited for long-distance transmission of renewable energy generation systems (Alassi et al., 2019; Shi et al., 2021).
Typical power system frequency regulation methods can be broadly classified into two categories: current-source type virtual inertia providing and voltage-source type virtual inertia providing (Dreidy et al., 2017; Kroposki et al., 2017; Tayyebi et al., 2020; He et al., 2022). The former introduces the rate of change of frequency (RoCoF) into the active power link of the converter control, changes the reference value of active power, and provides active power to the grid proportional to the RoCoF. The latter uses the virtual synchronous generator (VSG) technology, and introduces the swing equation and electromagnetic transient equation of the generator into the control of the converter. It has virtual voltage source characteristics and provides temporary inertia support for the system (Guan et al., 2015). For better economic performance, most of the long-distance HVDC power transmission uses the LCC-HVDC scheme, in which thyristor-based rectifiers/inverters (i.e., current-source inverters) are used, and the equipment has only one control degree of freedom, i.e., the conduction angle/inversion angle. Hence, it is impossible to use the VSC frequency regulation based on two degrees of freedom, and only the frequency regulation methods of the current-source converter are available, e.g., the proportional derivative (PD) control, the virtual inertia control (Holttinen et al., 2022), etc.
Focused on the frequency regulation in LCC-HVDC systems, Yogarathinam et al. (2017) analyzed the effect of inertia and effective short-circuit ratio on the frequency of doubly fed induction generator (DFIG) wind farms integrated with the LCC-HVDC system and under weak grid condition; Li et al. (2019) proposed the LCC-HVDC reserve power coordination control strategy for the multi-terminal feed-in DC transmission system to improve transient stability; Lee et al. (2020) proposed a coordinated control strategy for the LCC-HVDC system to support the frequency and AC voltage; Kwon et al. (2020) achieved real-time regulation of the grid frequency on the rectifier and inverter side by controlling the DC voltage and DC current of the LCC-HVDC system. The above control methods are relatively complex to implement and can cause the deviation of new energy generation from the maximum power point. The HVDC system usually has the feature of non-full power operation, which can be used to regulate the grid frequency on the sending side without the participation of the renewable energy, thus enabling the renewable energy system to operate in maximum power point tracking (MPPT) mode and improving the economic efficiency of the system. To this end, this paper analyzes the working principle of rapid power compensation (RPC) (Xiong et al., 2021; Liu et al., 2022), applies it to the renewable energy sending end, and proposes a frequency control scheme of the renewable energy integrated LCC-HVDC sending end system based on the RPC control strategy.
The remainder of this paper is organized as follows. Part 2 analyzes the operation principle of the renewable energy transmission system via LCC-HVDC. Part 3 summarizes the frequency stability of the sending end system and the common problems of existing solutions. Part 4 discusses the advantages of the RPC and proposes an RPC-based frequency control strategy for the LCC-HVDC sending end system. Part 5 verifies the proposed strategy through simulation.
The basic structure of the LCC-HVDC system is shown in Figure 1. The system consists of two major parts, i.e., the sending end and the receiving end. The sending end consists of the renewable energy (in the form of photovoltaic and wind turbines) and the conventional energy (in the form of traditional thermal power units), and the proportion of renewable energy is increasing. The receiving end is generally the next level of the power grid bus.
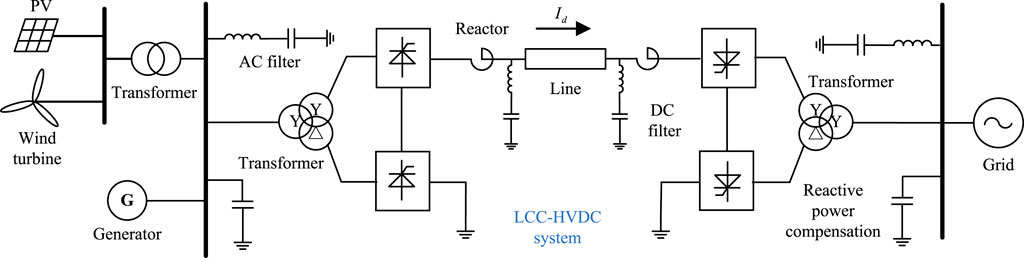
FIGURE 1. Structure of LCC-HVDC sending end power system with renewable energy.
Take the wind power generation as an example. The DFIG is a widely used type of wind turbine, and its basic scheme is shown in Figure 2, which mainly consists of the wind turbine, the speed increasing gearbox, the generator, and bidirectional converter. The DFIG rotor is excited by the rotor side converter (RSC), and electric power is supplied to the grid by the grid side converter (GSC). The frequency of the rotor excitation current is controlled to keep the stator side current constant, i.e., to keep the output frequency of the grid constant.
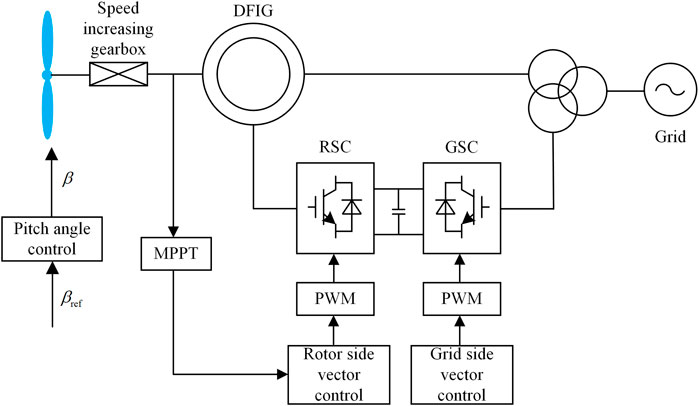
FIGURE 2. DFIG schematic diagram.
When the number of pole pairs in the stator winding is p, the rotating magnetic field speed n1 is proportional to the grid frequency f1, i.e.,
When the rotor side excitation current frequency is f2, the rotating magnetic field speed is
Due to the variable speed and constant frequency operation characteristics of the DFIG, when the rotor speed is n, we have
Substituting (Eq. 1) and (Eq. 2) into (Eq. 3), we get
Namely, by adjusting the rotor excitation current frequency f2, it is possible to generate power at a constant frequency and keep the grid frequency f1 constant.
For the wind turbine, its blades convert the received wind energy into mechanical energy. The mechanical power converted from the captured wind power is
where ρ is the air density, A is the rotating area of the wind turbine during rotation, Cp is the wind utilization factor, and V is the actual wind speed during operation. Except for Cp and V, the other parameters cannot be changed after the wind turbine is manufactured. From (5), in a fixed wind speed, the mechanical power of the fan is decided by Cp, which is affected by the size of the fan, the blade tip speed ratio λ, and the pitch angle β. The relationship between the three can be written as
where ωr is the rotational speed of the fan impeller (in rad/s) and R is the length of the fan’s paddle (in m).
To cope with different wind speed conditions, the DFIG can control the amount of wind energy captured by the turbine through the pitch angle control, and then control the active power output. The PI control is generally used and can be represented as
where βref is the pitch angle reference value, β is the actual pitch angle, ωref is the rotor speed reference value, T1 and T are the time constants, and KP is the gain coefficient.
The power control part of the renewable energy generation system, which generally uses the MPPT control, can be illustrated by the maximum power point operation diagram of the wind power system shown in Figure 3. Each curve in the graph represents the relationship between the active power output and the wind turbine speed at different wind speeds, and the MPPT curve is a curve made by connecting the maximum power points of the wind turbine at different wind speeds. In order to obtain the maximum active power output, it is necessary to control the rotor speed of the turbine equal to the rotor speed of the generator, i.e. the mechanical power of the turbine is equal to the electromagnetic power of the generator. For the wind speed curve v2, assume that point B is the operating point of the generator at speed ω2, and point A is the operating point of the turbine at speed ω2, but neither point A nor B is the maximum power point. At this time, the rotor operation equation is
where J is the rotational inertia of the fan, Pm is the mechanical power of the fan, and Pe is the electromagnetic power. When the mechanical power of the wind turbine is less than the electromagnetic power, the rotor speed will decrease along the curve v2, and at the same time, the working point corresponding to the MPPT curve moves downward until it reaches point C, where the mechanical power and the electromagnetic power reach equilibrium and the wind turbine achieves maximum power tracking. The MPPT is generally achieved by the perturbation-observation method and the conductivity increment method (Abo-Khalil and Lee, 2008), etc.
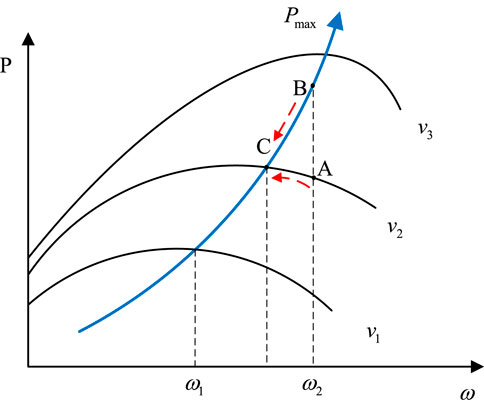
FIGURE 3. Schematic diagram of wind turbine MPPT.
The converter small-signal model of the LCC-HVDC system (Karawita and Annakkage, 2010) can be written as the following state-space expression
where ΔVR, ΔVI, ΔIR, and ΔII represent the voltages and currents at the rectifier and inverter sides, respectively, ΔVdc and ΔIdc are the voltage and current of the DC line, Δα is the trigger angle, and the expressions of the coefficients Ka–Kl are detailed in Karawita and Annakkage (2010). It can be found that the renewable energy is transmitted through the converter station, and the control of the converter station allows the adjustment of the power delivered by the renewable energy.
Next, the DC transmission line is analyzed and modeled as a T-shaped equivalent circuit as shown in Figure 4, and the linearized model of the DC line is represented as
where
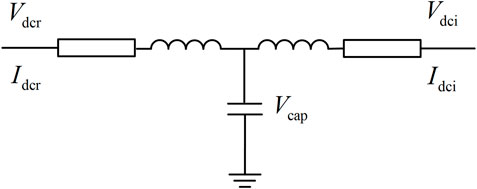
FIGURE 4. Schematic diagram of T-shaped transmission line.
To simplify the analysis, the internal resistance and reactance of the transformer can be ignored. Assuming that the total resistance on the line is R, and the DC voltages at the rectifier and inverter sides are Udr and Udi, respectively, the line current can be written as
where the DC voltages Udr and Udi are controlled by the trigger angle α, the arc extinguishing angle γ, and the transformer ratios kT1 and kT2, which can be written as
where Ur and Ui are the AC bus voltages at both ends of the line, and thus the power transmitted from the sending end and the power received by the receiving end are
Through the above equations, it can be seen that the DC transmission power can be adjusted by adjusting the control angles of the converter and the tap ratio of the converter transformer. As the adjustment of the AC side transformer tap is done by the mechanical structure, the required adjustment time is long and difficult to adapt to rapid power adjustment. Hence, the system transmission power is generally adjusted quickly by adjusting the trigger angle and arc extinguishing angle.
For the control part of the LCC-HVDC system, the rectifier side often uses the constant current control, and the inverter side can use a fixed voltage control, fixed current control, fixed arc extinguishing angle control, or a combination of their control methods. The control strategy recommended by the CIGRE-HVDC model is usually used, i.e., a constant-current control strategy for the rectifier side and a constant-current or constant-arc-extinguishing-angle-control strategy for the inverter side (Atighechi et al., 2014).The LCC on the rectifier side controls the active power transmission of the system, and the LCC on the inverter side maintains the stability of the DC system.The detailed control structure is shown in Figure 5, where αR and αI are the final output quantities, representing the trigger angles at the rectifier and inverter sides, respectively.
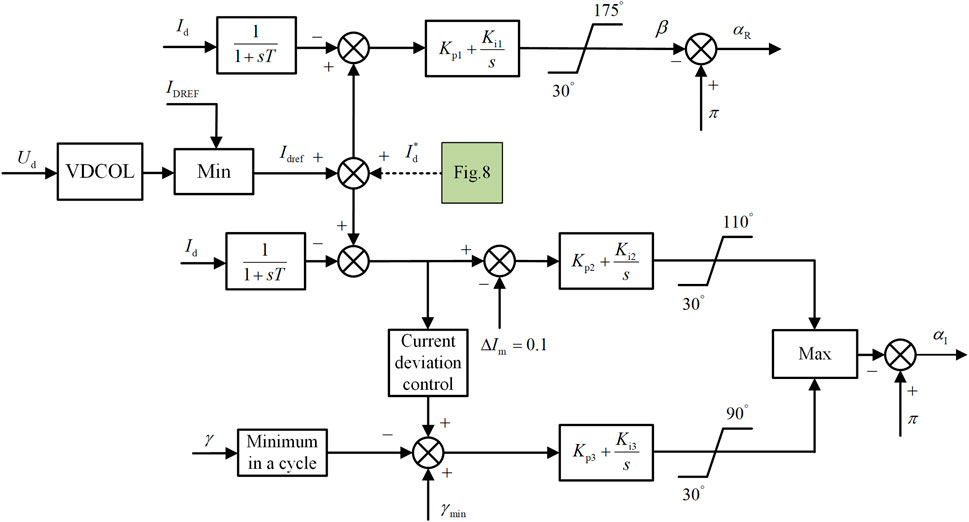
FIGURE 5. LCC-HVDC system control block diagram.
The constant current control at rectifier side adopts the PI control, and the output is the trigger lead angle β, which is related to the trigger angle α as
For the inverter side, the PI control is still used for the fixed current. To ensure the normal operation of the system and prevent the phase change failure, a safety margin of 0.1 pu is reserved for the current setting value. The constant arc-extinguishing angle control adopts the negative feedback PI control, and its output is the sum of the deviation of the arc-extinguishing angle setting value and the minimum arc-extinguishing angle measured at the inverter side in the previous cycle and the arc-extinguishing angle obtained by the current deviation control. This value is used to change the trigger angle of the inverter. The saturation link is set for both fixed current and fixed arc-extinguishing angle control. In addition, a voltage dependent current order limiter (VDCOL) is also set. When the DC voltage falls below a certain value due to a fault, the setting value of DC current regulator will be automatically lowered, and when the DC voltage is restored, the DC current will be automatically adjusted back to its setting value, and the current reference value is fixed during normal operation. In this model, the mid-point voltage of the DC transmission line is used as the starting voltage of the VDCOL link. During normal operation, the VDCOL does not work. When the DC voltage is lower than the upper limit set by VDCOL, this link reduces the current command of the converters on both sides to deal with the commutation failure.The dashed line in Figure 5 shows the change of the current reference value after adopting the RPC strategy. The current deviation control is a correction of the current reference value to some extent. In addition, to ensure the effectiveness of the control, low-pass filtering is used for the measured values. In order to prevent the occurrence of faults such as phase change failure, a certain threshold value is reserved for the trigger angle, saturation units are added in the control section, and the arc extinguishing angle is also set to its minimum value (18°). Detailed parameters are shown in Figure 5.
The renewable energy sending end system via LCC-HVDC has major differences compared with the traditional HVDC transmission system, mainly including:
(1) The traditional HVDC transmission system transmits most of the power generated by thermal power units, only partly containing or not containing renewable energy power.
(2) Renewable energy generation systems use decoupled power electronic interface, so that renewable energy cannot respond to changes in system frequency as the rotor of the traditional generator. For instance, the photovoltaic power generation system connects to the bus via the converter interface, so that it cannot respond to the system frequency change caused by power disturbances.
(3) Due to the increase in the renewable energy proportion, the inertia and damping of the sending end system are significantly reduced. Compared with the traditional generator system, the same power disturbance will bring about greater frequency deviation; the probability of relay action increases, and the frequency safety of the sending end system faces greater challenges.
(4) The new energy transmission end system will also contain a certain amount of power plant end load, and may also contain part of the near end load. Most of these loads are connected to the power grid in the form of power electronic interfaces, which also reduces the inertia damping level of the system at the sending end, and the system frequency security is threatened.
At present, the main way to improve the frequency stability of the power grid at the sending end of the renewable energy system is through additional control in the renewable energy system, mainly including the VSG control and the PD control, both of which are used to improve the frequency stability of the system by equivalently enhancing the inertia and damping of the system.
The VSG control adds the rotor equation of motion of the synchronous machine, i.e., the swing equation, into the control of converter, so that the converter has the swing characteristics similar to a synchronous machine, which can provide virtual inertia and damping to the system when the power disturbance occurs and enhance the system’s ability to resist disturbances. The swing equation can be written as
where TJ is the system inertia coefficient, PG is the total power of the generator, PL is the load power, ΔPL is the load power disturbance, and D is the damping factor.
Although VSG control enhances the ability of the system to resist disturbances, it has some drawbacks that limit its application. For example, the magnitudes of virtual inertia and damping need to be set artificially, making the design of parameters extremely difficult because the magnitude, timing, and location of the disturbance cannot be determined, and the virtual inertia and damping may exceed the energy that the system can provide. For the physical structure, the energy of the VSG generally comes from the capacitor bank, and the charging and discharging of the capacitor during frequency regulation accelerates its aging and reduces its service life. In addition, the VSG has problems such as power oscillation. All these limit the VSG technique applications in the renewable energy grid.
The droop control can correct the frequency deviation, which is essentially the proportional control; the inertia control can reduce the RoCoF of the system, which is basically the differential control. The use of these two control methods equivalently increases the inertia and damping coefficient of the system, whose output power can be expressed as
where KD and KJ are the equivalently increased control coefficients using the droop control and the inertia control, respectively, s is the differential operator, fN is the rated frequency of the system, and f is the actual output frequency of the system. The equivalently increased system inertia enhances the transient support capability of the system and reduces the RoCoF; the equivalently increased system damping enhances the steady-state support capability of the system and reduces the frequency deviation.
To obtain better frequency control effect, the droop control is combined with the inertia control, which is the PD control. The PD control is used to further improve the system frequency performance, and its output power can be expressed as
where kp and kd are the proportional and differential coefficients, respectively. If kp is set to a small value, the damping power is insufficient, resulting in a large frequency deviation; if kd is set to a small value, the inertia power is insufficient, resulting in a large RoCoF. If the kp and kd parameters are set too large, the effective transmission power of the system is reduced because more power is involved in frequency regulation. The optimal PD control parameters depend heavily on the inertia and damping parameters of the system, whose values are difficult to obtain in practice, and inappropriate PD parameters may even deteriorate the system frequency indexes and bring adverse effects.
The above control method is achieved by using the reserve capacity of the renewable energy source to compensate for the system unbalanced power when the disturbance occurs. However, this will make the renewable energy system deviate from its maximum power point during normal operation and reduce the economic efficiency of the power generation system. In addition, the renewable energy system is influenced by the environment (such as wind speed, light, and temperature, etc.), and when the working conditions are extremely severe, even changing the control strategy of the renewable energy will not improve the frequency of the power grid at the sending end. Moreover, for wind turbines, frequent changes in their rotational speed will accelerate the aging and damage of mechanical structures such as drive shafts, reducing their service life.
Considering the voltage level and capacity of the power system will gradually increase, the maximum capacity of the HVDC system is generally larger than the actual transmission capacity because the system keeps a certain amount of rotating reserves. This spare capacity provides the possibility for frequency regulation using the LCC-HVDC system. By using the spare capacity, power compensation can be performed in the event of power disturbances, providing inertia and damping to the system, enhancing its ability to resist power disturbances. Since the frequency regulation power comes from the other end of the normally operating grid, the maximum power point of the renewable energy system is not affected, and the economic operation of the power generation system is maintained.In addition, due to the power grid at the other end of the frequency modulation energy source, it will not affect the frequency of the power grid at the sending end. There will be no problem of secondary drop in frequency.
From the analysis in the previous section, it can be seen that the magnitudes of PD and PJ are proportional to their respective coefficients KD, KJ and Δf, RoCoF. In order to compensate the unbalanced power of the system to the maximum, the output power of the converter can be set to the maximum reserve capacity of the system, Pidmax, corresponding to the basic principle of the RPC strategy. This process can be represented by Figure 6.
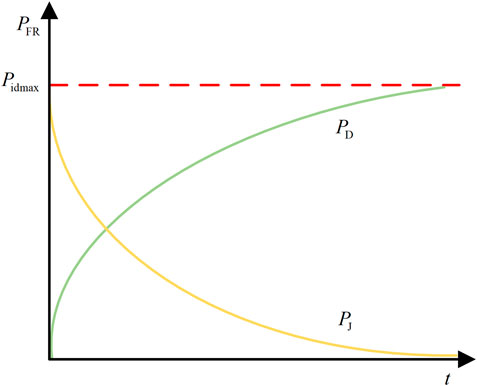
FIGURE 6. Illustration of power curves.
As shown by the power curves in Figure 6, when the sum of the two curves is constantly equal to the maximum power reserve, the unbalanced power of the system can be compensated to the maximum extent. Namely,
The frequency characteristics of the system can be expressed in terms of the power delivered by the generation system and the power absorbed by the load as
where TJ = 4πH, H is the inertia coefficient of the system, and P∑ and PL represent the power generated and absorbed by the system, respectively. It should be noted that part of the power delivered by the power generation system is used to transmit to the load, and the other part is used for the frequency response, yielding
where P0 is the load power, and KL is the inherent frequency response coefficient of the system, which is related to the composition of the generation and load side systems.
When there is the additional frequency response power PFR provided by the converter system, by combining with Eq. 20; Eq. 19 can be rewritten as
Further, when the converter uses the RPC strategy (i.e., PFR = Pidmax), (21) is rewritten as
By solving this equation, the frequency deviation Δfi and the RoCoF Ri are obtained as
When the converter uses the PD control strategy, (Eq. 21) can be rewritten as
Substituting (Eq. 17) into (Eq. 25), we can get
Comparing and analyzing (Eqs 18, 23, 24, 26, 27), we have Δfi = ΔfPD, Ri = RPD when and only when
Based on the above analysis, the RPC strategy can achieve the same frequency regulation effect as the optimal PD control when the backup capacity Pidmax of the converter output is the maximum frequency regulation power, and the RPC control strategy does not need the information of unknown parameters in the system, which reduces the difficulty of controller design and avoids further damage to the system frequency caused by unreasonable control parameters.
The change of system frequency is caused by the active power imbalance, and the frequency response process of the system can be reflected by the frequency offset and RoCoF indicators, based on which the degree of system power imbalance can be judged. For the LCC-HVDC system, when the power grid frequency at the sending end suddenly drops or rises, the power generated by the sending-end converter is required to increase or decrease to improve the frequency characteristics. When the power disturbance makes the system frequency indicators changes drastically, the RPC control mode is enabled; when the frequency indicators reach the droop control threshold interval, the control mode will be converted to the droop control; and finally when the frequency indicator satisfies the grid code specification, the system is in normal operation without the converter providing any frequency response power. The output power of the above method can be written as
The specific implementation of the RPC principle is shown in Figure 7, where fd and fRPC are the frequency deviation limits for the droop and RPC modes, frelay is the limit value of the frequency offset relay, Rd is the RoCoF threshold for the steady-state operation mode and the droop control mode, and RRPC is the RoCoF threshold for the RPC mode. The red line encircles the steady-state mode of operation, and the light yellow area is the operating interval where the RPC mode is converted to the steady-state mode (i.e., the power provided by the RPC allows the system to reach steady-state operation without droop control), and the RoCoF threshold (i.e., the interval from RRPC to Rd) is reserved to prevent further power fluctuations. In addition, the RPC mode is divided into two cases, -RPC and +RPC, depending on whether the converter is absorbing power or emitting power.
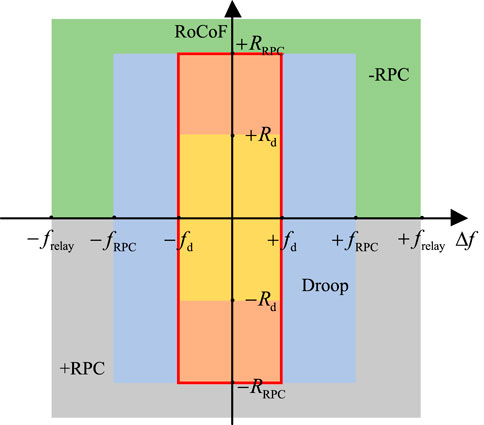
FIGURE 7. Logic conversion diagram of proposed control scheme.
According to Figure 7, the different modes are elaborated as follows.
(1) Mode I: Steady-state mode. When 0 < |Δf| < fd and |RoCoF| < Rd, the system is in steady-state operation mode. The converter does not need to provide additional frequency response power and the system operates normally.
(2) Mode II: Droop control mode. When fd < |Δf| < fRPC and |RoCoF| < RRPC, the system is in droop control mode, and the converter only needs to provide the power required for droop control. The purpose of setting this mode is to avoid the converter to run at maximum power for a long time, and it can smoothly exit the RPC mode to avoid the secondary frequency fluctuation caused by the sudden change of frequency regulation power due to mode switching.
(3) Mode III: RPC mode. When Δf < − fRPC or RoCoF > RRPC, it indicates that the system generates too much power and needs to absorb the excess power; the system operates in -RPC mode, and the converter absorbs the excess power (−Pidmax) from the system.
(4) Mode IV: +RPC mode. When Δf > fRPC or RoCoF < − RRPC, it indicates that the system generates less power and needs to provide additional compensation power; the system operates in +RPC mode, and the converter generates power with the value of + Pidmax.
The output frequency response power of the RPC strategy can be represented by Figure 8: in the event of a large disturbance, the system provides its maximum reserve power to resist the disturbance power instantaneously, and switches to droop control over time when the droop interval is reached by the frequency indicators, as shown by the dashed lines in Figure 8 representing different magnitudes of power disturbances. The larger the disturbance, the longer the RPC mode operation. When the steady-state indicators are satisfied, the converter no longer provides frequency response power.
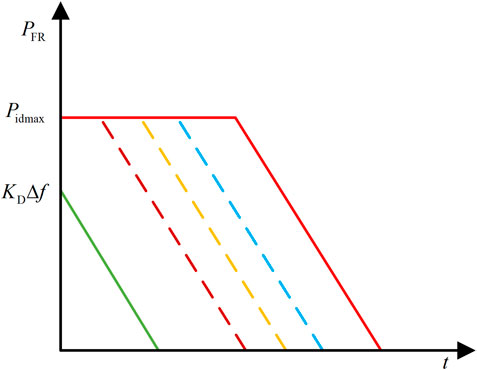
FIGURE 8. Frequency response power curves.
Assuming that the power disturbance of the LCC-HVDC system is very large (i.e., ΔPL > Pidmax), the frequency response power provided by the converter is its maximum power reserve Pidmax. The maximum power reserve is used to support the grid frequency at the sending end until the system frequency indexes reach the droop mode interval, then the converter is switched to the droop control to smoothly exit the RPC mode and reduce the oscillation problem caused by the sudden change of power when switching modes. This implementation process is illustrated in detail in Figure 9. First, the frequency parameters required for the RPC control strategy are obtained through the phase-locked loop, and then the logic shown in Figure 7 is used to determine the operating interval to which this moment belongs. The control provides the required power, and finally changes the reference value of the DC current in the LCC-HVDC system.
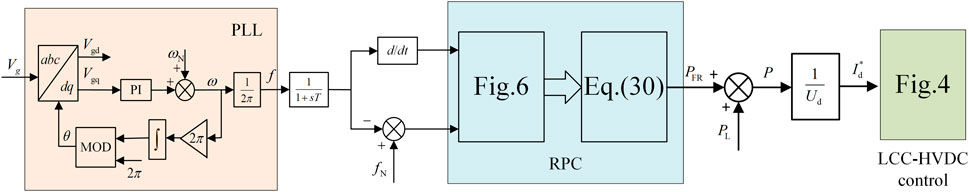
FIGURE 9. Proposed frequency control scheme for sending end of LCC-HVDC system.
To verify the frequency control scheme proposed in this paper, the simulation model shown in Figure 1 was established in MATLAB/Simulink, where multiple wind turbines were used at the sending end to simulate a wind farm with a total installed capacity of 600 MW and one generator set to simulate a thermal power plant with an installed capacity of 900 MW, which was used to simulate a finite large system. The receiving end is approximated as an infinite grid. The reserve power capacity of the LCC-HVDC system is 30 MW, and the following simulation analysis was carried out for two operating conditions of load disturbance and wind speed fluctuation at the sending end of the grid. The system parameters are shown in Table 1, the parameters of the RPC control strategy are shown in Table 2, and the control parameters of the LCC-HVDC system are detailed in Atighechi et al. (2014).
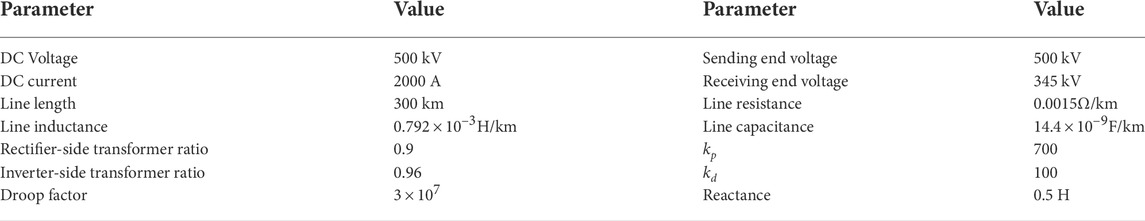
TABLE 1. System parameters.

TABLE 2. RPC control strategy parameters.
The load disturbance condition is simulated for two cases: single disturbance and continuous disturbances. The single disturbance corresponds to the 100 MW load shedding (which can be considered as a large disturbance), and the continuous disturbances include two consecutive events of load shedding (40 MW and 50 MW respectively).
For the single disturbance condition, the frequency characteristics of the natural response, droop control, PD control and RPC-based control are compared and analyzed. At 60 s, the load shedding of 100 MW at the sending grid is simulated, and the frequency variation of the sending end grid is shown in Figure 10. From the figure, it can be seen that at the moment the load shedding starts at the sending grid, the system power changes abruptly, and the maximum frequency reached by the system is about 50.6 Hz when there is no additional control. The maximum frequencies of the system are 50.54 Hz, 50.49 Hz and 50.4 Hz when the droop control, PD control and RPC control are adopted respectively, and it can be seen that the RPC control strategy has the best effect, i.e., the maximum frequency it reaches is the smallest. After the disturbance, the steady-state frequency deviation is 0.24 Hz under the natural response, and both droop control and PD control properly reduce the steady-state frequency deviation of the system, and their values are 0.22 Hz and 0.19 Hz, respectively. The steady-state frequency deviation is the lowest (0.17 Hz) by using the RPC-based strategy, which has the best frequency deviation suppression effect.
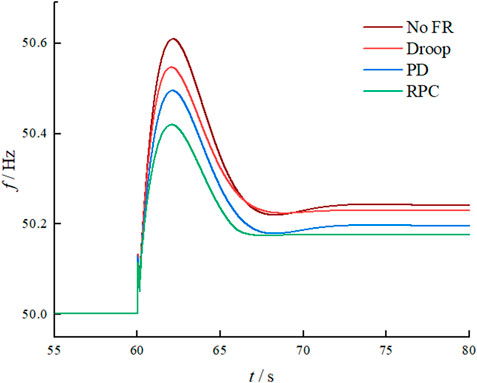
FIGURE 10. Sending end grid frequency in the event of 100 MW load shedding.
Next, the case of continuous disturbances is simulated. The grid at the sending end reduces 40 MW load at 40 s and another 50 MW load at 70s, and the system simulation results are shown in Figure 11. It can be seen from the figure that the power disturbance occurred at 40s, the maximum frequency deviation under the natural response is 0.24Hz, when the droop control and RPC strategy are adopted, the maximum frequency deviation of the system is 0.17Hz and 0.12Hz respectively. It can be seen that the droop control and RPC strategy can restrain frequency fluctuation to a certain extent, but RPC strategy has the strongest ability to restrain frequency fluctuation. When the system frequency reaches a steady state, the system frequency under natural response is 50.1Hz. Under the droop control and RPC strategy, the system frequency is 50.08 Hz and 50.07 Hz respectively, which can reduce the steady-state frequency deviation, and the effect is relatively well.The frequency indicators are also within the allowable range of the grid. In summary, it can be seen that the RPC strategy has the best ability to suppress frequency fluctuations and restore steady-state frequency. Next, 50 MW load shedding occurred at 70s, the maximum frequency deviation of the natural response was 0.4Hz, and the maximum frequency deviations when the droop control and RPC strategy were adopted were 0.31 Hz and 0.25 Hz. When the steady state was reached, the natural response system frequencies, under droop control and RPC strategy are 50.21Hz, 50.18Hz, and 50.15Hz respectively. It can be seen that the RPC strategy can still achieve a better control effect for continuous disturbance, and significantly reduce the steady-state frequency deviation. For the droop control, although the frequency performance of the system is also improved, it is not as effective as the RPC strategy. Because the setting of the droop parameters is closely related to the disturbance size and system parameters, and the adaptability to the disturbance is poor.For the RPC control strategy, because its + RPC mode is the first to start, it completely utilizes the system reserved capacity; after the frequency indexes reach the droop mode interval, the RPC switches into the droop control mode, so that the system obtains the best frequency characteristics.

FIGURE 11. Sending end grid frequency in the event of continuous load shedding.
The actual wind speed is not constant, and the power generation of the wind farm is always affected by the environment. In the simulation, the wind speed suddenly changes from the rated 11 m/s to 9 m/s at 50 s, and the frequency of the renewable energy generation system using different controls is shown in Figure 12. At 50s, the wind speed suddenly changed from the rated 11 m/s to 9 m/s. The frequency characteristics of the new energy transmission system under different control are shown in Figure 12. It can be seen from the figure that the sudden wind speed fluctuation causes the frequency of the sending-end power grid to drop rapidly. The lowest point of the system frequency under the natural response is 49.25Hz. When the droop control, PD control and RPC control are used respectively, the lowest point frequency are 49.33 Hz, 49.37 Hz, and 49.43 Hz. When the system frequency is close to the steady state, the frequency is 49.5 Hz under the natural response, and the steady-state frequency ratio when using droop control, PD control and RPC strategy is 49.52 Hz, 49.55 Hz and 49.57 Hz. It can be seen that the RPC strategy has the best performance and ability to suppress frequency excursions and steady-state frequency recovery.Although the system fully utilizes the reserved capacity, for the grid with a very high percentage of renewable energy, the wind speed fluctuation brings larger power oscillation, and the power reserve of the LCC-HVDC system needs to be appropriately increased to further improve the frequency characteristics of the power grid at the sending end.
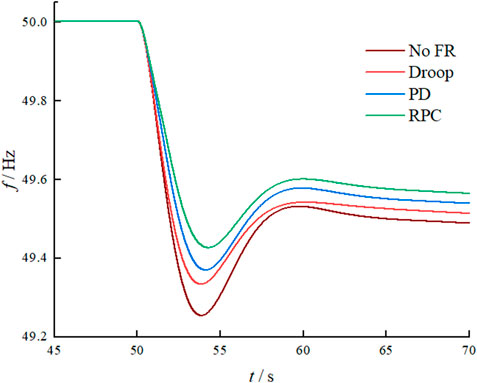
FIGURE 12. Sending end grid frequency in the event of sudden change in wind speed.
In this paper, a frequency control scheme based on the RPC principle is proposed for the renewable energy integrated LCC-HVDC sending end system. The frequency performances of the system with the droop control, PD control and RPC strategy are compared and analyzed. It is seen that the RPC strategy can effectively reduce the frequency deviation of the system, reduce the time required to reach steady state, and improve the steady-state frequency. The power reserve of the system can be appropriately increased to further improve the frequency characteristics of the grid.
The original contributions presented in the study are included in the article/supplementary material, further inquiries can be directed to the corresponding author.
All the authors conceived and designed the study. PW, BC, and LS performed the simulation, and wrote the manuscript with the guidance from QS. RL, YW, and KL conceived and designed the simulations.
The work was supported by the State Grid Ningxia Electric Power Co., Ltd. Under grant B329CG210000.
Authors PW and LS were employed by the company State Grid Ningxia Electric Power Co., Ltd. Authors BC and RL were employed by the company State Grid Ningxia Ultrahigh Voltage Company. Authors QS, YW, KL were employed by the company NR Engineering Co., Ltd.
The authors declare that the research was conducted in the absence of any commercial or financial relationships that could be construed as a potential conflict of interest.
All claims expressed in this article are solely those of the authors and do not necessarily represent those of their affiliated organizations, or those of the publisher, the editors and the reviewers. Any product that may be evaluated in this article, or claim that may be made by its manufacturer, is not guaranteed or endorsed by the publisher.
Abo-Khalil, A. G., and Lee, D.-C. (2008). MPPT control of wind generation systems based on estimated wind speed using SVR. IEEE Trans. Ind. Electron. 55, 1489–1490. doi:10.1109/tie.2007.907672
Alassi, A., Bañales, S., Ellabban, O., Adam, G., and MacIver, C. (2019). HVDC transmission: Technology review, market trends and future outlook. Renew. Sustain. Energy Rev. 112, 530–554. doi:10.1016/j.rser.2019.04.062
Atighechi, H., Chiniforoosh, S., Jatskevich, J., Davoudi, A., Martinez, J. A., Faruque, M. O., et al. (2014). Dynamic average-value modeling of CIGRE HVDC benchmark system. IEEE Trans. Power Deliv. 29, 2046–2054. doi:10.1109/tpwrd.2014.2340870
Dreidy, M., Mokhlis, H., and Mekhilef, S. (2017). Inertia response and frequency control techniques for renewable energy sources: A review. Renew. Sustain. Energy Rev. 69, 144–155. doi:10.1016/j.rser.2016.11.170
Guan, M., Pan, W., Zhang, J., Hao, Q., Cheng, J., and Zheng, X. (2015). Synchronous generator emulation control strategy for voltage source converter (VSC) stations. IEEE Trans. Power Syst. 30, 3093–3101. doi:10.1109/tpwrs.2014.2384498
He, C., He, X., Geng, H., Sun, H., and Xu, S. (2022). Transient stability of low-inertia power systems with inverter-based generation. IEEE Trans. Energy Convers., 1–10. doi:10.1109/tec.2022.3185623
Holttinen, H., Kiviluoma, J., Flynn, D., Smith, J. C., Orths, A., Eriksen, P. B., et al. (2022). System impact studies for near 100% renewable energy systems dominated by inverter based variable generation. IEEE Trans. Power Syst. 37, 3249–3258. doi:10.1109/tpwrs.2020.3034924
Karawita, C., and Annakkage, U. (2010). “Control block diagram representation of an HVDC system for sub-synchronous frequency interaction studies,” in 9th IET International Conference on AC and DC Power Transmission, London, 19-21 October 2010 (ACDC), 1–5.
Kroposki, B., Johnson, B., Zhang, Y., Gevorgian, V., Denholm, P., Hodge, B.-M., et al. (2017). Achieving a 100% renewable grid: Operating electric power systems with extremely high levels of variable renewable energy. IEEE Power Energy Mag. 15, 61–73. doi:10.1109/mpe.2016.2637122
Kwon, D.-H., Kim, Y.-J., and Gomis-Bellmunt, O. (2020). Optimal DC voltage and current control of an LCC HVDC system to improve real-time frequency regulation in rectifier- and inverter-side grids. IEEE Trans. Power Syst. 35, 4539–4553. doi:10.1109/tpwrs.2020.2997793
Lee, G.-S., Kwon, D.-H., Moon, S.-I., and Hwang, P.-I. (2020). A coordinated control strategy for LCC HVDC systems for frequency support with suppression of AC voltage fluctuations. IEEE Trans. Power Syst. 35, 2804–2815. doi:10.1109/tpwrs.2020.2964336
Li, C., He, P., and Li, Y. (2019). LCC-HVDC auxiliary emergency power coordinated control strategy considering the effect of electrical connection of the sending-end power grid. Electr. Eng. 101, 1133–1143. doi:10.1007/s00202-019-00855-0
Liu, H., Liu, X., Xiong, L., Li, M., and Zhu, Y. (2022). Adaptive power compensation-based frequency regulation strategy of wind turbine system. IEEE J. Emerg. Sel. Top. Circuits Syst. 12, 260–267. doi:10.1109/jetcas.2022.3142452
Morren, J., de Haan, S., Kling, W., and Ferreira, J. (2006). Wind turbines emulating inertia and supporting primary frequency control. IEEE Trans. Power Syst. 21, 433–434. doi:10.1109/tpwrs.2005.861956
Pawar, B., Batzelis, E. I., Chakrabarti, S., and Pal, B. C. (2021). Grid-forming control for solar PV systems with power reserves. IEEE Trans. Sustain. Energy 12, 1947–1959. doi:10.1109/tste.2021.3074066
Ratnam, K. S., Palanisamy, K., and Yang, G. (2020). Future low-inertia power systems: Requirements, issues, and solutions - a review. Renew. Sustain. Energy Rev. 124, 109773. doi:10.1016/j.rser.2020.109773
Shi, Q., Liu, H., Liu, K., Wang, Y., Zhang, Q., Lu, Y., et al. (2021). Coordinated sending-end power system frequency regulation via UHVDC. Electronics 10, 1909. doi:10.3390/electronics10161909
Song, G., Cao, B., and Chang, L. (2022). Review of grid-forming inverters in support of power system operation. Chin. J. Electr. Eng. 8, 1–15. doi:10.23919/cjee.2022.000001
Tamrakar, U., Shrestha, D., Maharjan, M., Bhattarai, B. P., Hansen, T. M., and Tonkoski, R. (2017). Virtual inertia: Current trends and future directions. Appl. Sci. (Basel). 7, 654. doi:10.3390/app7070654
Tayyebi, A., Groß, D., Anta, A., Kupzog, F., and Dörfler, F. (2020). Frequency stability of synchronous machines and grid-forming power converters. IEEE J. Emerg. Sel. Top. Power Electron. 8, 1004–1018. doi:10.1109/jestpe.2020.2966524
Xiong, L., Liu, X., Liu, H., and Liu, Y. (2022). Performance comparison of typical frequency response strategies for power systems with high penetration of renewable energy sources. IEEE J. Emerg. Sel. Top. Circuits Syst. 12, 41–47. doi:10.1109/jetcas.2022.3141691
Xiong, L., Liu, X., Liu, Y., and Zhuo, F. (2020). Modeling and stability issues of voltage-source converter dominated power systems: A review. CSEE J. Power Energy Syst., 1–18. doi:10.17775/CSEEJPES.2020.03590
Xiong, L., Liu, X., Zhang, D., and Liu, Y. (2021). Rapid power compensation-based frequency response strategy for low-inertia power systems. IEEE J. Emerg. Sel. Top. Power Electron. 9, 4500–4513. doi:10.1109/jestpe.2020.3032063
Keywords: RPC, LCC-HVDC, sending end grid, renewable energy, frequency control
Citation: Wei P, Chai B, Shi L, Shi Q, Liu R, Wang Y and Liu K (2022) RPC-based frequency control strategy of LCC-HVDC sending end power system with renewable energy. Front. Energy Res. 10:1037825. doi: 10.3389/fenrg.2022.1037825
Received: 06 September 2022; Accepted: 22 September 2022;
Published: 19 October 2022.
Edited by:
Liansong Xiong, Xi’an Jiaotong University, ChinaReviewed by:
Huimin Wang, University of Electronic Science and Technology of China, ChinaCopyright © 2022 Wei, Chai, Shi, Shi, Liu, Wang and Liu. This is an open-access article distributed under the terms of the Creative Commons Attribution License (CC BY). The use, distribution or reproduction in other forums is permitted, provided the original author(s) and the copyright owner(s) are credited and that the original publication in this journal is cited, in accordance with accepted academic practice. No use, distribution or reproduction is permitted which does not comply with these terms.
*Correspondence: Qiaoming Shi, c2hpcWlhb21pbmdAbnJlYy5jb20=
Disclaimer: All claims expressed in this article are solely those of the authors and do not necessarily represent those of their affiliated organizations, or those of the publisher, the editors and the reviewers. Any product that may be evaluated in this article or claim that may be made by its manufacturer is not guaranteed or endorsed by the publisher.
Research integrity at Frontiers
Learn more about the work of our research integrity team to safeguard the quality of each article we publish.