 Song Li
 Qian Zhang
 Lei Liu3
- 1College of Nuclear Science and Technology, Naval University of Engineering, Wuhan, China
- 2Laboratory for Advanced Nuclear Energy Theory and Applications Zhejiang Institute of Modern Physics, Department of Physics Zhejiang University, Hangzhou, China
- 3College of Electrical Engineering, Naval University of Engineering, Wuhan, China
The fine-mesh subgroup method (FSM) is proposed to treat the significant resonance self-shielding effect both effectively and accurately. Similar to the ultra-fine group method, the fine-mesh subgroup method adopts a fine group structure on the resonance energy range to avoid the extra resonance interference effect correction. To improve the efficiency, on the one hand, the one-group micro-level optimization is adopted, so the subgroup fixed-source equations will be only calculated on a certain number of pre-determined subgroup levels, and an interpolation process is employed to obtain the actual subgroup flux. On the other hand, the slowing-down calculation is carried out for group condensation for multigroup transport calculation. The main theory and feasible improvements of the fine-mesh subgroup method are analyzed in this paper. Several pin cell and lattice problems are applied to test the performance of the fine-mesh subgroup method, and the particle swarm optimization method is adopted to find the better group structure. The numerical results indicate a good performance both for accuracy and efficiency.
1 Introduction
With the development of nuclear energy, the demand for accurate calculation of reactor physics has become increasingly higher. Since the resonance self-shielding calculation provides the effective material cross-sections for all processes of the core simulation, handling the resonance effect accurately and effectively has been the research hotspot in recent years. There are three main resonance treatment methods applied in reactor physics, namely, the equivalence theory (Askew et al., 1966; Hebert et al., 1991), ultra-fine group method (Ishiguro et al., 1971; Sugimura et al., 2007; Kim et al., 2011; Zhang et al., 2020), and subgroup method (Nikolaev et al., 1971; Cullen, 1977; Hebert, 2009; Joo et al., 2009; Downar et al., 2016; Li et al., 2019). The equivalence method uses the neutron’s first escape probability from absorption to develop the equivalence relation between the homogeneous and heterogeneous systems, and the effective resonance cross-section is obtained by interpolating the resonance integrals. The equivalence method is simple and efficient but is difficult to apply to conditions such as irregular geometry and complicated material compositions. The ultra-fine group method is the most direct approach for the resonance effect as it has hundreds of thousands of groups to capture the severe fluctuation of cross-sections in the resonance energy range. Since the resonance peaks would be reproduced accurately enough by extremely detailed energy structure, this method has the same level of accuracy as the Monte Carlo method. However, the efficiency of the ultra-fine group method is unacceptable as too many groups sharply increase the calculation burden, so it is not suitable for use in large-scale problems. The subgroup method is another widely used method for resonance treatment. Different from the traditional group structure divided by energy discretion, the subgroup structure is determined by the level of the cross-section. The variations of resonance peaks are described by subgroup parameters, including subgroup levels and subgroup weights. The former represents the magnitude of the cross-section level, and the latter indicates the probability that a neutron locates in the corresponding subgroup. In this method, the traditional resonance group will be further divided into several subgroups, and the calculation accuracy would be comparable with that of ultra-fine groups. In addition, the subgroup method has the ability to be coupled with any kind of transport solver such as the method of characteristics (MOC), so that it can handle complex geometry configurations. However, the subgroup theory is derived on the basis that only one resonant nuclide exists in the system. For conditions with the resonance interference effect between different resonant nuclides, the accuracy of the subgroup method would decrease and extra correction is needed, such as the Bondarenko method (Bondarenko, 1964) or the resonance interference factor (RIF) method (Williams, 1983; Peng et al., 2013; Sohail et al., 2015). However, the Bondarenko method has been proven to be inaccurate, and the RIF method will cause a great increase in calculation burden. In recent years, there are other new resonance treatment methods proposed, such as the embedded self-shielding method (Williams et al., 2012; Liu et al., 2015; Zhang et al., 2015; Kim et al., 2019), pseudo resonance isotope method (Liu et al., 2018; Zhang et al., 2018), or pin-based slowing-down method (Choi et al., 2017), which all have relatively high accuracy. However, the first method treated the fuel rod as a whole system, so the resonance effect inside the fuel pin is unknown, while the latter two still need the ultra-fine group slowing-down equations, which is time-consuming.
From the theory of the ultra-fine group and the subgroup method, a compromise proposal could be found by coupling the two methods’ advantages, so the fine-mesh subgroup method (FSM) was proposed by the author (Li et al., 2020). In the coupling assumption, as the energy group mesh is further divided by the subgroup, the fine energy mesh could be much coarser than the ultra-fine group method. Different from the traditional subgroup method, the fine-mesh energy structure could be considered so that the resonance interference effect is avoided. To obtain the proper fine energy mesh, the SHEM-361 group structure (Hfaiedh et al., 2005; Hébert et al., 2008) is adopted and modified. The resonance energy range has been extended from 1.855 to 9,118 eV, and the energy group number in this range is 289 and the total group number is 408. Compared with the original SHEM-361 structure, the new 408 group structure has a finer mesh between 1.855 and 100 eV, while the energy structure of the other energy range remains the same. To reduce the number of subgroup fixed-source equations, the one-group micro-level optimization, which is modified based on the macro-level grid optimization (Park et al., 2019), is adopted and the 289 resonance groups are averaged to be one group and each resonant nuclide only needs to solve fixed-source problems for eight subgroup levels. Then, an interpolation of the background cross-section would be carried out to reproduce the original subgroup fluxes in actual subgroups in each resonance group. Furthermore, as the fine-mesh structure would inevitably lead to the increase in calculation burden for the transport module, the group condensation procedure is carried out in this work and the 47-group structure library of the Helios-1.11 program (Stamm’ler, 2008), which has 16 resonance groups, is adopted. The 16 resonance groups’ cross-sections are calculated by collapsing the fine group, while those of fast and thermal groups are provided by the NJOY code (Macfarlane et al., 2016). The neutron slowing-down equation is used in this work for group condensation, which is handled group by group. The source item for the slowing-down equation is obtained by only down-scattering since the upper scattering effect and fission source could be neglected for the resonance range.
In this work, more detailed analyses or the FSM are carried out, especially for the procedure of making the fine-mesh group structure and sensitivity analysis of selecting the interpolation cross-section of one-group micro-level approximation for the subgroup fixed source problem. In addition, there are also some promisingly improvable aspects of the FSM. The 47-group structure will still cause too much burden for the whole calculation, and a coarser structure with fewer total group numbers is necessary. The particle swarm optimization method (PSO) (Kennedy et al., 1995) is a feasible approach for this issue.
The remaining sections of this paper are arranged as follows. Section 2 gives an introduction to the fine-mesh subgroup method which is combined with the traditional subgroup method and ultra-fine method first; then, the process of choosing the group structure and finding the micro-level of the subgroup fixed-source problem is discussed. Finally, the feasible improvement in the group structure by PSO is introduced. Section 3 demonstrates the numerical verification of the FSM compared with traditional methods and presents a further discussion of possible improvements for the FSM. Section 5 provides the summary of this paper.
2 Methodological model
2.1 Basic theory of the subgroup method
Instead of defining the group structure by energy range, the subgroup method further divides the resonance group into several subgroups by the magnitude of the cross section. In this way, the variation of resonance peaks could be described by subgroup parameters, namely, subgroup levels and subgroup weights. According to the defining process, the subgroup level represents the magnitude of the cross section, and the subgroup weight indicates the width of the energy range of each subgroup. The subgroup method uses the subgroup parameters and subgroup flux to obtain the effective resonance cross section, which is shown in Eq. 1.
In Eq. 1, E represents the energy, σ represents the micro cross-section, x represents the reaction type, g is the group index, i is the subgroup index,
In the actual calculation process, the subgroup parameters could be calculated according to the relationships among the effective resonance cross-section, the subgroup parameters, and the subgroup fluxes shown in Eq. 1, and they could be stored in the multigroup library or calculated on-the-fly. The subgroup parameters used in this work are physical probability tables, and the methods for calculating them are also a research hotspot, which could be referenced by many papers (Joo et al., 2009; Zu et al., 2019; He et al., 2020; Li et al., 2021), so in this work, this process would not be illustrated in detail. Once the subgroup parameters are obtained, the subgroup fixed-source equation could be established, which is in the same formation as the Boltzmann transport equation and could be solved by a transport module such as MOC. As the overwhelming majority of the fission neutrons have energy above the upper limit of the resonance energy range, the fission source could be neglected for the subgroup fixed-source equations. Moreover, the upper scattering phenomenon is also negligible. Therefore, through the intermediate resonance approximation, the source item for the subgroup could be described just as a constant. In this case, the subgroup fixed-source equation is shown in Eq. 2.
In Eq. 2, Σt,g,i and Σs,g,i, respectively, indicate the macro subgroup total and scattering cross-section for group g and subgroup i. λ is the intermediate resonance approximation factor, and Σp is the macro potential cross-section. For the resonant nuclides, items for Eq. 2 are calculated according to the subgroup parameters. For the non-resonant nuclides, since their absorption and resonance scattering effects are small, Σt,g,i and Σs,g,i could be both replaced by λΣp. Through the aforementioned approximations, the subgroup transport equation could be easily solved by any type of transport program to obtain the subgroup flux, so the final effective resonance cross section could be obtained by Eq. 1.
2.2 Fine-mesh subgroup method
The basic idea of the FSM is to establish a finer mesh of the resonance range so that the implementation of the subgroup method no longer needs to consider the subsequent resonance interference correction calculation. To relieve the increasing calculation burden of the subgroup fixed-source equation brought by the fine mesh, the one-group micro-level approximation is adopted. Subsequently, the slowing-down equation for the fine-mesh resonance energy structure is solved to condense the effective resonance cross-section to a broader group structure, which is finally applied to the multigroup transport equation calculation. This section will focus on two main topics, namely, the determination process of the fine-mesh structure and the sensitivity of the subgroup calculation with one-group micro-level optimization.
2.2.1 Analysis of the fine-group structure
Since the conventional subgroup method only considers one resonant nuclide in the deduction process, the overlapping phenomenon for resonance peaks of different resonant nuclides could not be described accurately. Conventionally, by adopting a finer multigroup structure, the resonance peak inside a coarse resonance group could be impaired and make the results more precise. Therefore, if the subgroup method is carried out based on a fine enough energy structure, the calculation accuracy would be assumed to be the same level as that of the ultra-fine group method. However, selecting the fine group structure is the key issue to handle.
Compared with the commonly used multigroup structure such as WLUP-69 (Aldama, 2003) or HELIOS-47 structure (Stamm’ler, 2008), there are also some finer meshes proposed internationally, such as WLUP-172 (Aldama, 2003) and SHEM-281 (Hfaiedh, 2005). In Hébert et al. (2008), the energy range between 22.5 and 11.4 keV is optimized based on the SHEM-281 group structure, and the finer SHEM-361 group structure is proposed. The authors of this paper pointed out that by adopting SHEM-361, the subgroup method would not need the extra correction for the resonance interference effect, since the resonance cross section inside each energy group is flat enough for the subgroup method to handle. Then, the DRAGON5 program further modified the SHEM-361 structure to the SHEM-295 structure to increase the calculation efficiency but the accuracy is relatively sacrificed (Canbakan et al., 2015). Meanwhile, DRAGON5 put forward a 2-level scheme based on the subgroup method. In this method, the subgroup method is carried out based on the SHEM-295 structure, and then, the interface current method is used to get the fine-mesh flux to condense the group structure from 295 to 26 groups. Finally, the MOC is used for the 26-group structure for eigenvalue calculation.
The fine-mesh subgroup method (FSM) of this paper is proposed based on the aforementioned research, and the SHEM-361 group structure is optimized in this work for the fine-mesh calculation. For the optimized structure, the resonance range is adjusted and the resonance group number is increased. Different from the DRAGON which calculates the fine-mesh flux for the whole group structure, the FSM only calculates the flux for the fine-mesh resonance group by solving the neutron slowing-down equation, and the group condensation is also only carried out for resonance groups. Cross-sections for fast and thermal groups of the coarse mesh are provided by the pre-produced multigroup library.
The resonance range of the conventional multigroup structure such as WLUP-69 is 4–9,118 eV, which is accurate for typical UO2 problems. However, since actinide nuclides such as 242Pu also have significant resonance peaks near the thermal range, the lower limit of the resonance range in this work is extended to 1.8554 eV, which is the same as that of the HELIOS-47 group structure. Moreover, since resonance peaks of 238U play the most important role in the resonance interference effect, the fine mesh should make modifications, especially toward the distribution of 238U resonance peaks. Table 1 displays the energy points where the resonance peaks of typical actinide nuclides are. It could be found that 238U has resonance peaks nearly all over the resonance range, while other nuclides mainly focus on the energy range below 100 eV. Therefore, the overlap effect for smaller energy ranges is relatively more severe. In Hfaiedh et al. (2005) and Hébert (2009), the resonance peaks of common reactor component materials, such as 152Sm, 109Ag, 177Hf, and 155Gd, are also provided.
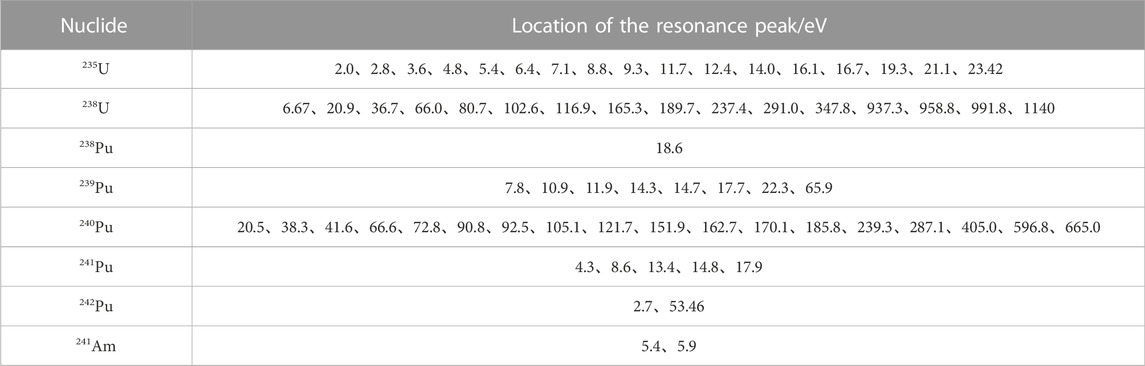
TABLE 1. Distributions of main resonance peaks of typical actinide nuclides.
It could be found from Table 1 that most of the resonant peaks of different resonant nuclides are around a relatively low energy range. Figure 1 shows the resonance peaks of 235U, 238U, and 239Pu near 6.7 eV. It is evident that 238U has a highly significant resonance peak in this range, so the effective cross-section would change sharply with the background cross-section. Under this condition, the space self-shielding and energy self-shielding effects would be very severe. However, the calculation process of subgroup parameters of the physical probability table does not consider the influence of background cross-section to each subgroup, so extra deviation may be raised. To address this issue, the energy between 1.8554 and 100.6 eV of the SHEM-361 structure is optimized in this work.
On the one hand, to get a precise effective cross-section around significant resonance peaks, a further discrete of the energy group between 22.5 and 100.6 eV is carried out. The resonance peaks in this range are divided into multiple resonance groups, and the key nuclide taken into consideration is 238U. In this way, the deviation trend of the resonance cross-section with background cross-section is weakened to be similar to that of the un-resolved resonance range, so that only 2–3 subgroups would be accurate enough to describe the self-shielding effect of the new resonance group. On the other hand, the SHEM-361 structure deploys a very meticulous discrete below 22.5 eV, and the resonance calculation is not conducted in this range. Since the lower limit of the resonance range is extended to 1.8554 eV in this work, the SHEM-361 structure between 1.8554 and 22.5 eV could be merged. In addition, for energy ranges around 2.7 and 6.7 eV where the resonance peaks are widely distributed, the original fine structure is reserved to ensure the calculation accuracy. Finally, compared with the SHEM-361 structure, the newly optimized structure between 1.8554 and 100.6 eV is shown in Table 2.
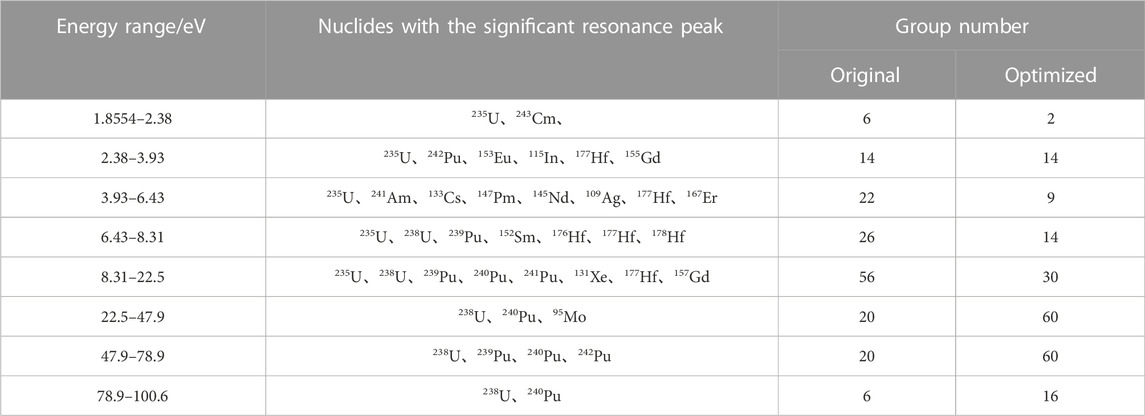
TABLE 2. Optimized group structure for the energy range of 1.8554–100 eV.
In general, the process of energy structure optimization mainly follows two principles. First, the distribution of resonance peaks should be described in detail. Second, the group boundary should be set to be feasible for group condensation to commonly used coarse group structures such as WLUP-69 or HELIOS-47. By introducing the subgroup calculation to the energy range of 1.8554–22.5 eV, the group number of this range is reduced from 124 to 81. For energy between 22.5 and 100.6 eV, further discreteness makes the group number increase from 46 to 136. The resonance range of this work is 1.8554–9,118 eV. The SHEM-361 structure has 242 groups in total in this range, while the optimized structure has 289 groups. Meanwhile, the fast group and thermal group still adopt the original SHEM-361 group, so the total group number of the new structure is 408.
To enhance the efficiency of the multigroup transport calculation, the resonance fine-mesh cross-section needs to be condensed. According to Kim et al. (2011) and Li et al. (2020), for the neutron slowing-down equation, the source item of the resonance group could be simplified as the down-scattering source. As the lethargy width of the FSM is not as narrow as the ultra-fine group, the down-scattering source will be calculated by the scattering matrix, and the slowing-down equation of the FSM is shown in Eq. 3. Similar to the ultra-fine slowing-down equation, the flux of Eq. 3 could be solved group by group and the flux of the fast groups could be considered as the asymptotic flux. Finally, the effective multigroup resonance cross section is calculated by Eq. 4.
2.2.2 Analysis of one-group micro-level optimization
The subgroup method used in this work is the physical subgroup approach, and the subgroup parameters are generated by preserving resonance integrals. The subgroup parameters of this work are in the form of the probability table, which is obtained by fitting the resonance integrals for different background cross-sections. The commonly used fitting methods include the Pade approximation method and the least square method. However, during the calculation process of subgroup parameters, there is a notable shortcoming in the negative subgroup parameters that may occur for certain selections of resonance integrals. The traditional multigroup library only has 10 background cross-sections for resonance integrals, which is not enough to select the optimal combination that meets the accuracy requirement. To avoid this situation, the multigroup library used for the FSM is adapted to have 40 sets of background cross-sections from 10 bar to 1010 bar, which is shown in Table 3. In addition, the resonance tables used in this work are homogeneous ones that are generated by the NJOY-2016 code.
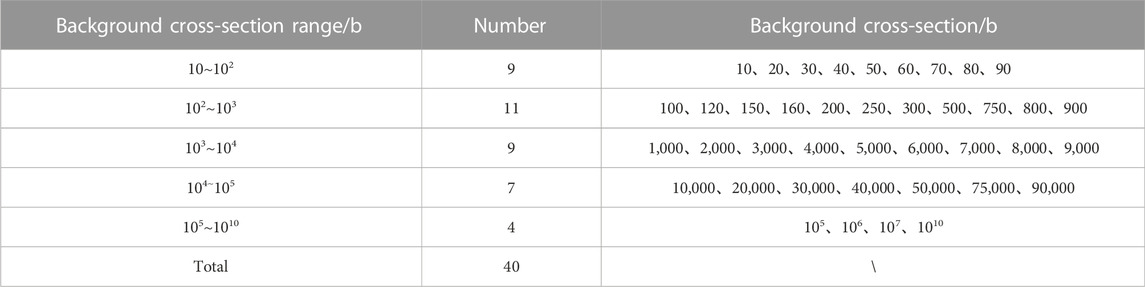
TABLE 3. Background cross sections of resonance integral.
The subgroup group number used in this work is limited from 2 to 5, and each resonance group is calculated starting from two subgroups. If the relative error shown in Eq. 5 is too large for all combinations of background cross-sections, the number of subgroups will be added by one and the calculation procedure will be repeated for the new subgroup number. If the subgroup number is increased to the maximum, then the criterion will be added by 0.1%.
For conventional subgroup methods, the subgroup fixed-source problems would be solved for all subgroups in all resonance groups. However, it would result in a large amount of computation once the number of the resonance group increases. To avoid this phenomenon, the one-group micro-level optimization is adopted in this work. All resonance groups are averaged as one effective group by Eq. 6.
In Eq. 6,
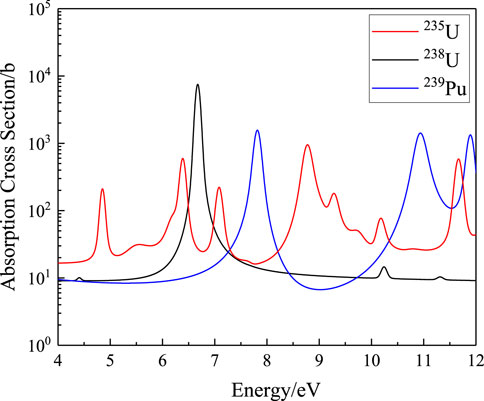
FIGURE 1. Variation curve of the absorption cross-section for 235U, 238U, and 239Pu around 6.7 eV.
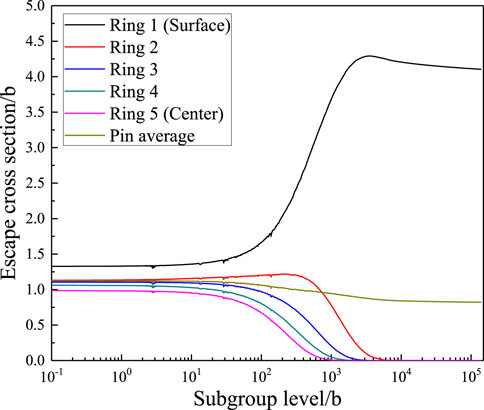
FIGURE 2. Variation trend of the escape cross-section by the subgroup level in different regions (Li et al., 2020)
According to Figure 2, it could be found that the subgroup level influences the escape cross-section at the surface area most. Therefore, to analyze the interpolation accuracy for the subgroup flux and find the best choice of interpolating subgroup levels, the following procedure is carried out.
1) Between the subgroup level range of 1∼105 b where the value of the escape cross-section dramatically changes, 500 subgroup levels are selected by an equal proportion.
2) A series of single-cell problems are designed according to Table 4. The base case is a fuel pin surrounded by light water, which is shown in Figure 3. For simplification, the clad and gas gap are neglected. The number density and geometry parameters are referenced from the JAEA benchmark (Yamamoto et al., 2002). For the base case, the fuel pin radius is 0.4095 cm, the half pitch of the cell is 0.63 cm, and the fuel is composed of 238U and 16O, of which the number density is 0.0204×1024 cm−3 and 0.046×1024 cm−3, respectively. The moderator is composed of light water whose number density is 0.03315×1024 cm−3. The system temperature is 300 K with the reflective boundary condition.
3) All the subgroup levels defined in step (1) are used in the geometry defined in step (2), and the fuel pin is divided into 5, 10, and 15 rings, respectively. Then, the MOC transport module (Song et al., 2019) is used to solve the subgroup fixed source equation shown in Eq. 2 of these problems, so the subgroup fluxes for different subgroup levels in different regions are obtained.
4) Several subgroup levels are chosen between 1∼105 b from step (1), and then step (2) is repeated only for chosen subgroup levels to calculate the subgroup flux. For other unchosen subgroup levels, the subgroup fluxes are obtained by interpolating among the chosen ones. In this work, the number of chosen subgroup levels is 4–13, and the value range of the subgroup levels for each condition is shown in Table 5.
5) The interpolated subgroup fluxes of step (4) were compared with those directly calculated by step (5), and the interpolating bias was analyzed. The root-mean-square (RMS) deviation of all regions and all subgroup levels is shown in Figure 4. Apparently, the interpolating bias decreases sharply with the increase in the interpolating number, and the RMS tends to remain stable after eight interpolating subgroup levels. In this way, the subgroup level used in the one-group subgroup-level fixed-source equation is chosen as 10, 100, 200, 300, 500, 1,000, 2,000, and 10,000 b, respectively.
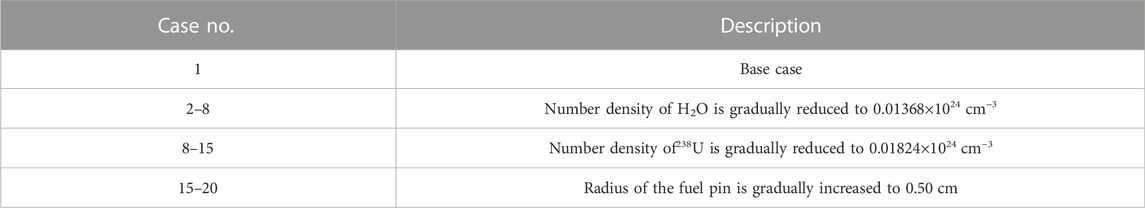
TABLE 4. Design of the single-cell cases.
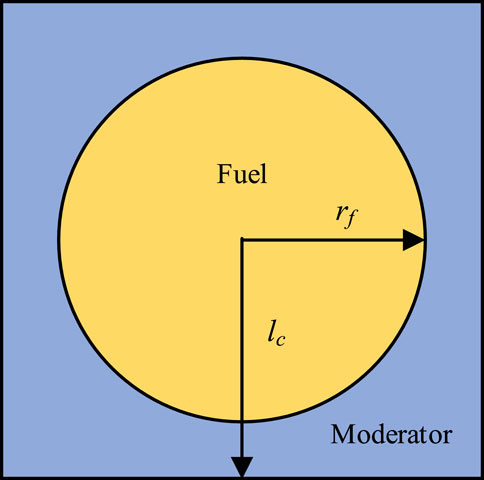
FIGURE 3. Structural configuration of the single-cell case.
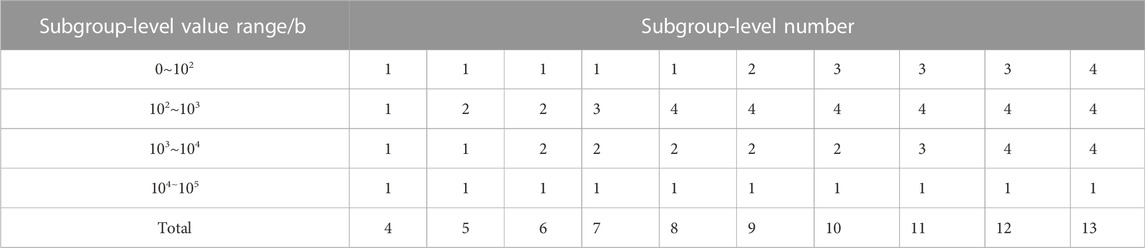
TABLE 5. Subgroup-level values chosen for each interpolating condition.
2.3 Feasible improvement of the FSM
The FSM still has some aspects for possible improvement, and one of the most dominant parts is the group number of the multigroup transport problems. As this process accounts for the most calculation time, it is useful to reduce the final group number. Since the FSM has 408 group meshes, any combination of energy points could establish a new multigroup structure, and it is necessary to find the best selection. In this paper, the particle swarm optimization method (PSO) (Kennedy et al., 1995) is adopted for group structure optimization.
The main theory of PSO is shown later (Kennedy et al., 1995; Li et al., 2021). PSO defines a series of particles with different positions and velocities and uses the fitness function to describe the error between the aim value and the current value. There are two parameters to describe the condition of a particle, namely, the particle position
In Eq. 8–9, i is the particle index; j represents the dimension of the particle; t is the generation index; w is the inertia weight; c is the acceleration constant, which gives random values between 0 and 2; and r is the random value between 0 and 1. In addition, the velocity and position should be limited to the pre-determined value range.
Since the particle position is composed of a multidimensional variable, each dimension represents an energy mesh in this work. In this way, different particles indicate the different energy structures. As the particle moves in a certain velocity, the position would be changed and the energy structure is changed accordingly. After one step of movement, the particles would communicate with each other about each individual group structure and the error of eigenvalue calculations. Afterward, all particles would move to the best position particle with each certain velocity and the aforementioned process would be repeated until the error reaches the requirement. In addition, there are also some existing research studies relevant to energy structure optimization based on PSO (Akbari et al., 2012; Yi et al., 2013; Edgar et al., 2015), which could provide a useful reference for this work. Overall, the process of searching for the optimized group structure is shown as follows:
1) The particle position
2) Since the particle coordinate value represents a series of group boundaries, so the group condensation is carried out for each particle. For total absorption and fission cross-section, the condensation formula follows Eq. 4. For the scattering matrix, the condensation rule is shown as in Eq. 10.
In Eq. 10, h’ and h are the group indexes of the coarse mesh and g’ and g are those of the fine mesh. h1 and h2 are the upper and lower limit of fine-mesh group index corresponding to the group h of the coarse mesh, respectively. h1 and h2 are the upper and lower limits of fine-mesh group index corresponding to the group h of the coarse mesh, respectively. l is the Legendre order number.
3) The effective multiplication factor keff was calculated using the coarse mesh cross-section obtained previously. The calculation results were offered as the fitness function
4) The
3 Numerical verification
To analyze the accuracy of the resonance cross sections, the FSM adopts the multigroup library format of the HELIOS-1.11 code, of which the number of the fast, resonance, and thermal group is 9, 16, and 22, respectively. The fine mesh of the FSM has 289 resonance groups from 1.8554 to 9,118 eV. A series of benchmarks containing UO2, MOX, Gd-bearing problems, and control rod problems are used to test the performance of the FSM, and the reference value is provided by the continuous energy Monte Carlo code MCNP5 (X-5 Monte Carlo Team, 2003). The ultra-fine group method (UFG) and the traditional subgroup method with the Bondarenko iteration method (BIM) for the resonance interference effect are applied to compare the calculation results of the FSM. The group structure of the BIM is the HELIOS-47 structure, which is the same as the second group mesh of the FSM. The UFG method has 34,000 groups for the resonance range. After the effective resonance cross-sections are obtained, the UFG would condense the group structure to the HELIOS-47 structure to carry out the eigenvalue calculation. The MCNP code has 100,000 particles for each problem, and 300 iterations excluding the first 50 are adopted to obtain the reference results. The library type of all the methods in this work is ENDF/VII.0. The MOC parameters of the FSM, BIM, and UFG are set as three polar angles and 16 azimuthal angles per octant, 0.01 cm ray spacing Tabuchi–Yamamoto quadrature (Yamamoto et al., 2007) for single-cell problems, and 0.03 for lattice problems. Moreover, the transport correction method in this work is the inflow correction method, which is referenced from Choi et al. (2015). Given the limited space of this study, the transport correct method will not be discussed in detail.
The contents of numerical verification are arranged as follows: Section 3.1 gives a brief induction to the BIM and UFG. Section 3.2 displays the calculation results of the single cell and 17 × 17 lattice problems consisting of typical UO2. To analyze the calculation capability for complex conditions, Section 3.3 and Section 3.4 show the results of the Gd-bearing problem and problems with strong absorbers, respectively. Section 3.5 analyze the calclating efficiency. Finally, Section 3.6 gives the further discussion of feasible improvement by PSO group structure optimization.
3.1 Brief induction for the BIM and UFG
3.1.1 BIM
BIM is the classical approach for the resonance interference effect. If there is more than one type of resonant nuclide, the BIM will solve the subgroup transport equations using each resonant nuclide. When handling the current resonant nuclide, the resonance cross-sections of other resonant nuclides in Eq. 2 are still unclear. Therefore, the BIM gives all the resonant nuclides an initial effective resonance cross-section before the subgroup calculation. In this case, when carrying out the subgroup transport calculation of the current resonant nuclide, the other resonant nuclides will be regarded as non-resonant nuclides, and the macro total cross section of Eq. 2 is obtained by Eq. 11:
where R indicates the current resonant nuclide, M indicates the total number of non-resonant nuclides, and L is the total number of all nuclides.
First, the initial effective resonance cross-section is used to solve the subgroup transport equations to obtain the effective resonance cross-section of the current resonant nuclide. Once this process is completed for all resonant nuclides, the newly obtained resonance cross- section will replace the initial effective resonance cross-section and the aforementioned calculation process will be carried out again until the iterating bias of the effective resonance cross-section converges.
3.1.2 UFG
The UFG method applied in this section is referenced from Kim et al. (2011) and Zhang et al. (2020). If the total number of all nuclides in the calculation system is L, the slowing-down equation for the resonance energy range is shown as follows:
where α is obtained by (A-1)2/(A+1)2; A is the atom mass; u is the lethargy; and Δl = ln (1/α), which indicates the maximum lethargy increase after one collision. The ultra-fine group number is 34,000 in this work. For group g, the source item of Eq. 12 is shown as
where Pn,l is the probability for a neutron scatters over n ultra-fine groups and finally locates in group g after a collision with nuclide l. Δuf is the lethargy width. Nl is the maximum number of ultra-fine groups covered by down-scattering. Kim et al. (2011) and Zhang et al. (2020) give the recursive calculation method for Pn,l, which is shown in Eq. 14.
Therefore, according to Eq. 14, the scattering source could be expressed as follows:
By comparing Eqs. 14, 15, the recursive expression for the scattering source could be derived as
In this work, the fission source and up-scattering effect are neglected in the resonance energy range. In addition, the scattering source for the first resonance group could be calculated by asymptotic flux, which could be expressed as 1/E for the pressurized water reactor. Therefore, the neutron flux of the first ultra-fine resonance group can be obtained by solving a fixed source equation. Subsequently, the flux of the first group could be used to obtain the scattering source of the second group by Eq. 16, and the same procedure will be repeated for all the following groups until the flux of the last group is obtained. Since the ultra-fine group structure is not suitable for eigenvalue calculation, the group condensation process is adopted, which is similar to the FSM. The final effective multigroup resonance cross-section is also calculated by Eq. 4.
3.2 Typical UO2 problem
3.2.1 Single cell
The VERA benchmark (Godfrey et al., 2013) released by the Ork Ridge National Laboratory is adopted in this section. The geometry configurations of the single cell and 17
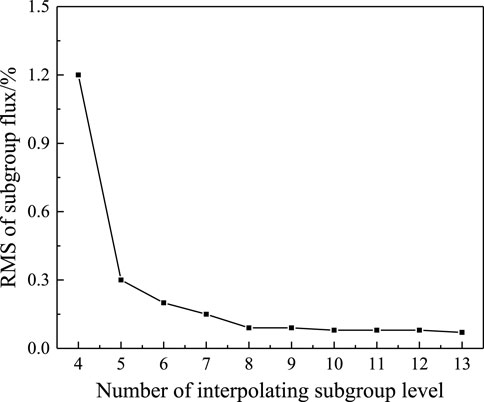
FIGURE 4. Variation trend of RMS for the subgroup flux by the interpolating number of subgroup levels.
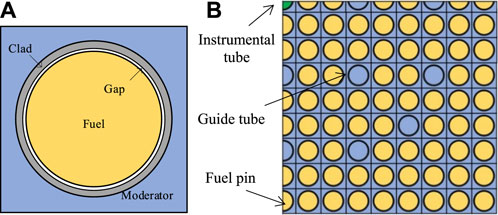
FIGURE 5. Structural configuration of the VERA benchmark: (A) single cell and (B) 1/4 lattice.
For single-cell problems, VERA 1A∼1D cases are calculated. The enrichment of these problems is 3.1 wt%, the fuel density is 10.257 g cm−3, and the boron concentration is 1,300 ppm. These four problems have different fuel temperature, moderator temperature, and density, so it could be a test for the FSM to treat the resonance effect under different conditions. In addition, to test the performance of highly enriched UO2 fuel simulations, two UO2 pin cell problems of which the enrichment is 20 wt% and 75 wt% are also analyzed in this section. The latter two highly enriched fuels are referenced from the cold-stated UO2 problem of Yamamoto et al. (2002), but the enrichment is adjusted to 20 and 75 wt%, respectively. It should be noted that the highly enriched fuel is not commonly used for commercial nuclear reactors, so this is only a calculating capability test for the FSM. Table 6 gives the calculation results of keff. For conventional VERA cases, it was found that the keff error of the FSM is within ±50 pcm for all problems, while that of the traditional BIM is more than 200 pcm. For highly enriched problems, the error of keff increases to some extent for all methods, while the FSM still has a relatively satisfactory accuracy.
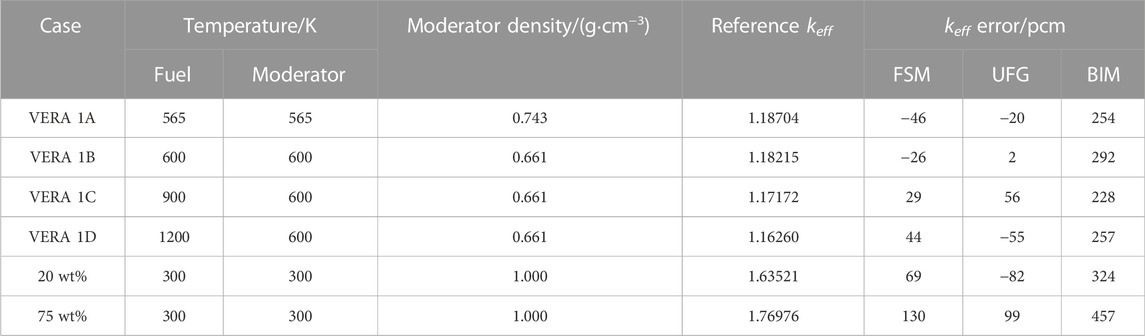
TABLE 6. Calculation results of keff for VERA single-cell problems.
Taking the 1B case as an example, Figure 6 displays the calculation results for pin-averaged absorption cross-section of 238U, and Figure 7 gives the results for absorption and fission production of 235U. It was observed that the FSM and UFG could keep the relative error within ±1% nearly for all groups, while the variation of the BIM is not acceptable. The maximum error, average, and root-mean-square relative error of cases 1B and 1C are shown in Table 7.
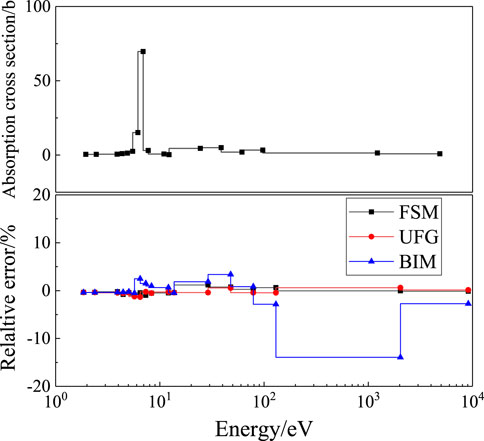
FIGURE 6. Relative deviation of the absorption cross-section for 238U for the VERA 1B case.
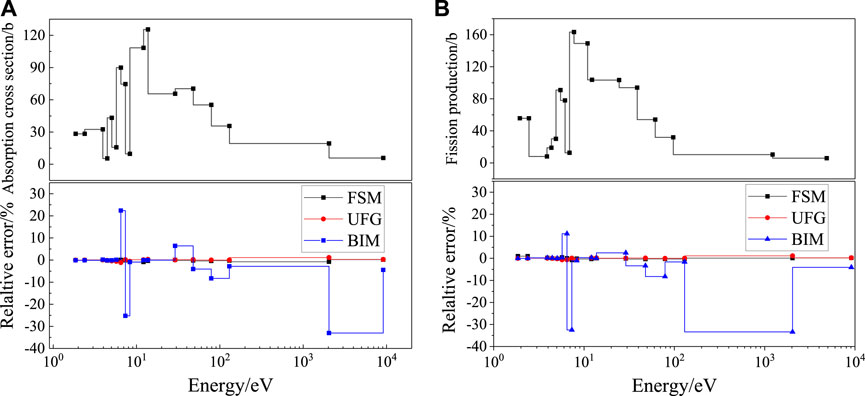
FIGURE 7. Relative deviation of the cross-section for 235U for the VERA 1B case: (A) absorption; (B) fission production.
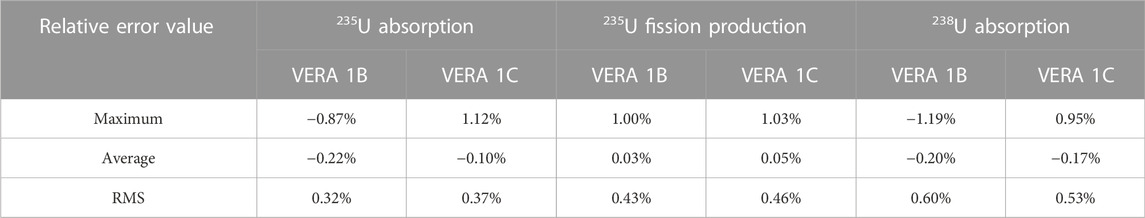
TABLE 7. Calculation results of the resonance cross section for VERA 1B and 1C cases.
For the high-enriched fuel problems, taking the 75 wt% case as an example, Figure 8 displays the calculation results for pin-averaged absorption cross-section of 238U, and Figure 9 gives the results for absorption and fission production of 235U. The FSM and UFG could keep the relative error nearly within ±1.5% for all groups, while the variation of the BIM is much larger. Due to the strong self-shielding effect of the highly rich fuel, the error increased slightly compared with the conventional fuel. The maximum error, average, and root-mean-square relative error of cases 1B and 1C are shown in Table 8, of which the accuracy is still acceptable.
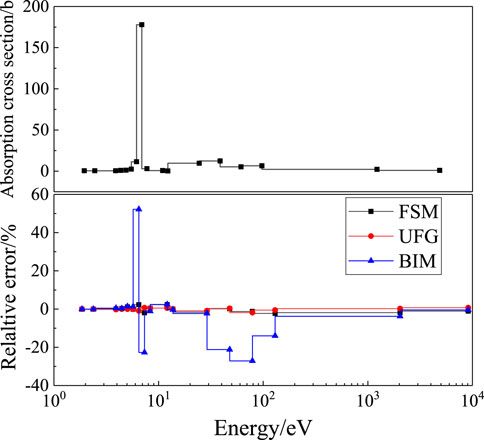
FIGURE 8. Relative deviation of the absorption cross-section for 238U for the 75 wt% case.
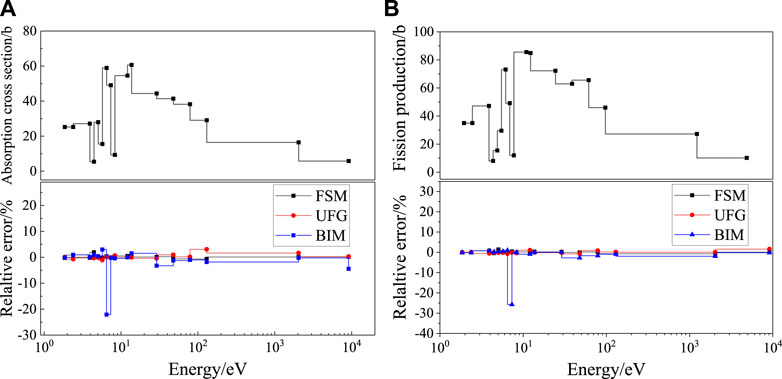
FIGURE 9. Relative deviation of the cross-section for 235U for the 75 wt% case: (A) absorption; (B) fission production.
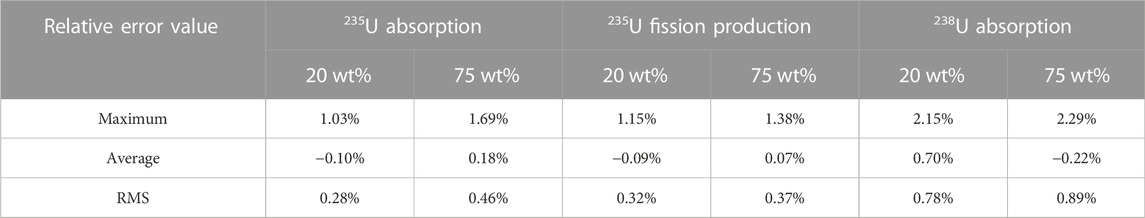
TABLE 8. Calculation results of the resonance cross section for 20 and 75wt% cases.
3.2.2 17 × 17 lattice
In this section, VERA 2A∼2D are selected to verify the capability of the FSM to lattice problems. These lattices have 264 fuel pins, 24 guide tubes, and one instrumental tube, which are shown in Figure 5. Taking 2B and 2C problems as examples, the distribution of normalized pin power calculated by the FSM is shown in Figures 10, 11, respectively. It could be observed that the relative error of normalized pin power is less than 0.5% for most fuel pins. The largest relative error of VERA 2B and 2C problems is 0.67 and 0.65%, respectively, which indicates an accurate performance for the FSM.
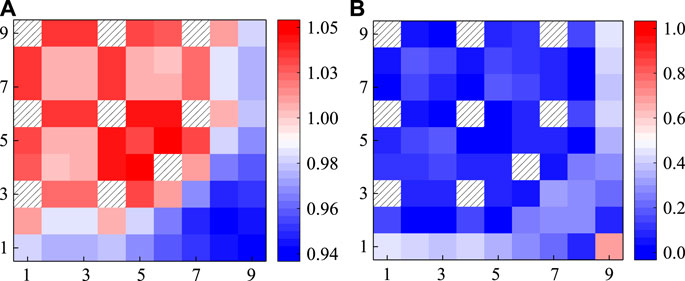
FIGURE 10. Calculation results of pin power of the VERA 2B lattice: (A) referenced normalized pin power; (B) absolute value of relative deviation/%.
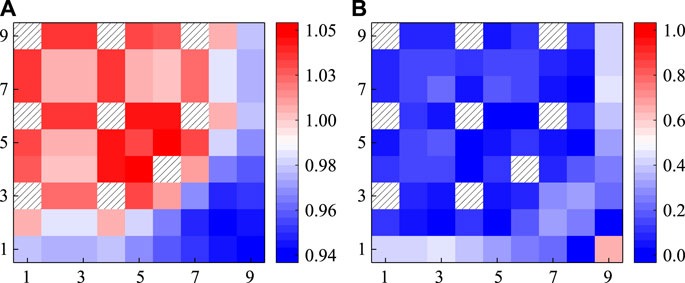
FIGURE 11. Calculation results of pin power of VERA 2C lattice: (A) referenced normalized pin power; (B) absolute value of relative deviation/%.
In addition, it could be observed that the maximum deviation was always observed at the lower right corner. There are two main reasons why the maximum deviation is always observed at the lower right corner. First, the power value of the corner is always the smallest one in the lattice, so the relative error may rise to some extent. The second one is that for the original VERA benchmark, there is a very small inter-assembly gap that exists between all assemblies containing the core moderator, and the half-gap thickness is 0.04 cm Due to the limit of the modeling capability, the transport module in this work could not directly consider the inter-assembly gap. To make up for this limit, the inter-assembly gap is homogenized to the outermost cell of the lattice. This homogenization process may cause the calculation bias to the outermost cell, so the maximum deviation is always observed at the lower right corner. Since the relative error is still small enough, this deviation is acceptable for lattice calculation.
The overall calculation results of pin power and effective multiplication factor for VEAR 2A∼2D are shown in Table 9. The maximum, average, and root-mean-square relative error of normalized pin power all meet the precision requirement. For the effective multiplication factor, the maximum error is 74 pcm for the 2B problem, which is still accurate. To sum up, the FSM has excellent performance both for UO2 single-cell and lattice problems.
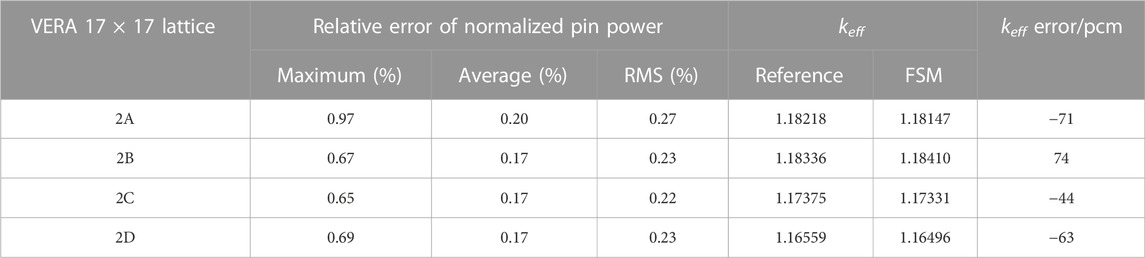
TABLE 9. Calculation results for VERA lattice problems.
3.3 Gd-bearing problem
To control the reactivity, burnable poison such as Gd2O3 could be added to the fuel pin. Gd isotopes have strong absorption characteristics and significant resonance peaks, so the Gd-bearing problem is a challenging issue for resonance calculation. Figure 12 gives the geometry configuration of the BWR 4 × 4 lattice (Hong et al., 1998), VERA 2O, and 2P lattice. The BWR lattice has two pins consisting of 3wt% UO2 and Gd2O3, and the others are 3wt% UO2. VERA 2O and 2P have 12 and 24 Gd-bearing fuel pins, respectively, which are located in the region marked by O andP in Figure 12. Since the flux in the Gd pin changes dramatically along the radius direction, the Gd pin is divided by 10 equal-volume rings, while the UO2 pin is divided by three rings. Moreover, each ring is further divided into eight equal-volume sectors.
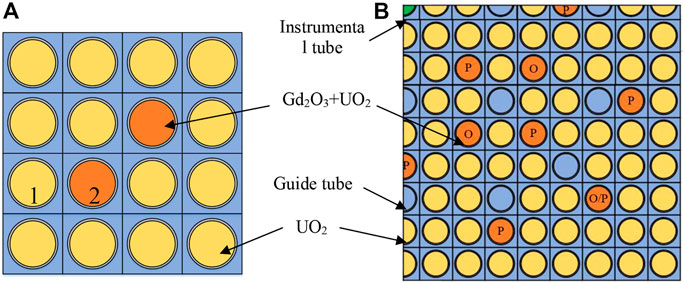
FIGURE 12. Structural configuration of the lattice with gadolinium pins: (A) BWR 4 × 4; (B) VERA 2O/2P.
The calculation results of the 238U resonance absorption cross-section of 238U for UO2 pin 1 and Gd-bearing pin 2 are shown in Figure 13A. The largest relative error of pin 1 and pin 2 is 0.91% and −2.24%, respectively. Compared with the conventional UO2 pin, the calculation bias for the Gd-bearing pin is increased to some extent. Figure 13B gives the resonance absorption cross-section of 155Gd and 157Gd in pin 2, and the largest error is −1.59% and 2.13%, respectively. The calculation on the whole is shown in Table 10. The strong resonance absorption of Gd isotopes makes the precision of the Gd-bearing pin has a relatively larger error compared with conventional problems, but is still acceptable on the whole. The reference keff of 4 × 4 lattice is 1.08589, the calculation result is 1.08652, and the error is 63 pcm.
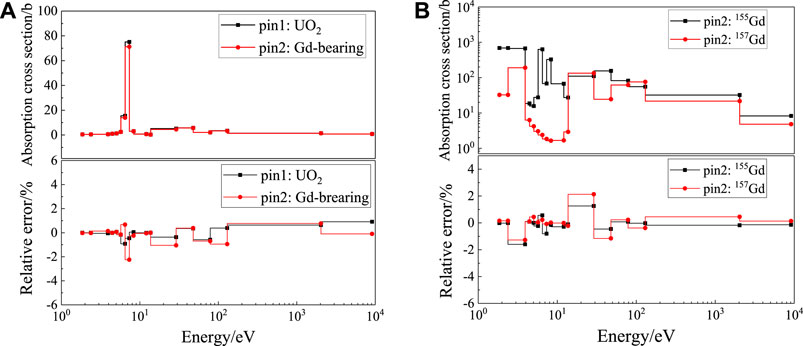
FIGURE 13. Relative deviation of absorption cross section for the 4 × 4 lattice: (A) 238U; (B) 155Gd and 157Gd.
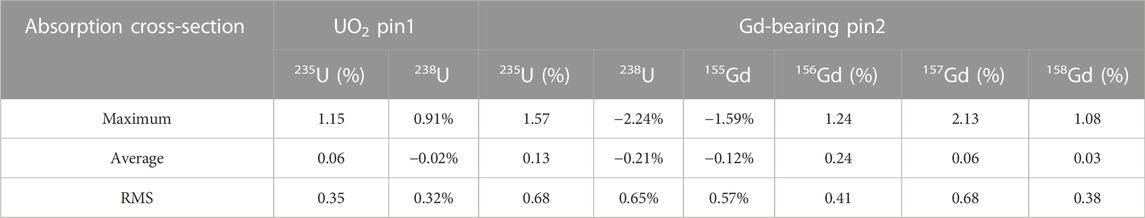
TABLE 10. Calculation results of the resonance cross-section of pins 1 and 2 of 4 × 4 lattice.
Figures 14, 15, respectively, show the calculation results of the normalized pin power of VERA 2O and 2P. For most of the regions, the absolute value of the relative error of pin power is less than 0.5%. The error near the Gd-bearing pins would increase a little, but the largest error of 2O and 2P are still acceptable, which are 1.43% and 1.91%, respectively. The general calculation results of pin power and keff are shown in Table 10, which indicates that FSM could handle the Gd-bearing problems accurately.
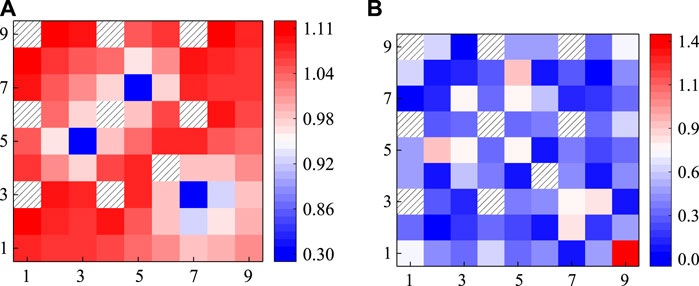
FIGURE 14. Calculation result of pin power of the VERA 2O lattice: (A) referenced normalized pin power; (B) absolute value of relative deviation/%.
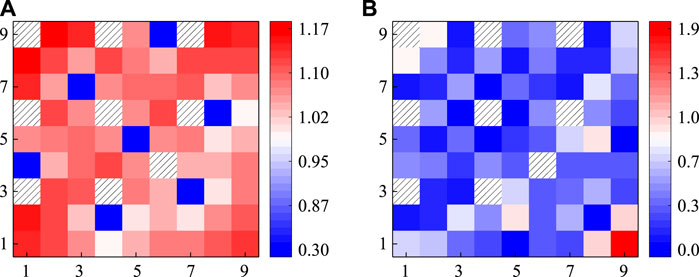
FIGURE 15. Calculation result of pin power of the VERA 2P lattice: (A) referenced normalized pin power; (B) absolute value of relative deviation/%.
3.4 Strong absorber problem
In addition to the Gd-bearing rod, the reactivity could also be controlled by inserting strong absorbers into the guide tubes, such as the Pyrex rod or control rod, which are shown in Figure 16. The strong absorber would dramatically influence the neutron flux and raise challenges to the resonance calculation. In this section, VERA 2F, 2G, and 2H problems are selected to verify the capability of the FSM to strong absorber problems. The geometry configuration of these two problems is similar to Figure 5B, and the only difference is the guide tubes that are inserted by Pyrex rods, AIC control rods, and B4C control rods for 2F, 2G, and 2H, respectively. The Pyrex or control rod is divided by 10 equal-volume rings, while the UO2 pin is divided by three rings. Moreover, each ring is further divided into eight equal-volume sectors.
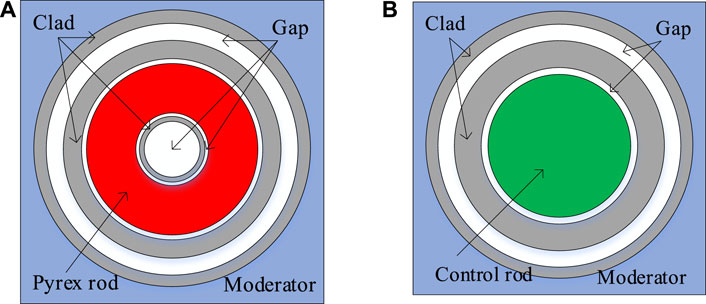
FIGURE 16. Structural configuration of the rod with strong absorber: (A) Pyrex rod; (B) control rod.
Figures 17–19 display the calculation results of normalized pin power of VERA 2F, 2G, and 2H, respectively. The distribution of pin power tends to be flat in the lattice center but increases evidently near the lattice surface area. The fuel pin beside the guide tubes with a strong absorber has the lowest pin power. For 2F and 2H, the FSM has satisfactory calculation results for both two problems and the relative error for most fuel pins is less than 0.5%. For 2G, the average error increases to 0.74%. The largest relative error of 2F, 2G, and 2H is 0.75, 1.47, and 1.07%, respectively. Since AIC has a very strong absorption effect, the error of VERA 2G is relatively larger than that of the others, but the precision on the whole is still acceptable. The general calculation results of pin power and keff are shown in Table 11, which indicates that the FSM could handle the strong absorber problems accurately.
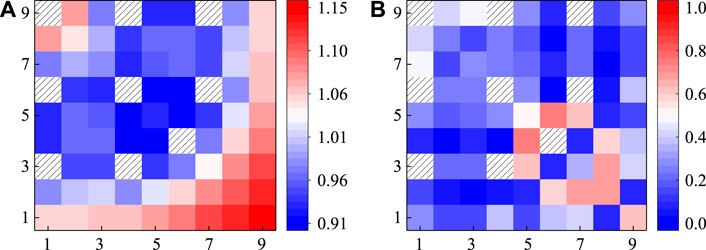
FIGURE 17. Calculation results of pin power of the VERA 2F lattice: (A) referenced normalized pin power; (B) absolute value of relative deviation/%.
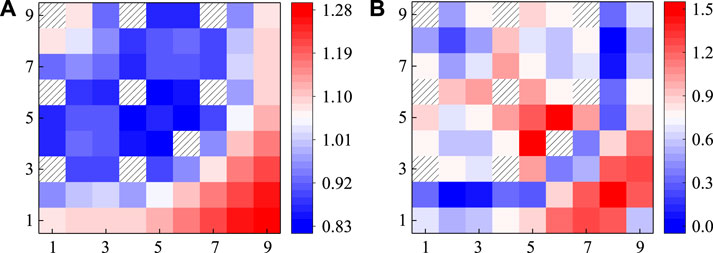
FIGURE 18. Calculation results of pin power of the VERA 2G lattice: (A) referenced normalized pin power; (B) absolute value of relative deviation/%.
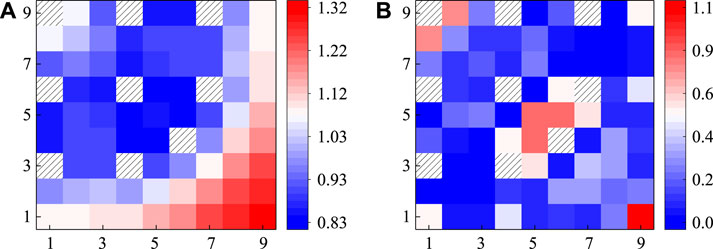
FIGURE 19. Calculation results of pin power of VERA 2H lattice: (A) referenced normalized pin power; (B) absolute value of relative deviation/%.
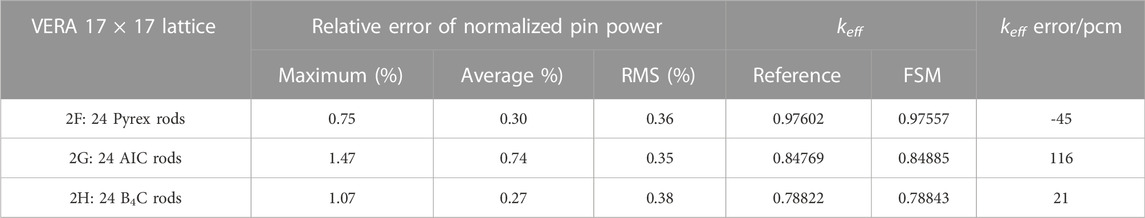
TABLE 11. Calculation results for VERA 2F, 2G, and 2H lattice problems.
3.5 Analysis of calculation efficiency
Compared with the conventional subgroup method, the group structure of the FSM is optimized to fine mesh according to the basic idea of the ultra-fine group method. The two-level discrete with fine mesh and subgroup structure makes the FSM capable of handling more complex resonance interference effects accurately. In essence, the FSM is the compromise between precision and efficiency. It has the same level of accuracy as the UFG and addresses the limitations that the conventional subgroup method does not have the capability for complex problems. In general, the FSM sacrifices part of the calculation efficiency reasonably to achieve higher accuracy.
The calculation efficiency could be reflected by the number of subgroup fixed-source equations and slowing-down equations. Taking the fresh UO2 problem and its depletion condition as examples, Table 12 shows the calculation burden for different resonance treatment methods. It could be observed that the UFG needs to solve the 34,000 ultra-fine group slowing-down equation for all problems, so the calculation efficiency is the worst. The BIM needs to solve the subgroup fixed-source equation of each resonant nuclide. Iteratively, the total calculation burden increases linearly by the number of resonant nuclides. The FSM adopts the one-group micro-level optimization, so the burden of the subgroup fixed-source equation is far less than that of BIM. Moreover, the FSM has 289 slowing-down equations to solve, and it is independent of the problem condition. Therefore, for the fresh UO2 problem, the total calculation burden of the FSM is more than that of BIM. However, for the depletion condition, since the number of resonant nuclides increases, seven resonant nuclides are treated as resonant nuclides. Under this condition, the calculation burden of the FSM and BIM is almost the same. If the resonant nuclide number continues to increase, the efficiency of the FSM would be better while the accuracy is also higher. The CPU information in this section is AMD Ryzen7 4800H 2.90 GHz 1 CPU is used. For the fresh UO2 problem, the calculation time consumed by the FSM, BIM, and UFG is 4.85 s, 2.76 s, and 347.5 s, respectively. For the depletion condition, the calculation time consumed by the FSM, BIM, and UFG is 7.67, 7.26, and 527.1 s, respectively On the whole, compared with the conventional BIM and UFG method, the FSM proposed in this work could handle the resonance effect accurately and efficiently.
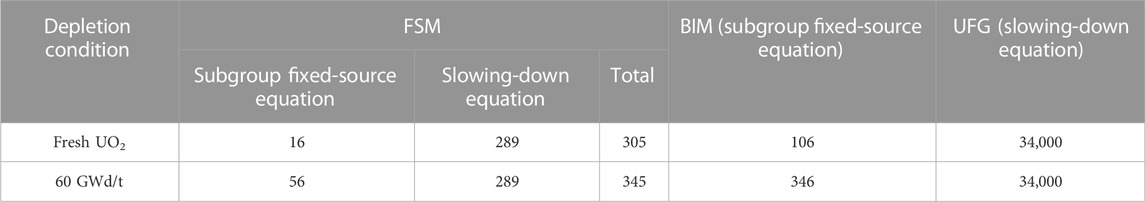
TABLE 12. Calculation burden for different resonance treatment methods.
3.6 Further discussion of feasible improvement
Based on the PSO theory introduced in Section 2.3, a new energy structure with 19 groups in total is proposed. Compared with the original FSM, the improved FSM has four fast groups, 11 resonance groups, and four thermal groups. The fine resonance mesh would be condensed to 11 groups, while the data of the fast and thermal regions are provided by the NJOY code. Since the PSO is carried out before the eigenvalue calculation, its results are stored in the multigroup library as the input information. Therefore, although the PSO method may suffer from the inefficiency problem, it is a “one-off” work. Once it has been conducted, the optimized group structure could be used for all problems without further burden.
To test the performance of the new structure, six problems consisted of JAEA UO2 and MOX of three temperatures, respectively. The calculation results of two versions of the FSM are shown in Table 13.
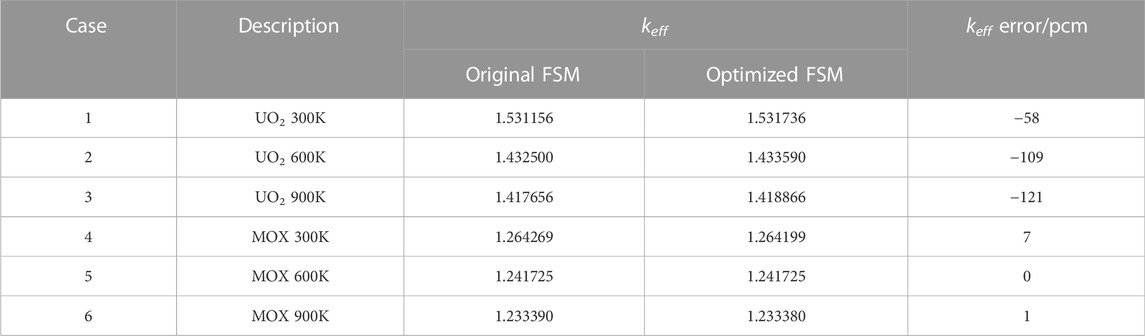
TABLE 13. Calculation results for UO2 and MOX problems with the optimized FSM.
From Table 13, the new FSM has an acceptable difference in eigenvalue accuracy but has far fewer group numbers for transport calculation, which would make a significant improvement in efficiency. However, it should be noticed that the fine-mesh structure of the FSM also accounts for plenty of calculation burden. The PSO method could also be applied to searching for the optimized fine structure with as few groups as possible. In addition, it could be found that the UO2 problems in Table 13 have more deviations than MOX cases. The errors of MOX and UO2 cases mainly result from the following reasons:
First, the group condensation process inevitably enlarges the deviation since the coarse group structure would make the self-shielding effect not comprehensively considered. The group structure selected may not be the proper one for all problems. Second, the fitness function in this work only considered the accuracy of keff, while the other important parameters, such as reaction rate and neutron flux, are not taken into account. This thoughtlessness might cause unexpected errors in practical application. Third, the fitness function selected several typical problems as the calculation samples. In other words, the Gbest is found according to a finite number of fuel conditions, so the extension to all conditions may cause deviations. Therefore, further research is still needed for the amendment of the new FSM based on PSO optimization.
4 Conclusion
The fine-mesh subgroup method (FSM) and its feasible improvement are illustrated in this paper. The FSM adopts the two-level discretion consisting of the fine mesh and the subgroup to guarantee the accuracy of the resonance cross-section and the resonance interference correction could be avoided. In addition, the FSM uses the one-group micro-level optimization and the subgroup fixed-source equations are only solved eight times for each resonant nuclide. Afterward, the neutron slowing-down equation is applied to get the spectrum for group condensation. To find the proper group structure for the multigroup transport calculation, the particle swarm optimization method (PSO) is used and the 19-group structure is proposed. Similarly, PSO could also be applied to find the optimized fine-mesh structure of the FSM and further work is needed.
Data availability statement
The raw data supporting the conclusion of this article will be made available by the authors, without undue reservation.
Author contributions
SL, QZ, and LL proposed the research point, conducted the program coding and manuscript writing. YZ and JH supervised this study. XW, LJ, and XL participated in the work of the formula derivation. All the authors contributed to the manuscript’s supervision and revision.
Funding
This work is supported by China Postdoctoral Science Foundation grant 2022M48884, the National Natural Science Foundation of China grant 12105063, the Science and Technology on Reactor System Design Technology Laboratory grant HT-KFKT-24-2021011, the Stability Support Fund for Key Laboratory of Nuclear Data grant JCKY2021201C154, and the project of Young Talents of China National Nuclear Corporation.
Conflict of interest
The authors declare that the research was conducted in the absence of any commercial or financial relationships that could be construed as a potential conflict of interest.
Publisher’s note
All claims expressed in this article are solely those of the authors and do not necessarily represent those of their affiliated organizations, or those of the publisher, the editors, and the reviewers. Any product that may be evaluated in this article, or claim that may be made by its manufacturer, is not guaranteed or endorsed by the publisher.
References
Akbari, M., Minuchehr, A., Zolfaghari, A., and Khoshahval, F. (2012). An investigation for an optimized neutron energy-group structure in thermal lattices using Particle Swarm Optimization. Ann. Nucl. Energy 47, 53–61. doi:10.1016/j.anucene.2012.02.016
Aldama, D., Leszczynski, F., and Trkov, A. (2003). WIMS-D library update. Austria: International Atomic Energy Agency.
Askew, J., Fayers, F., and Kemshell, P. (1966). A general description of lattice code WIMS. J. Br. Nucl. Energy Soc. 5, 546–585.
Bondarenko, I. I. (1964). Group constants for nuclear reactor calculations. New York, USA: Consultants Bureau.
Canbakan, A., and Hebert, A. (2015). Accuracy of a 2-level scheme based on a subgroup method for pressurized water reactor fuel assembly models. Ann. Nucl. Energy 81, 164–173. doi:10.1016/j.anucene.2015.03.034
Choi, S., Smith, K., Lee, H. C., and Lee, D. (2015). Impact of inflow transport approximation on light water reactor analysis. J. Comput. Phys. 299, 352–373. doi:10.1016/j.jcp.2015.07.005
Choi, S., Lee, C., and Lee, D. (2017). Resonance treatment using pin-based pointwise energy slowing-down method. J. Comput. Phys. 330, 134–155. doi:10.1016/j.jcp.2016.11.007
Cullen, D. (1977). Calculation of probability table parameters to include intermediate resonance self-shielding. Livermore, USA: Lawrence Livermore National Laboratory. UCRL-79761.
Downar, T., Kochunas, B., and Collins, B. (2016). “Validation and verification of the MPACT code,” in Proceedings of the PHYSOR 2016. Sun valley January 2016, (USA: Idaho).
Edgar, C. A., Yi, C., and Sjoden, G. (2015). Automatically optimized collapsed neutron energy group structure using particle swarm optimization, Proceedings of the Joint international conference on mathematics and computation (M&C), supercomputing in nuclear applications (SNA) and the Monte Carlo. USA: MC) Method. NashvilleTN.
Godfrey, A. T. (2013). VERA core physics benchmark progression problem specifications. Oak Ridge, USA: Oak Ridge National Laboratory, 793.
He, Q., Chen, J., Liu, Z., Cao, L., and Wu, H. (2020). The on-the-fly subgroup method capable of treating spatial self-shielding, resonance interference and temperature distribution effects. Prog. Nucl. Energy 119 (), 103173. doi:10.1016/j.pnucene.2019.103173
Hebert, A. (2009). Development of the subgroup projection method for resonance self-shielding calculations. Nucl. Sci. Eng. 162, 56–75. doi:10.13182/nse162-56
Hébert, A., and Marleau, G. (1991). Generalization of the stamm'ler method for the self-shielding of resonant isotopes in arbitrary geometries. Nucl. Sci. Eng. 108 (3), 230–239. doi:10.13182/nse90-57
Hébert, A., and Santamarina, A. (2008). “Refinement of the Santamarina-Hfaiedh energy mesh between 22.5 eV and 11.4 keV,” in Proceedings of the International conference on reactor physics (Switzerland: Interlaken).July 2008,
Hfaiedh, N., and Santamarina, A. (2005). M&C: International conference on mathematics and computational methods applied to nuclear science and engineering. France: Avignon.Determination of the optimized shem mesh for neutron transport calculations
Hong, S. G., and Cho, N. Z. (1998). Crx: A code for rectangular and hexagonal lattices based on the method of characteristics. Ann. Nucl. Energy 25 (8), 547–565. doi:10.1016/s0306-4549(97)00113-8
Ishiguro, Y., and Takano, H. (1971). Peaco: A code for calculation of group constant of resonance energy region in heterogeneous systems. Ibaraki, Japan: Atomic Energy Research Institute. No.JAERI-1.
Joo, H. G., Kim, G. Y., and Pogosbekyan, L. (2009). Subgroup weight generation based on shielded pin-cell cross section conservation. Ann. Nucl. Energy 36 (7), 859–868. doi:10.1016/j.anucene.2009.03.017
Kennedy, J., and Eberhart, R. (1995). “Particle swarm optimization,” in Proceedings of IEEE international conference on neural networks, 1942–1948.
Kim, K. S., and Hong, S. G. (2011). The method of characteristics applied to solving slowing down equation to estimate the self-shielded resonance cross sections with an explicit geometrical effect. Ann. Nucl. Energy 38 (2–3), 438–446. doi:10.1016/j.anucene.2010.09.022
Kim, K. S., and Williams, M. L. (2019). Spatially dependent embedded self-shielding method for nonuniform temperature distribution. Ann. Nucl. Energy 132, 563–575. doi:10.1016/j.anucene.2019.06.043
Li, S., Zhang, Q., Zhang, Z., Zhao, Q., and Liang, L. (2021). Improved subgroup method coupled with particle swarm optimization algorithm for intra-pellet non-uniform temperature distribution problem. Ann. Nucl. Energy 153, 108070. doi:10.1016/j.anucene.2020.108070
Li, S., Zhang, Z., Zhang, Q., Hao, C., and Zhao, Q. (2019). Analysis of categorical subgroup method for resonance self-shielding treatment. Front. Energy Res. 7 (48), 1–12. doi:10.3389/fenrg.2019.00048
Li, S., Zhang, Z., Zhang, Q., and Zhao, Q. (2020). Improvements of subgroup method based on fine group slowing-down calculation for resonance self-shielding treatment. Ann. Nucl. Energy 136, 106992. doi:10.1016/j.anucene.2019.106992
Liu, Y., Martin, W., Williams, M., and Kim, K. (2015). A full-core resonance self-shielding method using a continuous-energy quasi-one-dimensional slowing-down solution that accounts for temperature-dependent fuel subregions and resonance interference. Nucl. Sci. Eng. 180, 247–272. doi:10.13182/nse14-65
Liu, Z., He, Q., Zu, T., Cao, L., Wu, H., and Zhang, Q. (2018). The pseudo-resonant-nuclide subgroup method based global–local self-shielding calculation scheme. J. Nucl. Sci. Technol. 55 (2), 217–228. doi:10.1080/00223131.2017.1394232
Macfarlane, R., Muir, D. W., Boicourt, R. M., Kahler, A. C., and Conlin, J. L. (2016). The NJOY nuclear data processing system, version 2016. LA-UR: Los Alamos National Laboratory, 19–33.
Nikolaev, M., Ignatov, A., Isaev, N., and Khokhlov, V. (1971). The method of subgroups for considenring the resonance structure of the cross sections in neutron calculations. Sov. A. T. Energy 30, 426–430.
Park, H., and Joo, H. G. (2019). Effective subgroup method employing macro level grid optimization for LWR applications. Ann. Nucl. Energy 129, 461–471. doi:10.1016/j.anucene.2019.02.005
Peng, S., Jiang, X., Zhang, S., and Wang, D. (2013). Subgroup method with resonance interference factor table. Ann. Nucl. Energy 59, 176–187. doi:10.1016/j.anucene.2013.04.005
Sohail, M., and Kim, M. H. (2015). Estimation of self-shielded cross section by employing interference correction factors in subgroup method. Prog. Nucl. Energy 79, 150–157. doi:10.1016/j.pnucene.2014.11.008
Song, P., Zhang, Z., Liang, L., Zhang, Q., and Zhao, Q. (2019). Implementation and performance analysis of the massively parallel method of characteristics based on GPU. Ann. Nucl. Energy 131, 257–272. doi:10.1016/j.anucene.2019.02.026
Sugimura, N., and Yamamoto, A. (2007). Resonance treatment based on ultra-fine-group spectrum calculation in the AEGIS code. J. Nucl. Sci. Technol. 44 (7), 958–966. doi:10.1080/18811248.2007.9711335
Williams, M. L. (1983). Correction of multigroup cross sections for resolved resonance interference in mixed absorbers. Nucl. Sci. Eng. 83, 37–49. doi:10.13182/nse83-2
Williams, M. L., and Kim, K. S. (2012). The embedded self-shielding method, Proc. PHYSOR 2012. KnoxvilleUSA: Tennessee.
X-5 Monte Carlo Team, (2003). Mcnp - a general N-particle transport code, version 5 - volume I: Overview and theory. LA-UR-03-1987. Los Alamos, USA: Los Alamos National Laboratory.
Yamamoto, A., Ikehara, T., Ito, T., and Saji, E. (2002). Benchmark problem suite for reactor physics study of LWR next generation fuels. J. Nucl. Sci. Technol. 39 (8), 900–912. doi:10.1080/18811248.2002.9715275
Yamamoto, A., Tabuchi, M., Sugimura, N., Ushio, T., and Mori, M. (2007). Derivation of optimum polar angle quadrature set for the method of characteristics based on approximation error for the bickley function. J. Nucl. Sci. Technol. 44 (2), 129–136. doi:10.1080/18811248.2007.9711266
Yi, C., and Sjoden, G. (2013). Energy group structure determination using particle swarm optimization. Ann. Nucl. Energy 56, 53–56. doi:10.1016/j.anucene.2012.12.020
Zhang, Q., Qin, S., Zhao, Q., Liang, L., Wu, H., and Cao, L. (2020). Improvements on the method of ultra-fine-group slowing-down solution coupled with method of characteristics on irregular geometries. Ann. Nucl. Energy 136, 107017. doi:10.1016/j.anucene.2019.107017
Zhang, Q., Wu, H., Cao, L., and Zheng, Y. (2015). An improved resonance self-shielding calculation method based on equivalence theory. Nucl. Sci. Eng. 179 (3), 233–252. doi:10.13182/nse13-108
Zhang, Q., Zhao, Q., Yang, W. S., Wu, H., Zhang, Q., Zhao, Q., et al. (2018). Modeling of resonance-interference effect in depleted fuel compositions by pseudo resonant isotopes. Nucl. Sci. Eng. 191 (1), 46–65. doi:10.1080/00295639.2018.1429174
Keywords: resonance self-shielding, subgroup method, resonance interference effect, particle swarm optimization, fine group structure
Citation: Li S, Zhang Q, Liu L, Zhang Y, Hao J, Wang X, Jiang L and Liu X (2023) Analysis of the fine-mesh subgroup method and its feasible improvement. Front. Energy Res. 10:1036063. doi: 10.3389/fenrg.2022.1036063
Received: 03 September 2022; Accepted: 30 November 2022;
Published: 06 January 2023.
Edited by:
Qingming He, Xi’an Jiaotong University, ChinaReviewed by:
Yuxuan Liu, University of Michigan, United StatesHongbo Zhang, Nuclear Power Institute of China (NPIC), China
Copyright © 2023 Li, Zhang, Liu, Zhang, Hao, Wang, Jiang and Liu. This is an open-access article distributed under the terms of the Creative Commons Attribution License (CC BY). The use, distribution or reproduction in other forums is permitted, provided the original author(s) and the copyright owner(s) are credited and that the original publication in this journal is cited, in accordance with accepted academic practice. No use, distribution or reproduction is permitted which does not comply with these terms.
*Correspondence: Song Li, bGlzb25nX2xzQGZveG1haWwuY29t; Yongfa Zhang, emhhbmd5ZkAxNjMuY29t