 Huang Kun
 Cai Rong3
- 1School of Electronic Science and Engineering, Southeast University, Nanjing, China
- 2NARI Technology Co., Ltd., NARI Group Corporation, Nanjing, China
- 3Suzhou Power Supply Company, State Grid Jiangsu Electric Power Co., Ltd., Suzhou, China
With the rapid development of the new energy industry, distributed generation (DG) is connected to the power grid on a large scale, and the traditional relay protection scheme is no longer suitable for modern power systems. In order to solve this problem, this paper establishes a mathematical model of the equivalent circuit of distributed photovoltaic power supply according to the external characteristics of photovoltaic cells, and analyzes its volt-ampmeter characteristics and voltage output characteristics of power supply. On this basis, it analyzes and puts forward the control mode of DG when the distribution network is faulty. On the basis of the study, this article has double feeder distribution network as an example, the analysis when the line fault occurring at different extents of DG connected to different position on the influence of the distribution network current protection, the results show that when answering DG side in the feeder bus for distribution network of current protection, pick a smaller effect on both ends of feeder, has a certain symmetry. Finally, the accuracy of theoretical analysis is verified by establishing a simulation model in PSCAD.
1 Introduction
With the rapid development of society, economy and technology, the global ecological environment has been seriously damaged, and the climate issue has attracted great attention from all sides of society. Vigorously developing clean energy and improving energy use structure is one of the important ways to deal with environmental and climate problems. In 2021, China’s photovoltaic power generation was 325.9 billion KWH, an increase of 64.8 billion KWH over the previous year, a year-on-year growth of 24.8%, accounting for about 4.0% of the country’s total annual electricity generation. In 2021, China’s cumulative installed capacity of photovoltaic power generation was 306.56 million kW, a year-on-year growth of 21%; China’s newly installed PV capacity was 54.93 GW, up 14 percent year on year (Energy and the Environment, 2021). In the same time other clean energy technologies in our country have also been expanded and applied massively. Continuing to develop clean energy in the future will be an important contribution to optimizing energy structure, realizing “double carbon” target and promoting global environmental construction (Ming et al., 2014).
But as clean power sources, mainly photovoltaic, are connected to the distribution grid on a large scale, the structure of the distribution network has changed from the original single power supply radiant network to bidirectional multi-power network (Wu et al., 2021a), and the power flow and system short-circuit current of the power grid have changed. Therefore, the original protection scheme applicable to the traditional distribution network cannot be directly applied to the distribution network with distributed power access, so it is very necessary to analyze the influence of distributed power access on the protection device of distribution network.
In view of the above problems, researchers at home and abroad have carried out research and analysis from different aspects, and achieved good results. Literature (Calderaro et al., 2009; Liqun et al., 2020; Yin et al., 2020) takes the distribution system with a single distributed power supply as an example. By exploring the characteristics of photovoltaic output, voltage and current changes at the grid-connected end of photovoltaic are controlled based on island detection, so as to achieve the relay protection goal of distribution network. In literature (Alcala-Gonzalez et al., 2021; Ni et al., 2022), the equivalent model of photovoltaic power station was established and its short-circuit fault characteristics were simulated and analyzed to study the influence of different photovoltaic access capacity on the short-circuit level of regional power grid. Literature (Luning, 2019; Wu et al., 2022) proposed a new distributed power consumption model based on the dynamic reconstruction of distribution network. The model comprehensively considered the load demand change in each period, the uncertainty of distributed power output and the switching times, and established the optimization objective of maximizing the photovoltaic absorption ratio and minimizing the switching times. Literature (Yongfei et al., 2016; Xuekai et al., 2019) analyzes the transient process of inverter and the output characteristics of distributed power supply during reclosing operation based on the dynamic characteristics of distributed power lock loop during reclosing operation, and discusses the influence of photovoltaic access on reclosing. Finally, the reclosing configuration method considering distributed power supply access is given, which has good practical value. Based on the definition and characteristics of distributed power generation, literature (Yongfei et al., 2016; Xiao, 2018) explores the influence of distributed power access on relay protection of distribution network, but the content is theoretical and no specific simulation is used to verify the applicability of the proposed scheme. Literature (Azeroual et al., 2022) proposed a new method for fault location and autonomous recovery of distributed distribution system based on multi-agent system, and tested the proposed protection method by using the open-loop feeder distribution system in Kenitra, Morocco. In addition, the impact of DG integration on fault location and multiple faults is addressed. In this study, with suitable backup protection given via agent coordination.
Through the above analysis we is not hard to find, after the DG interconnection of traditional relay protection scheme is not fully used and difficult to meet the requirements of the safe and stable operation of power grid, the current due to a variety of proposed methods in our study is limited by its own limitations, lack of strong general protection scheme is one of the important reasons, limit development of DG interconnection large-scale Therefore, it is very important to study the protection method of distribution network with DG access.
2 Modeling and operating characteristic analysis of distributed photovoltaic power generation
2.1 Structure modeling of distributed photovoltaic power generation
The smallest component unit of photovoltaic array of distributed photovoltaic power generation is photovoltaic cell, which generates current through photogenerating volt effect (Mingjun, 2018; Hong and Hongbo, 2020). The equivalent circuit model of photovoltaic cell is established according to the external characteristics of photovoltaic cell, as shown in Figure 1.
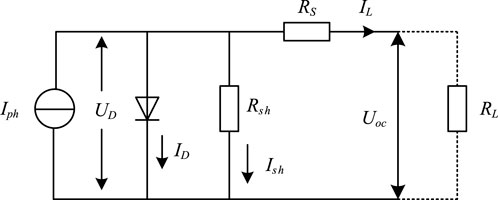
FIGURE 1. Equivalent circuit model of photovoltaic cell.
Figure 1 shows that the equivalent circuit of photovoltaic cell consists of a current source in parallel with an ideal diode, and is connected with a series resistor and a parallel resistor. According to the characteristics of PN junction of the diode, the mathematical model of photovoltaic cell can be obtained as shown in Eqs 1–6:
Where, IL is the external output current of photovoltaic cell, Iph is the current generated by photovoltaic cell through photogenerating volt effect, ID is the internal dark current that photovoltaic cell flows through the diode, Ish is the current that flows through the parallel resistor Rsh, I0 is the reverse saturation current of the diode, q is the electronic load, q = 1.6 × 10⁻¹⁹C, UD is the voltage at both ends of the diode, A is the fitting coefficient of the characteristic curve of the PN junction of the diode, k is the Boltzmann constant, k = 1.38 × 10⁻²³ J/K, T is the absolute temperature of the operating environment, Rsh is the equivalent parallel resistance of the photovoltaic cell, Uoc is the open circuit voltage of the photovoltaic cell, RL is the external load resistance of the photovoltaic cell, Rs is the equivalent series resistance of photovoltaic cells, and Isc is the internal short-circuit current of photovoltaic cells.
Since the internal equivalent series resistance of photovoltaic cells is small (generally less than 1 Ω), while the resistance value of parallel resistance is large, the above resistance can be ignored under ideal conditions, and the equivalent circuit of photovoltaic cells can be further simplified into the model shown in Figure 2.
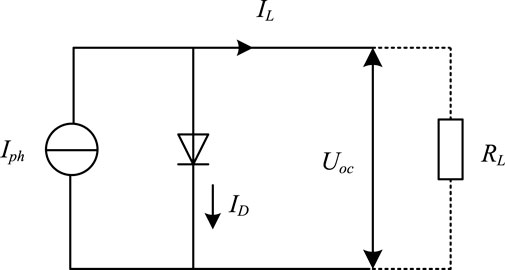
FIGURE 2. Simplified model of equivalent circuit of photovoltaic cell.
According to the simplified equivalent circuit model of photovoltaic cell, Eqs 1–6 are simplified, and the simplified mathematical model of photovoltaic cell can be obtained as follows:
Where UL is the external output DC voltage of the photovoltaic cell, and P is the output power of the photovoltaic cell.
2.2 Operating characteristics of distributed photovoltaic power generation
Voltammetric characteristics of photovoltaic cells are shown in Figure 3. The intersection point of the curve with the current axis is the circuit current Isc of photovoltaic cells, and the intersection point with the electric voltage axis is the open circuit voltage Uoc. The point M in the curve enables photovoltaic cells to output the maximum power when operating with the current and voltage at this point, which is called the maximum power point. The photovoltaic cell output current Im is the best output current, and the voltage at this point Um is the best output voltage. From the origin, several lines can be drawn that intersect the I-U curve. These lines are called load lines with a slope of 1/RL. Among several load lines, there is only one line that intersects point M. The load line is called the optimal load line, and its slope is 1/Rm. In this case, the external load resistance of the photovoltaic cell RL = Rm.

FIGURE 3. Voltammetric characteristic curve of photovoltaic cell.
The power-voltage output characteristics of photovoltaic cells are shown in Figure 4 (Yongfei et al., 2016). According to the figure, the output power and voltage transmission of photovoltaic cells have nonlinear characteristics. When the voltage is less than the maximum power point voltage, the output characteristics of photovoltaic cells are similar to current sources. When the voltage is greater than the maximum power point voltage, the photovoltaic cell output characteristics are similar to the voltage source.
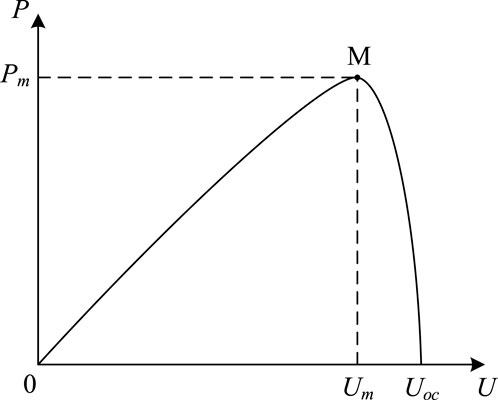
FIGURE 4. Pv cell power-voltage output characteristic curve.
To sum up, the maximum output power Pm of photovoltaic cells is expressed as:
Photovoltaic cells are easily affected by various external factors in actual operation, among which the solar illumination intensity and working environment temperature have a particularly significant impact on their output characteristics. Figure 5 for the different light intensity on pv cells at the same temperature volt-ampere characteristic and power—voltage output characteristic influence diagram, the output voltage is equal, with the increasing of light intensity, the photovoltaic battery output power and output current increase, at the same time, the light intensity has significant effects on short circuit current and open circuit voltage effect is relatively small.
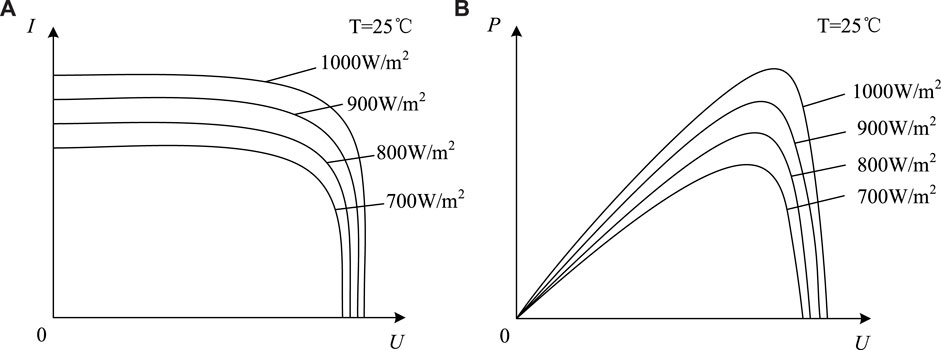
FIGURE 5. Output characteristics of photovoltaic cells under the same temperature and different light intensities. (A) Voltammetry characteristic curve. (B) Power voltage characteristic curve.
Figure 6 for the same light intensity under different temperature on the pv cells volt-ampere characteristic and power—the influence of the voltage output characteristics, along with the temperature rising, the photovoltaic battery output power and output current showed a trend of decrease, but the overall degree of change is small, at the same time, the temperature has significant effects on the open circuit voltage and short circuit current effect is relatively small.
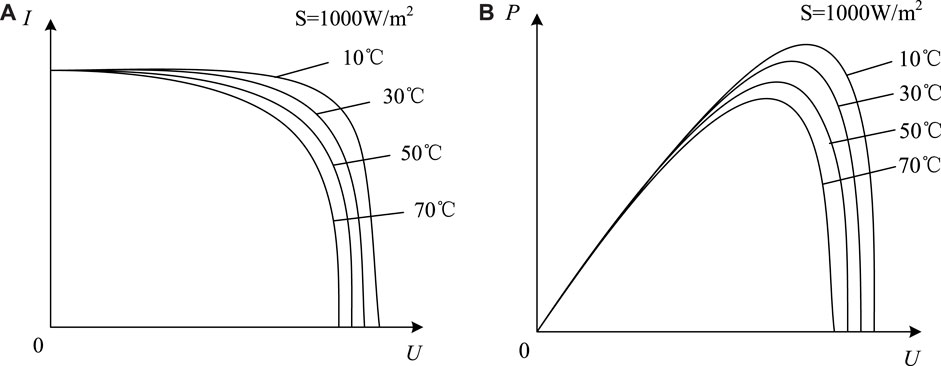
FIGURE 6. Output characteristics of photovoltaic cells at different temperatures under the same light intensity. (A) Voltammetry characteristic curve. (B) Power voltage characteristic curve.
Through the above analysis shows that works in different light intensity and environment temperature the volt-ampere characteristic and power of the photovoltaic cells—voltage characteristic each are not identical, location of maximum power point is different also, in order to keep the pv cells can under different light and temperature can be maximum power output, you need to use the maximum power point tracking technology to control the pv cells.
2.3 Distributed photovoltaic grid-connected control mode
Because photovoltaic power generation outputs direct current by using the photogenerated volt effect of photovoltaic array solar cells, it must be converted into alternating current by inverters before it can be incorporated into the power grid. There are various control methods in the grid-connected inverter process of distributed photovoltaic power generation. In this paper, the PQ control method is adopted. The voltage and frequency are given by the grid, and the output power is guaranteed to be given by controlling the current. Therefore, in essence, PQ control is a kind of current control. Figure 7 shows the droop characteristics of system frequency and voltage under the PQ control mode. It can be seen that the active and reactive power of DG can be kept constant within the dynamic variation range of frequency and output voltage by using the PQ control mode. When the DG is connected to the power grid, the frequency and voltage are maintained stable by the distribution network system itself.
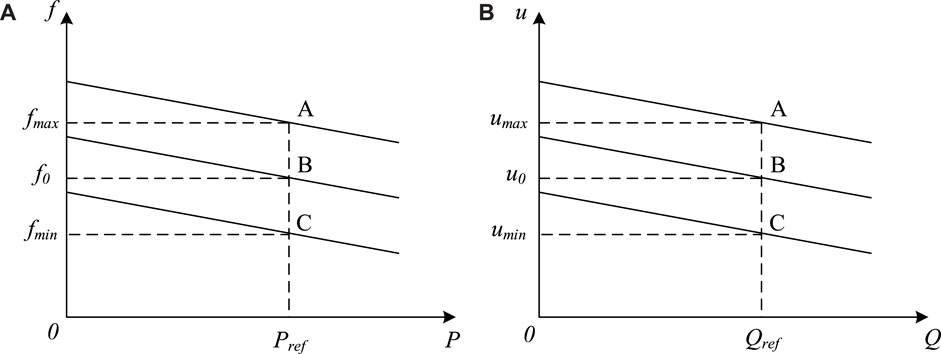
FIGURE 7. System frequency and voltage droop characteristics under PQ control. (A) Frequency droop characteristic. (B) Voltage droop characteristic.
The process of distributed photovoltaic grid-connected control using PQ control is shown in Figure 8. In Figure 8, the photovoltaic array first generates DC through the photovoltaic effect, and then converts DC to AC through the three-phase inverter after the voltage is raised by the Boost circuit. After the filtering is completed, it meets the power quality requirements of photovoltaic grid-connected, and then it is connected to the distribution network for operation. Among them, the inverter adopts PQ control strategy to make the active power and reactive power output of DG equal to the reference value given by the system. The instantaneous current iabc and the instantaneous voltage eabc of the common connection point are respectively subjected to Parker transform to obtain id, iq, ed, and eq. The outer loop control is compared with the given reference power and PI is used to control the error, and then the reference currents idref and iqref are obtained. Similarly, by comparing the inner loop control of the current with id and iq, The difference is controlled by PI, and the output reference voltages udref and uqref are obtained through Parker inverse transformation to obtain the three-phase component in the abc coordinate system. Finally, the three-phase inverter is controlled through PWM pulse width modulation.
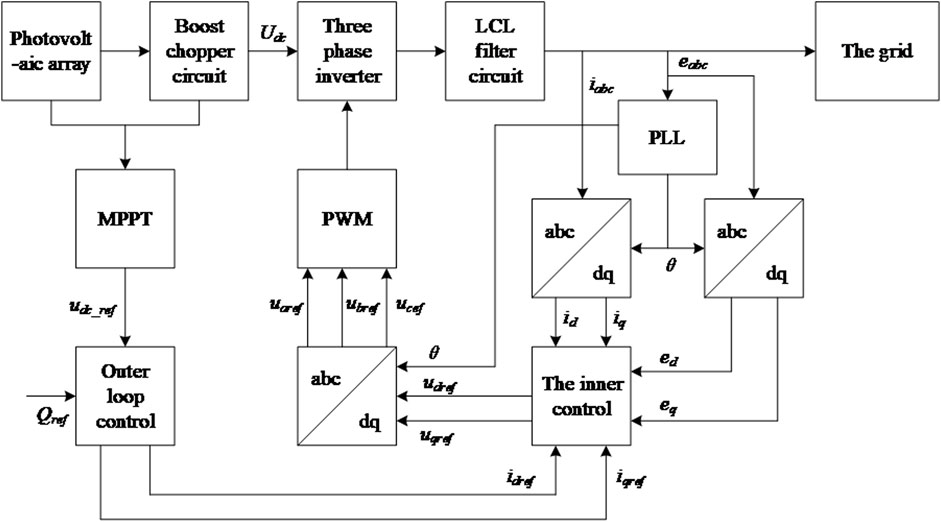
FIGURE 8. Schematic diagram of grid-connected operation control of distributed PV.
2.4 Operating characteristics of distributed photovoltaic power generation
In case of distribution network failure, the distributed generation is required to have low-voltage crossing capability, that is, when the grid failure or disturbance leads to voltage sag of the distributed generation junction point, the distributed generation should be able to maintain the grid-connected state and continue to operate within the specified range and time of voltage sag. The low-voltage crossing capacity of DG should meet the requirements as shown in Figure 9. Specifically, when the voltage of the DG connection point drops to 0, the DG should be able to run continuously for 0.15 s without disconnecting from the grid, and when the voltage drops below curve 1, the DG can be cut off from the grid.
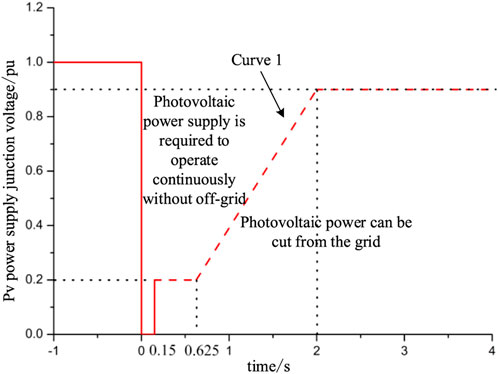
FIGURE 9. Low voltage traversal capability of distributed power supply.
The reactive current output by DG during fault crossing satisfies Eq. 10. When the voltage of the connection point is too low, the DG is required to provide reactive current to the system to maintain the voltage level of the grid. Specifically, when the junction voltage is greater than 0.9 PU, no reactive current is output; When the junction point voltage is 0.2–0.9 PU, the reactive current is determined by the rated DG current and the junction point voltage. When the junction voltage is less than 0.2 PU, the output reactive current is 1.05 times of the rated current of DG.
Where, U* is the nominal voltage of DG connection point, and IN is the rated current of DG.
DG should have certain operation adaptability, and it is required to run under the specified operating time requirements when the voltage and frequency of the distribution network connection point change. The specific requirements for the running time of DG within the voltage range of different connection points are shown in Table 1.
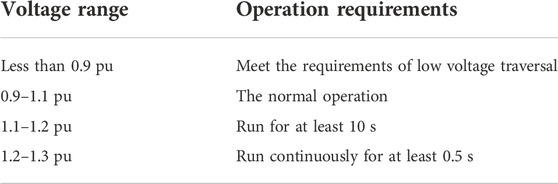
TABLE 1. Operating time requirements of photovoltaic power supply in different voltage range of junction points.
3 Analysis of the influence of distributed generation access on distribution network current protection
After the DG is connected to the distribution network, the system is transformed from the original simple single power supply network to the complex multi-power supply network. In case of short circuit fault, the direction of current is difficult to determine, and the influence of DG access to the distribution network varies with different capacity, quantity, location, (GB/T 19964-2012, 2012) type and other conditions (Chunlan et al., 2018; Wu et al., 2021b; Hongjuan et al., 2021).
In this paper, the dual-feeder distribution network is taken as an example to analyze the influence of DG on current protection when it is connected to the end busbar, middle busbar and head busbar of the feeder of the distribution network when faults occur in different sections of the line. In the fault analysis, DG is equivalent to the voltage controlled current source. Figure 10 shows the topological structure of DG connected to the terminal bus D of feeder 1.
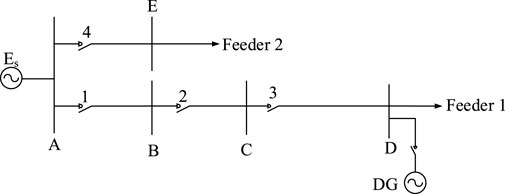
FIGURE 10. DG is connected to bus D at the end of feeder.
3.1 Distributed power supply mode when distribution network failure
3.1.1 Distributed generation is connected to the head of the feeder
Figure 11 shows the schematic diagram of DG connected to bus A at the first end of feeder 1. The influence caused by DG access is discussed by analyzing the short circuit fault occurring at F1 and F2 at AE end of line AB, respectively.
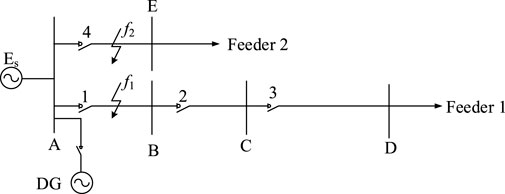
FIGURE 11. DG is connected to bus A at the beginning of feeder.
Head end when DG in the feeder bus, DG and original power supply system for line power supply, equivalent to increase the capacity of the power system, both when the end of the line AB f1 or f2 fault line AE end, compared to before the DG access, short circuit current changed little, the influence of various protection are in line of smaller.
3.1.2 Distributed generation is connected to the middle end of the feeder
Figure 12 shows the schematic diagram of DG connected to bus C in the middle section of feeder 1. The influence caused by DG access is discussed by analyzing the short circuit fault occurring at F1 of AB end, F2 of CD end and F3 of AE end, respectively.
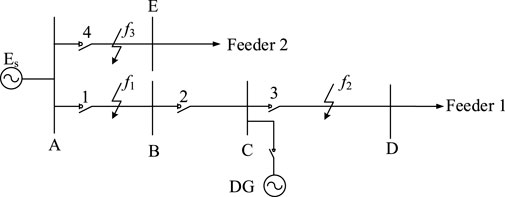
FIGURE 12. DG is connected to the terminal bus C of BC.
3.1.2.1 A fault occurs at the end of AB upstream of DG
When a fault occurs at f1 of AB terminal, the fault line is equivalent to the circuit diagram shown in Figure 13 for analysis in order to more intuitively analyze the current flowing through each protection.
Where, I1 is the current flowing through protection 1, I2 is the reverse current output from DG to fault point f1, Us is the reference voltage of the system, Zs is the system power supply impedance, is the equivalent impedance from bus A to fault point f1, ZBC is the equivalent impedance from bus B to bus C, ZCD is the equivalent impedance from bus C to bus D, Is the equivalent impedance from bus B to the fault point f1, UDG is the voltage of DG, P is the power of DG. UDG is solved through Eq. 12, and the calculation result is shown in Eq. 13.

FIGURE 13. Equivalent circuit diagram of a fault at the end of line AB.
According to Eqs 11–14, when a short-circuit fault occurs at f1 of AB terminal, DG provides fault current to the fault, and the short-circuit current flowing through protection 2 increases. When the short-circuit current is greater than the action value, protection 2 will misoperate, resulting in the extension of line outage range, while the current of protection 1 is not affected by DG access.
3.1.2.2 A fault occurs at the end of the downstream line CD of DG
When a fault occurs at f2 at the end of line CD, the line can be equivalent to the simplified circuit model shown in Figure 14.
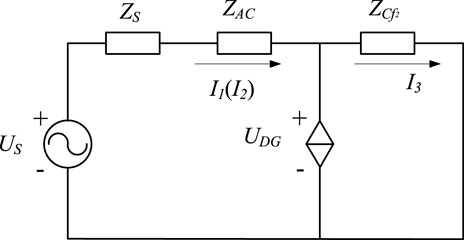
FIGURE 14. Equivalent circuit diagram of a fault at the end of line AB.
According to the simplified circuit model diagram, the current I1, I2, and I3 flowing through protection 1, protection 2 and protection 3 can be obtained.
Where, Us is the system reference voltage, Zs is the system power supply impedance, ZAC is the impedance of line AC, is the equivalent impedance of the distance between bus A and fault point f2, and UDG is the voltage of DG. UDG is solved through Eq. 17, and the calculation result is shown in Eq. 18.
So, failure occurs when the end of the CD f2, by protecting 3 I period of action to remove the fault, protect 2 as line CD backup protection, DG on bus C, increase of short circuit current protection 3, protection to improve sensitivity, of short circuit current protection 2 decreases, and protect the protection range of the two and lower sensitivity.
3.1.2.3 AE ends of adjacent feeders are faulty
When a fault occurs at f3 of AE end, the fault line can be equivalent to the circuit diagram shown in Figure 15 for analysis.
Where, Us is the system reference voltage, Zs is the system power supply impedance, ZAC is the impedance of line AC, ZCD is the impedance of line CD, ZAf3 is the equivalent impedance of the distance between bus A and fault point f3, UDG is the voltage of DG, I1 is the reverse current output by DG through protection 1, I2 is the reverse current output by DG through protection 2.
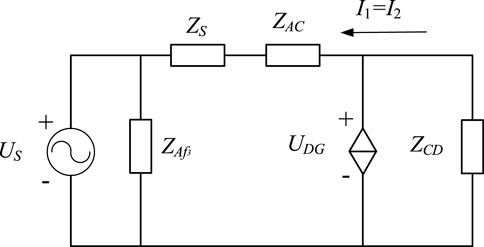
FIGURE 15. Equivalent circuit diagram of AE terminal fault.
When a fault occurs at f3 of AE terminal, the fault can be removed by the action of protection 4 before DG access. When DG access, the DG outputs reverse fault current to the fault point, and both protection 1 and protection 2 may misoperate. However, if DG is far enough away from the fault point, the fault current provided is not enough to cause the misoperation of protection.
3.1.3 Distributed generation is connected to the end of the feeder
Figure 16 shows the schematic diagram of DG connected to bus D at the end of feeder 1. The influence caused by DG access is discussed by analyzing the short circuit fault occurring at f1 and F2 at AE end of line AB, respectively.
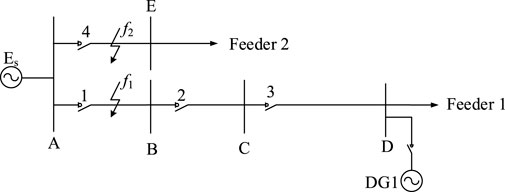
FIGURE 16. Equivalent circuit diagram of AE terminal fault.
When a short circuit fault occurs at f1 at the end of line AB, if the distribution network is not connected to DG, protection device one starts normally and the fault is removed. When DG is connected to the grid, f1 has a short-circuit fault, and the fault current flowing through protection 2 and protection 3 becomes larger. When the short-circuit current exceeds the setting value of the operation, protection 2 and protection 3 misoperate. When a short circuit fault occurs at f2 of AE end of line, the distance between DG position and fault point f2 is far away, so the influence on protection 4 is small.
From the above theoretical analysis, we can figure out that when the distributed power supply is connected to the bus at the head of the feeder, it becomes a part of the overall power supply system because it is close to the power supply side of the line, and will not cause misoperation of protection basically when the fault occurs. When the distributed power supply is connected to the bus at the end of the feeder, if it is far enough away from the fault point, the influence on the fault point current is relatively small. However, when the distributed power supply is connected to the bus at the middle end of the feeder, different from the above two cases, the distributed power supply will have more or less influence on the current of the guard point, which is easy to lead to the misoperation of the guard device. The following is to verify the correctness of the conclusion by combining simulation analysis.
4 The simulation analysis
The simulation model as shown in Figure 13 is established on the PSCAD platform, and the specific parameters of the simulation are as follows:
(1) Power parameters on the system side
The reference voltage value of the distribution network system is 10.5 kV, the reference capacity is 100 MVA, and the impedance value of the system side is j0.35 Ω.
(2) Line parameters
The lines AB, BC, CD, and AF of the distribution network all adopt overhead lines, and the unit resistance and reactance are set as R = 0.26 Ω/km and X = 0.355 Ω/km. It can be seen from Figure 17 that the distribution network is a double-feeder system, and the specific parameters are set as follows:
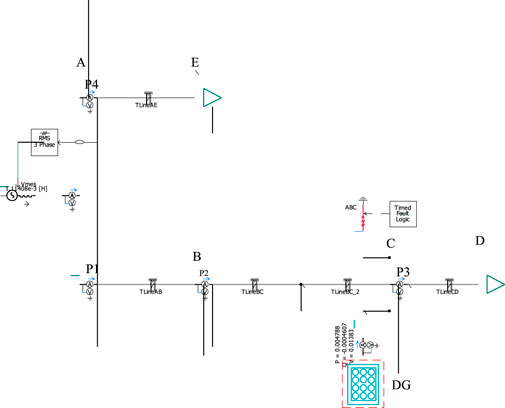
FIGURE 17. Equivalent circuit diagram of AE terminal fault.
Feeder 1: the length of AB is 3 km, and the impedance value is ZAB = 0.78 + j1.065 Ω; The length of BC is 3 km, and the impedance value is ZBC = 0.78 + j1.065 Ω; The length of CD is 10 km, and the impedance is ZCD = 2.6 + j3.55 Ω.
Feeder 2: the length of AF is 4 km, and the impedance value is ZAF = 1.04 + j1.42 Ω.
The load capacity of feeder 1 and feeder 2 ends is 6 MVA, and the power factor is 0.85.
DG output power range is adjustable in 0–10 MW.
The output power of DG is set as 5 MW, the simulation time is 3 s, and the time step of solution is set as 2 μs. Three-phase short-circuit fault is set at the end of AB, BC, CD, and AE, respectively, and it is permanent fault. The fault occurs when the simulation runs for 1 s. Record the current at the fault point when the fault occurs and the maximum short-circuit current flowing through each line protection as shown in Table 2.
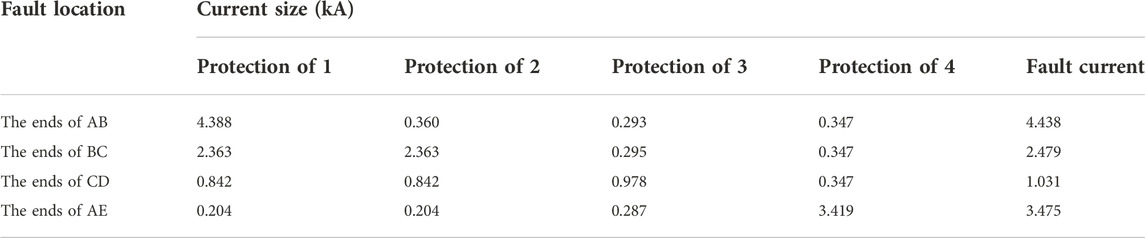
TABLE 2. Maximum short-circuit current at different positions when a three-phase short-circuit fault occurs.
The short circuit current and action changes before and after DG access are discussed respectively in the case of three-phase short circuit at the end of lines AB, BC, CD, and AE.
4.1 The upstream line of the distributed generation access point is faulty
Figures 18, 19 respectively show the simulation results of current size and protection action logic at each position of three-phase short-circuit fault of AB terminal.
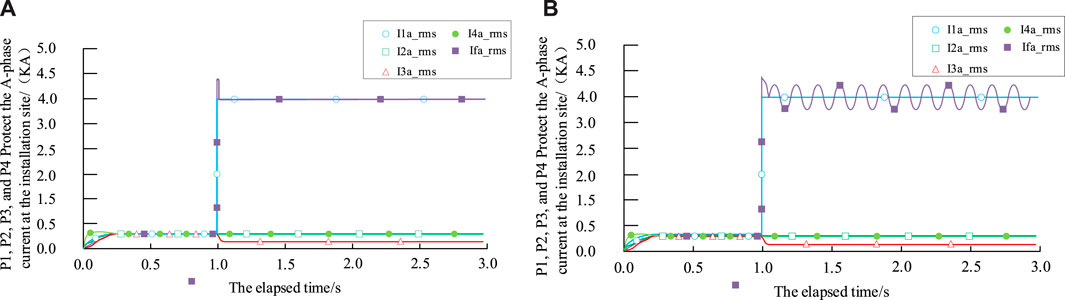
FIGURE 18. Current at each position of the AB terminal three-phase short-circuit fault. (A) Simulation results before DG access (B) Simulation results after DG access.
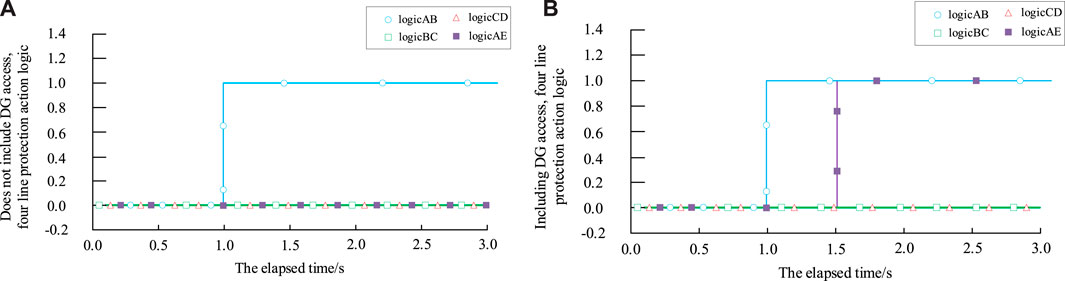
FIGURE 19. Three-stage protection action logic when three-phase short-circuit fault occurs at the AB terminal. (A) Simulation results before DG access (B) Simulation results after DG access.
According to the simulation results, when three-phase short-circuit fault occurs at the AB end of the line, the maximum a-phase current of the DG flowing through protection 1 (P1), protection 2 (P2), protection 3 (P3) and protection 4 (P4) before access is 4.39, 0, 0, 0.347 kA, respectively, and the current at the fault point is 4.438 kA. After DG access, the maximum a-phase currents flowing through P1, P2, P3, and P4 were 4.388, 0.36, 0.293, and 0.347 kA, respectively, and the current at the fault point was 4.438 kA. Compared with before DG access, P1 and P4 had little influence, while P2 and P3 currents increased. Before DG access, section ⅰ of P1 cannot protect the full length of the line, and the fault is removed by the protection of section ⅱ of P1, while the other protection does not misoperate and the protection selectivity is correct. After DG is connected, P2’s ⅲ segment will act and P2 will misoperate. This is because when the end of AB line fails, DG will reverse current to the fault point, resulting in P2 misoperation.
When the BC terminal three-phase short-circuit fault occurs, the maximum a-phase current flowing through P1, P2, P3, and P4 before DG access is 2.364, 2.364, 0, 0.347 kA, respectively, and the current at the fault point is 2.41 kA. After DG access, the maximum a-phase current flowing through P1, P2, P3, and P4 was 2.363, 2.363, 0.295, and 0.347 kA, respectively, and the fault point current was 2.479 kA. Compared with DG access before, P1, P2, and P4 had little influence, while P3 current increased.
4.2 The downstream line of the distributed generation access point is faulty
Figures 20, 21 respectively show the simulation results of current size and protection action logic at each position of CD terminal three-phase short circuit fault.
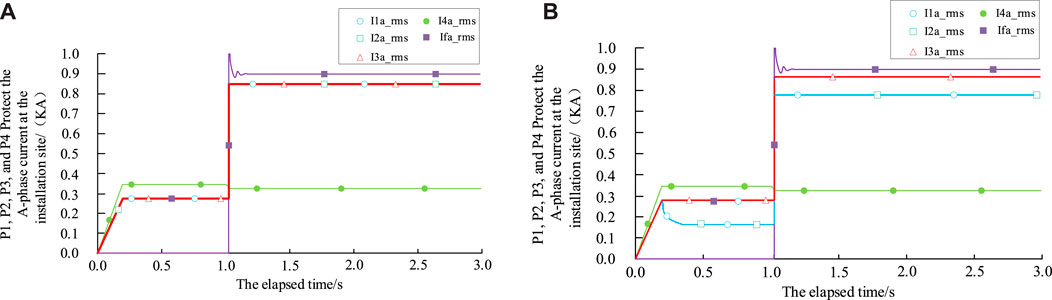
FIGURE 20. Current at each position of a CD terminal three-phase short-circuit fault. (A) Simulation results before DG access (B) simulation results after DG access.
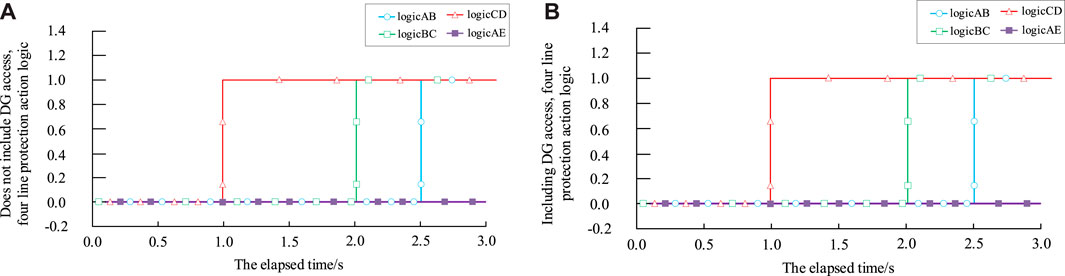
FIGURE 21. Three-stage protection action logic when three-phase short circuit fault occurs at the end of line CD. (A) Simulation results before DG access (B) simulation results after DG access.
According to the simulation results, when CD terminal three-phase short-circuit fault occurs, the maximum a-phase current flowing through P1, P2, P3, and P4 before DG access is 0.919, 0.919, 0.919, and 0.347 kA, respectively, and the fault point current is 0.973 kA. After DG access, the maximum a-phase currents flowing through P1, P2, P3, and P4 were 0.842, 0.842, 0.978, and 0.347 kA, respectively, and the current at the fault point was 1.031 kA. Compared with the current before DG access, P1 and P2 currents decreased, P3 currents increased, and P4 did not change, and all protection actions were normal.
4.3 The feeder adjacent to the distributed generation access point is faulty
Figures 22, 23 respectively show the simulation results of current size and protection action logic at each position of AE terminal three-phase short circuit fault.
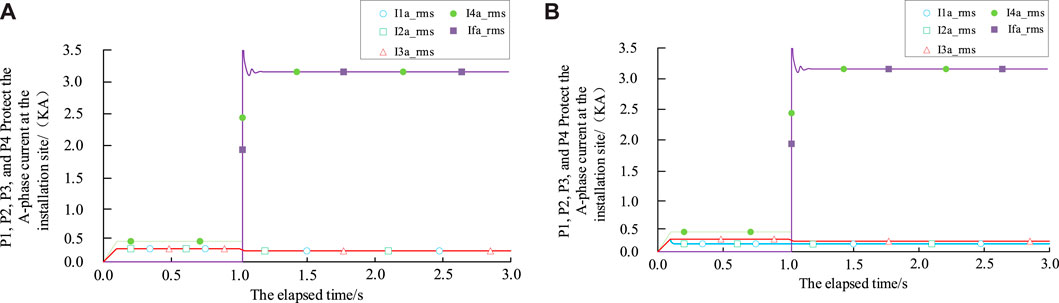
FIGURE 22. Current size at each position of AE terminal three-phase short-circuit fault. (A) Simulation results before DG access (B) simulation results after DG access.
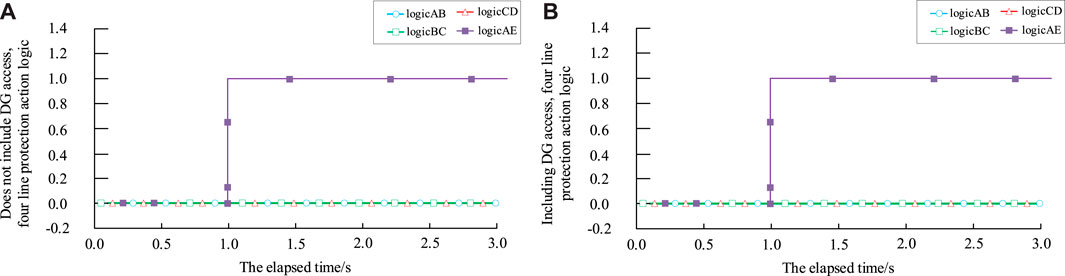
FIGURE 23. Three-stage protection action logic when AE terminal three-phase short circuit fault occurs. (A) Simulation results before DG access (B) simulation results after DG access.
According to the simulation results, when the AE terminal three-phase short-circuit fault occurs, the maximum a-phase current flowing through P1, P2, P3, and P4 before DG access is 0.27, 0.27, 0.27, and 3.418 kA, respectively, and the fault point current is 3.475 kA. After DG access, the maximum a-phase current flowing through P1, P2, P3, and P4 was 0.204, 0.204, 0.287, and 3.419 kA, respectively, and the fault point current was 3.475 kA. Compared with before DG access, P1 and P2 currents decreased, while P3 and P4 had little influence. P4 works normally before DG access, and other protections do not misoperate. In the system with DG, because the access position of DG is far away from the fault point, the short circuit current of the reverse transmission is small, so the current protection of the distribution network is not affected.
Through the above theoretical analysis and simulation results verification, the influence of single DG access on the short-circuit fault current of each line in distribution network is shown in Table 3.
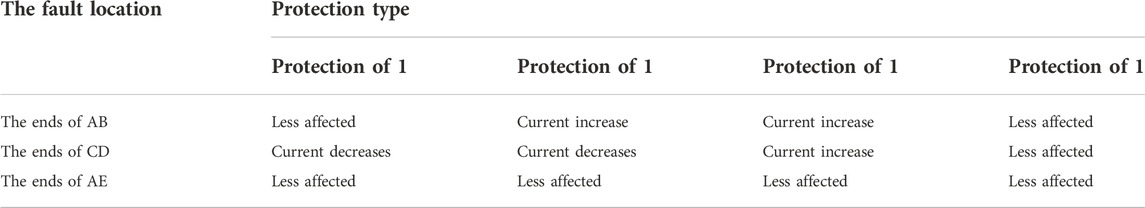
TABLE 3. Influence of single DG access on three-phase short-circuit fault current.
To sum up, the influence of single DG access on distribution network is related to the location of the fault. When the short-circuit fault occurs upstream of the DG access point, the protection three-phase short-circuit current downstream of the fault point will increase. When a short circuit fault occurs downstream of the DG access point, the short circuit current of the protection line located downstream of the DG increases, while the short circuit current of the protection line located upstream of the DG decreases. When short circuit fault occurs in adjacent feeder line of DG access point, it has little influence on each protection.
5 Conclusion
When clean energy is connected to the distribution network in the form of distributed power supply, if short-circuit fault occurs in the line, the fault direction is not easy to determine due to the transformation of the grid flow direction, so the formulation of relay protection scheme is different from that of traditional distribution network. In this paper, an equivalent circuit mathematical model with photovoltaic power supply as an example is established to analyze its volt-ampmeter characteristics and power-voltage output characteristics. At the same time, the control mode of distributed power supply is analyzed when the distribution network is faulty. Taking the dual-feeder distribution network with distributed power supply as the research object, when faults occur in different sections of the line, Influence on fault current and current protection when DG is connected to terminal bus, non-terminal bus and primary bus of distribution network feeder, respectively; It is concluded that when DG is connected in the middle of the feeder, it has the greatest influence on the protection device of the power grid, while when DG is connected in the head and end of the feeder, the influence is small. Finally, a simulation model is built in PSCAD to verify the accuracy of the theoretical analysis results.
Data availability statement
The original contributions presented in the study are included in the article/supplementary material, further inquiries can be directed to the corresponding author.
Author contributions
HK, CR, and ZJ contributed to conception and design of the study. HK organized the database. GX performed the statistical analysis. HG wrote the first draft of the manuscript. HK, CR, and ZJ wrote sections of the manuscript. All authors contributed to manuscript revision, read, and approved the submitted version.
Funding
This research was funded by Water port—ship multi-energy integration technology and integrated application, grant number 2021YFB2601600.
Acknowledgments
Thanks to the joint efforts of all the participants, the publication of this article could not have been done without the hard work of everyone.
Conflict of interest
Authors HK and ZJ were employed by the company NARI Group, Ltd. and authors CR, GX, and HG were employed by the company Suzhou Electric Power Company.
Publisher’s note
All claims expressed in this article are solely those of the authors and do not necessarily represent those of their affiliated organizations, or those of the publisher, the editors and the reviewers. Any product that may be evaluated in this article, or claim that may be made by its manufacturer, is not guaranteed or endorsed by the publisher.
References
Alcala-Gonzalez, D., García del Toro, E. M., Más-López, M. I., and Pindado, S. (2021). Effect of distributed photovoltaic generation on short-circuit currents and fault detection in distribution networks: A practical case study. Appl. Sci. 11 (1), 405. doi:10.3390/app11010405
Azeroual, M., Boujoudar, Y., Bhagat, K., El Iysaouy, L., Aljarbouh, A., Knyazkov, A., et al. (2022). Fault location and detection techniques in power distribution systems with distributed generation: Kenitra City (Morocco) as a case study. Electr. Power Syst. Res. 209, 108026. doi:10.1016/j.epsr.2022.108026
Calderaro, V., Milanovic, J. V., Kayikci, M., and Piccolo, A. (2009). The impact of distributed synchronous generators on quality of electricity supply and transient stability of real distribution network. Electr. Power Syst. Res. 79 (1), 134–143. doi:10.1016/j.epsr.2008.05.022
Chunlan, D., Yi, G., and Yao, X. (2018). Research on access location of distributed power based on complex network theory [J]. Shandong Electr. power Technol. 45 (05), 40–44.
Energy and the Environment (2021). Construction and operation of photovoltaic power generation in the first half of 2021 [J]. Electr. Power Technol. Environ. Prot. 37 (04), 46.
GB/T 19964-2012 (2012). Technical Regulations for photovoltaic power station access to power system [S]. Beijing: Standards Press of China.
Hong, L., and Hongbo, Y. (2020). Analysis of working principle and physical Modeling method of photovoltaic cell [J]. Mech. Electr. Inf. 3 (6), 3–4.
Hongjuan, G., Haiyun, W., and Jingxiang, H. (2021). Study on the influence of access location of distributed power supply on distribution network voltage. J. Comput. Simul. 38 (08), 113–117.
Luning, L. (2019). Research on Multi-objective Reconfiguration of power generation and distribution network with distributed power [D]. Nanchang, China: Journal of East China Jiaotong University.
Liqun, L., Tianbao, L., and Chunxia, L. (2020). Solutions for the distributed photovoltaic access distribution network relay protection. J. Taiyuan Univ. Sci. Technol. 41 (03), 165–169+175.
Ming, D., Weisheng, W., and Xiuli, L. (2014). Review of the influence of large-scale photovoltaic power generation on power system. Proc. CSEE 34 (01), 1–14.
Mingjun, D. (2018). Photovoltaic cell modeling and MPPT simulation analysis [J]. Commun. power Technol. 35 (07), 30–32.
Ni, Q., Yanan, S., and Zhenhua, T. (2022). Influence of short circuit characteristics of distributed power supply on distribution network protection. Electr. Power Surv. Des. 2, 39–45+53.
Wu, Y., Lin, Z., Liu, C., Huang, T., Chen, Y., Ru, Y., et al. (2022). Resilience enhancement for urban distribution network via risk-based emergency response plan amendment for ice disasters. Int. J. Electr. Power & Energy Syst. 141, 108183. doi:10.1016/j.ijepes.2022.108183
Wu, Y. J., Liang, X. Y., Huang, T., Lin, Z., Li, Z., and Hossain, M. F. (2021). A hierarchical framework for renewable energy sources consumption promotion among microgrids through two-layer electricity prices. Renew. Sustain. Energy Rev. 145, 111140. doi:10.1016/j.rser.2021.111140
Wu, Y., Lin, Z., and Liu, C. (2021). A bargaining strategy-based game model of power demand response considering hydrogen-to-electricity conversion of industrial users. IEEE Trans. Industry Appl. 99, 1. doi:10.1109/TIA.2021.3088769
Xiao, W. (2018). Influence of distributed power access on relay protection of distribution network [J]. Electr. Equip. Econ. 6, 14–15.
Xuekai, H., Gan, Z., and Wenping, H. (2019). Analysis of influence of distributed power supply on automatic reclosing of line [J]. Power Syst. Prot. Control 47 (17), 75–82.
Yin, Z., Wang, Z., and Xue, S. (2020). Analysis of the influence of distributed photovoltaic power station grid connection on distribution network relay protection. J. Phys. Conf. Ser. 1639 (1), 012042. doi:10.1088/1742-6596/1639/1/012042
Yongfei, M., Chunlai, L., and Yanjiao, H. (2016). “Analysis of the influence of distributed generation access on the operation and management of distribution network,” in 2016 International Conference on Smart City and Systems Engineering (ICSCSE), Hunan, China, 25-26 November 2016 (IEEE), 194–196. doi:10.1109/ICSCSE.2016.0060
Keywords: renewable energy sources, modern power system, distributed power supply, photovoltaic (pv) power supply, distribution network failure, current protection
Citation: Kun H, Rong C, Jingtao Z, Xundong G and Guodong H (2023) Analysis of current protection in distribution networks with clean energy access. Front. Energy Res. 10:1035781. doi: 10.3389/fenrg.2022.1035781
Received: 03 September 2022; Accepted: 30 September 2022;
Published: 11 January 2023.
Edited by:
Yingjun Wu, Hohai University, ChinaReviewed by:
Cheng Chi, Hong Kong University of Science and Technology, Hong Kong SAR, ChinaQiang Xing, Southeast University, China
Copyright © 2023 Kun, Rong, Jingtao, Xundong and Guodong. This is an open-access article distributed under the terms of the Creative Commons Attribution License (CC BY). The use, distribution or reproduction in other forums is permitted, provided the original author(s) and the copyright owner(s) are credited and that the original publication in this journal is cited, in accordance with accepted academic practice. No use, distribution or reproduction is permitted which does not comply with these terms.
*Correspondence: Huang Kun, NjM0NTk2OTY0QHFxLmNvbQ==