- 1Department of Animal and Fish Production, College of Agricultural and Food Sciences, King Faisal University, Al-Ahsa, Saudi Arabia
- 2Fish Resources Research Center, King Faisal University, Al-Ahsa, Saudi Arabia
- 3Basic Sciences Department, PYD, King Faisal University, Hofuf, Saudi Arabia
- 4Center of Excellence for the Ocean, National Taiwan Ocean University, Keelung, Taiwan
- 5Department of Aquaculture, National Taiwan Ocean University, Keelung, Taiwan
- 6Fisheries and Marine Resource Technology Discipline, Khulna University, Khulna, Bangladesh
- 7Fish Conservation and Culture Lab, Biological and Agricultural Engineering, University of California, Davis, Davis, CA, United States
Production of biodiesel together with wastewater treatment and CO2 sequestration is a promising technology. The growing levels of carbon dioxide in the atmosphere increase the amount of dissolved CO2 in natural watercourses, triggering the increase in concentrations of bicarbonate and hydrogen ions while dropping those of carbonate and hydroxyl ions. The active carbon cycling in coastal areas, which can result in periodic and daily fluctuations in pH and CO2 concentrations that may surpass those anticipated for the extensive marine ecosystems, is regarded as one of the consequences of climate change. Studies were conducted to examine the effects of various pH levels on algal growth and lipid production in order to better understand how the growth of algae may be influenced in such conditions. In the present study, the influence of three different pH levels (6, 8, and 10) was studied to evaluate microalgae’s carbohydrate utilisation and lipid accumulation during the operation’s starvation phase (SP). Microalgae, in the study, were cultivated in two modes, namely mixotrophic [growth phase (GP)] and autotrophic [pH-induced (SP)] conditions. Enhancement in biomass formation, and intracellular carbohydrate accumulation were recorded during the GP operation, while noticeable lipid productivities (Total/neutral, 26.93/10.3%) were observed during SP operation at pH 8. Pigment analysis showed variations in both the procedures where higher Chl a concentration was noticed in GP, and higher Chl b was detected during SP. Nile red fluorescent staining strongly supports the existence of intracellular lipid bodies (LB). GC analysis of fatty acid methyl esters (FAME) showed the existence of a substantial amount of saturated fatty acids (SFA) compared with unsaturated fatty acids (USFA). Efficient wastewater treatment with nutrient assimilation was reported during the GP operation, demonstrating the phyco-remediation.
1 Introduction
Owing to the favourable potentiality for the treatment of wastewater, reduction of CO2, as well as production of biofuel, biochemical, and biomaterial, microalgae have been of great interest over the last few decades (Srimongkol et al., 2022; Venkata Subhash et al., 2022). Microalgae absorb nutrients such as N and P from wastewater and build up organic compounds intracellularly as they develop photosynthetically utilizing CO2 as a carbon source (Bhuyar et al., 2021). The high cost of nutrients provided as chemical salts, which is a key problem for large-scale microalgae production, can be reduced by growing microalgae using wastewater (Venkata Subhash et al., 2017; Li et al., 2019). In order to produce microalgal biomass for biorefineries as well as remediate wastewater, substantial research has been carried out to yield microalgae utilizing various wastewaters. (Chai et al., 2021; Mustafa et al., 2021). The rising worldwide scarcity of water and resources shows the potential of wastewater-based microalgae production for sustainability, yet, particularly concerning long-term stability, further study is required for its practical implementation (Li et al., 2019).
The buildup of lipids in microalgae is a sign of their adaptability to varied and challenging environmental circumstances (Sato et al., 2000). With regard to the environmental variations, certain microalgae are able to effectively alter their lipid metabolism (Kirrolia et al., 2013). Large amounts of algal biomass are generated during algal development under ideal circumstances, and their dry cell weight (DCW) has comparably modest lipid (5%–20%) contents (Ahmad et al., 2022). Microalgae, under stress conditions, change their lipid biosynthetic pathways to produce and accumulate neutral lipids, primarily appearing as triacylglycerides (TAG) (Venkata et al., 2011; Devi et al., 2013). Under ideal growth conditions, various microalgae naturally yield lipids (Venkata et al., 2011; Devi et al., 2012; Devi and Venkata, 2012). However, many species may promote the synthesis of neutral lipids in the form of TAG during stress, and these lipids are potential precursors for the manufacture of biodiesel (Hu et al., 2008; Moheimani and Parlevliet, 2013). Under some chemical or physical environmental stress conditions, microalgae can synthesize and accumulate greater levels of TAGs (Renaud et al., 2002; Hu et al., 2008; Jusoh et al., 2020; Zarrinmehr et al., 2020). Numerous studies have been performed on lipid induction strategies of various stressors on microalgae, including nutrient (Devi et al., 2012), carbon (Abou-Shanab et al., 2011), salinity (Venkata and Devi, 2014), heavy metals, as well as further chemical stresses (Richards and Mullins, 2013; Xia et al., 2014). Nitrogen deficiency is the utmost crucial nutrient impacting lipid metabolism in algae amongst the examined stress situations. (Venkata et al., 2011; Devi et al., 2012). It was observed in numerous species of microalgae and mixed microalgae (Venkata and Devi, 2014). In order to increase the synthesis of lipids, Hu et al. (2008) investigated the effects of nitrogen stress on a variety of green microalgae, cyanobacteria, and diatoms. In order to increase the synthesis of lipids, Hu et al. (2008) investigated the effects of nitrogen stress on a variety of green microalgae, cyanobacteria, and diatoms. To promote lipid biosynthesis and build up enough biomass, ideal pH values are also required in addition to determining the growth factors for microalgae biomass needed for biofuel generation (Blankenship, 2021).
The development of microorganisms, such as microalgae, is greatly influenced by pH because of its direct impact on NH3/NH4+ balance and nitrogen accessibility (Devi et al., 2012; Mathew et al., 2021). For optimum development, separate micro-organisms require separate pH ranges, and variations in ambient pH have an impact on the functionality of microorganisms, particularly the process of activating enzymes and proteins (Li et al., 2020). Despite the fact that the bulk of microalgae are known to prefer neutral pH, various species of microalgae have been shown to thrive in very acidic (pH < 5) or alkaline (pH > 9) circumstances (Gatamaneni et al., 2018). The pH of the medium can be altered by the growth of microalgae, which consequently has an impact on microalgal development (Yu et al., 2022). According to an investigation on the proton imbalance during microalgae culture, alkalinity was formed or used up determined by the nitrogen supply and its metabolic procedure, which caused a higher impact on the pH of the medium than CO2 absorption, (Wang and Curtis, 2016).
Since no additional harvesting processes are required and better growth may be sustained until producing stress conditions, a pH-based stress strategy could probably be simpler to scale up than nutritional stress. Little research has been performed on the use of pH as a stressor to cause lipid accumulation in algae. Therefore, employing mixed microalgae as biocatalysts, the current work was carried out to assess the impact of varied pH (6, 8, and 10) throughout the starvation phase (SP) of the operation. During the study, all the experimental setups were prepared with a light regime of 12/12 light:dark conditions to better understand the pH stress on lipid productivity. Biomass growth, pigment analysis, diversity changes, as well as the effectiveness in wastewater treatment were assessed all through the growth phase (GP), whereas lipid production was analyzed during the operation phases. In addition fatty acid composition concerning defined pH variation was also evaluated.
2 Materials and methods
2.1 Mixed microalgae collection, identification, and cultivation
In this work, a mixed microalgae culture that was taken from the Alasfar lake outflow channel (Alhasa, Eastern Province, Saudi Arabia) was employed as a biocatalyst. Prior to the experiment, the obtained culture was cleaned two times using distilled water and pelletized by centrifuging three times at 3,000 rpm for 10 min at 30°C to eliminate the allied debris. Domestic sewage was used as a growth medium to rebuild the microalgae biomass in 36 cm × 24 cm × 12 cm oblong tubes made of plastic without exposing to sunlight. The biomass was sporadically mixed throughout the early phase of culture management to prevent settling and consistent circulation of sunlight to the cells. This culture served as the parent inoculum for the trial investigation after consistent biomass and cell density were established.
2.1.1 Experimental Design
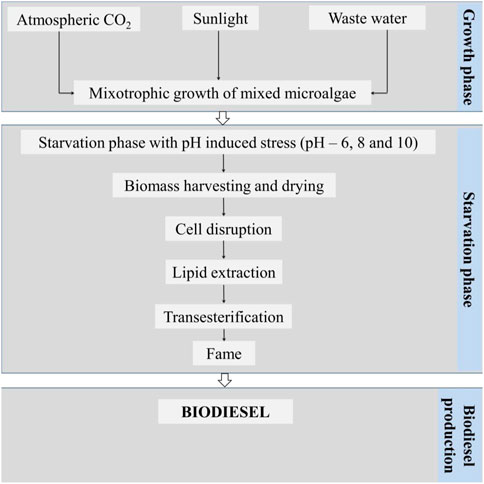
The experiment was set up and carried out in two different stages, the first being a growth phase (GP; biomass enhancement; 8 days) under a mixotrophic mode of nourishment, and the second being a starvation phase (SP) induced by pH stress (Figure 1). The growth phase was carried out with the mixotrophic method and used domestic sewage as a substrate including extra carbon (500 mg glucose/l), nutrients (500 mg NaNO3/l; 500 mg Na2PO4/l), an antibiotic solution (ampicillin, 25 mg/L) at a pH of 8.2 keeping the temperature at 28 (±3) °C in a shady area. The cultures were collected by discharging the effluent from the tub-small scale open cultivation practice (1 m2 pond) after the 8-day growing period. The dewatered culture served as the SP’s inoculum of the experimentation.
There were three distinct pH levels used in the SP experiment: 6, 8, and 10. Prior to the operation, 20 ml of microalgal biomass was added to 160 ml of tap water and the container was then sealed with cotton plugs. The entire experimental procedure was reserved in a heat regulated shaking incubator (120 rpm). Estimates of biomass, cell density, pigment analysis (chlorophyll a and b), and the total cellular carbohydrate contents were made every other day while the GP and SP were in operation. Lipid analysis was performed at the beginning (prior to GP), at the end of GP, and SP. Following SP, the biomass was detached by centrifugation (5,000 rpm; 5 min at 28°C), and the algal biomass pellet was dried using the sunlight before being blended into powder. By use of a sonicator (20 kHz) for 30 min (Power-Sonic 410), the blended powder was then interrupted, and the lipid extracted was utilized for analysis. The data provided here are the outcome of an average of three separate experiments, each conducted in triplicate.
2.1.2 Lipid extraction
Solvent extraction using a mixture of chloroform, methanol for total lipids (Venkata and Devi, 2014) and n-hexane for neutral lipids (Devi et al., 2012) were employed to extract the total and neutral lipids from dried algal biomass. On the basis of the proportion of total lipid extracted to dry weight of algae, the following formula was applied to calculate lipid productivity (%):
2.1.3 Conversion of lipids to FAME
Algal lipid (100 mg) was refluxed with a combination of 100:1 ml methanol and sulfuric acid for 4 h while the reaction was being monitored by thin-layer chromatography (TLC) with a mobile phase made up of a 90:10 mixture of n-hexane and ethyl acetate (EA). The feedback was kept up until the oil stain on the TLC plate vanished. As the reaction period (4 h) was over, the contents were rinsed with 25 ml of distilled water, and the aqueous layer was pulled out with EA (2 × 25 ml) and collected. The essence was concentrated in a vacuum after being dried on anhydrous Na2SO4. The resulting lipid underwent transesterification to FAME before being GC-FID examined. The resultant FAME composition was compared to the standard FAME mix, C8-C22 (SUPELCO) (Subhash and Venkata, 2011; Devi et al., 2012; Venkata and Devi, 2014).
2.2 Analysis
2.2.1 Assessment of algal biomass and pigments (chlorophyll a and b)
Total wet biomass was calculated using a spectrophotometer by measuring the OD 750 (Yeh and Chang, 2011). Algal cell density (D) was calculated by optical density (OD) at 750 nm employing the following equation. (He et al., 2019).
Total chlorophyll content of the cultured algae was (Chl a and b) measured by calorimetrically (Jeffrey and Humphrey, 1975). Briefly, Algal cells (2 ml) were washed with distilled water and concentrated by centrifugation (7,000 rpm; 5 min), and the reconstituted pellet was then resuspended and washed in 1 ml of phosphate buffer solution (PBS) at a similar speed. The resultant algal shoot was extracted using 2 ml of acetone after being disturbed in an ultrasonic water immersion for 7 min at 20 kHz. The supernatant’s OD was calculated at 647 nm and 664 nm after the extract had been centrifuged at 3,000 rpm for 5 min. Considering the OD readings, the following formulas were used to compute chlorophyll a and chlorophyll b concentrations (lg/ml):
2.2.2 Determination of intracellular lipid bodies
In order to reveal Nile red fluorescence staining, intracellular lipid bodies (LBs) in the algal biomass were examined (Kimura et al., 2004; Katre et al., 2012; Debowski et al., 2013). Acquired from Aldrich Chemical, Nile red (9-diethylamino-5-benzo [α] hexazinone) was diluted in 0.1 mg/ml of acetone. The algal biomass was mixed with 10 µL of Nile red (0.1 mg/ml) to measure the intracellular lipids. After thoroughly blending, the combination of 50–100 µL algal culture and 2 ml PBS was stored for 5 min in a dark area. A Nikon Eclipse 80i epifluorescent microscope with a built-in digital camera (YIM-smt, 5.5 megapixels) was used for the microscopy. NIS-elements (D3.0) software program along with Cy3 and Fluorescein Isothiocyanate (FITC) fluorescent filters was used to shoot photos.
2.2.3 Determination of cellular carbohydrate
The Anthrone method was utilized to determine the total soluble carbohydrate content (TSCC) in the cells of algae (wet weight) (Morris, 1948). 2 ml of algal cells were washed with distilled water and centrifuged (7,000 rpm; 5 min), and then the resultant pellet was resuspended in 2 ml of phosphate buffer solution (PBS) and centrifuged at the same speed. The pellet of algae was disturbed in an ultrasonic water immersion up to 7 min (20 kHz) and homogenized to make a slurry. 1 ml of distilled water was added to the slurry and used for analysis. The amount of carbohydrate present in the algal cell was estimated by taking the OD 640.
2.2.4 Determination of fatty acid methyl esters
The produced lipid was converted to FAME and then examined utilizing GC-FID. The resultant FAME composition was juxtaposed with the standard FAME mix, C8-C22 (SUPELCO) (Subhash and Venkata, 2011; Devi et al., 2012; Venkata and Devi, 2014).
3 Results and discussion
3.1 Changes in biomass during growth and stress phases
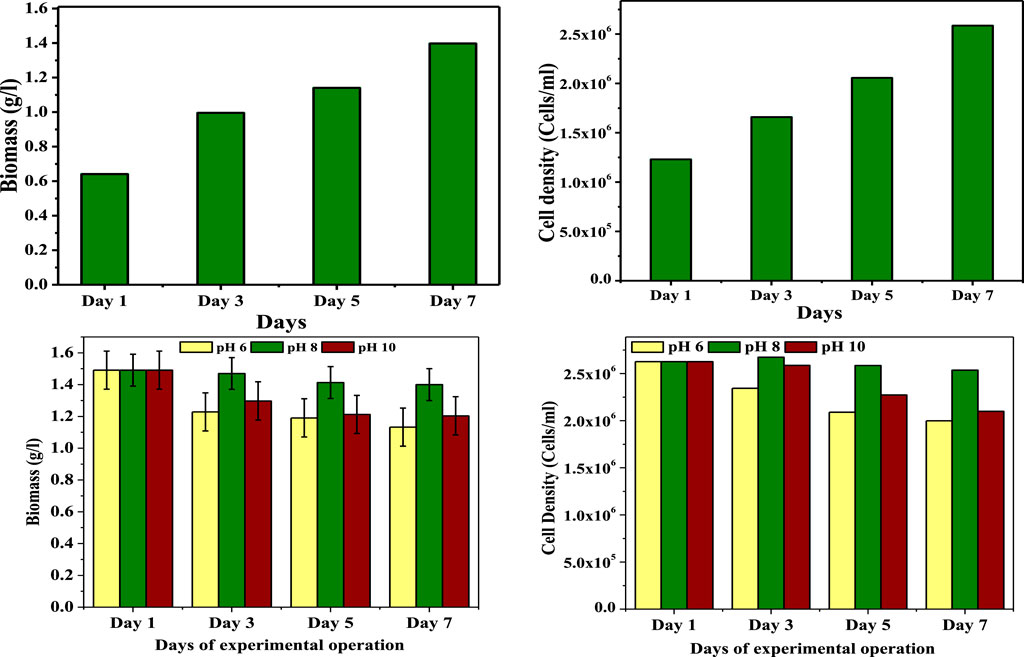
The growth of biomass, pigment profile, carbohydrate synthesis, and lipid consumption were all significantly influenced by the dual-mode [mixotrophic (GP); autotrophic (SP)] culture of microalgae. Mixotrophic mode of operation during the GP led to a considerable increase in the biomass, cell density, pigment concentration (chlorophyll) and intracellular carbohydrate accumulation (Figure 2). Following the starting concentration on day 0th (0.42 g/L), the biomass increased to 0.7 g/L (3rd day), and then 1.1 g/L during the operation (5th day).”Maximum biomass concentration was noticed at the end of GP operation (1.49 g/L; 8th day). Cell concentration at the end of GP operation was 2.5 × 10⁶ cell/ml; this was higher than the 1st day (1.2 × 10⁶) followed by 3rd day (1.6 × 10⁶) and 5th day (2.0× 10⁶). Considerable rise in all growth parameters might be due to wastewater containing different elements such as soluble organic, inorganic, insoluble inorganic materials, macro solids, and so on. (Abou-Shanab et al., 2011). During the growth, the microalgae have utilized the soluble fraction (carbon, nitrogen and phosphate) for biomass enhancement. Along with the wastewater nutrients, algae could sequester the atmospheric CO2 (Molazadeh et al., 2019). The data confirmed that microalgae could utilize glucose and CO2 as organic and inorganic carbon sources by following the combined photosynthetic and heterotrophic metabolism; it was clear that microalgae used CO2 as a carbon source while growing in wastewater under the provision of light. Considerably higher biomass could be achieved with mixotrophic growth, which would be advantageous for biomass enhancement.
Throughout SP, the batch experiments with varied pH conditions revealed variation in biomass survivability and cell density. Among all the pH driven conditions, pH at 6 (1.1 g/L; 1.9 × 10⁶ cells/ml) and 10 (1.2 g/L; 2.1 × 10⁶ cells/ml) conditions showed more influence on the biomass (algal cells) and cell density. On the contrary, pH 8 (1.4 g/L; 2.5 × 10⁶ cells/ml) showed an insignificant drop compared with the initial concentration (1.49 g/L) of SP. During day 1, a sudden drop in the biomass was noticed in pH 6 (1.22 g/L; 2.3 × 10⁶ cells/ml) and pH 10 (1.27 g/L; 2.5 × 10⁶ cells/ml), and a negligible drop was noticed in pH 8 (1.47 g/L; 2.6 × 10⁶ cells/ml). At the pH 6 operated condition during the 5th day (1.19 g/L; 2.0 × 10⁶ cells/ml), a biomass drop was noticed and continued to the end of SP, but in the case of pH 10, the drop was stabilized (5th day, 1.21 g/L, 2.2 × 10⁶ cells/ml; end of SP, 1.20 g/L, 2.1 × 10⁶ cells/ml), maintained in constant level and followed by pH 8, where a very negligible drop in the biomass was observed during SP (5th day, 1.41 g/L, 2.58 × 10⁶ cells/ml; 1.40 g/L, 2.53 × 10⁶ cells/ml). Variations in the biomass and cell density concentrations might be due to the pH levels being less than 7.5 and higher than 8, which could adversely affect the growth of microalgae. The development of microalgae was repressed by alkaline pH, which diverted the energy to create TAG (Subhash and Venkata, 2011). The low biomass concentration and cell density might be due to the cell damage. These results indicated that pH levels being lower and higher than these ranges could inhibit photosynthesis and affect the morphology of algae.
3.1.1 Algal pigment changes
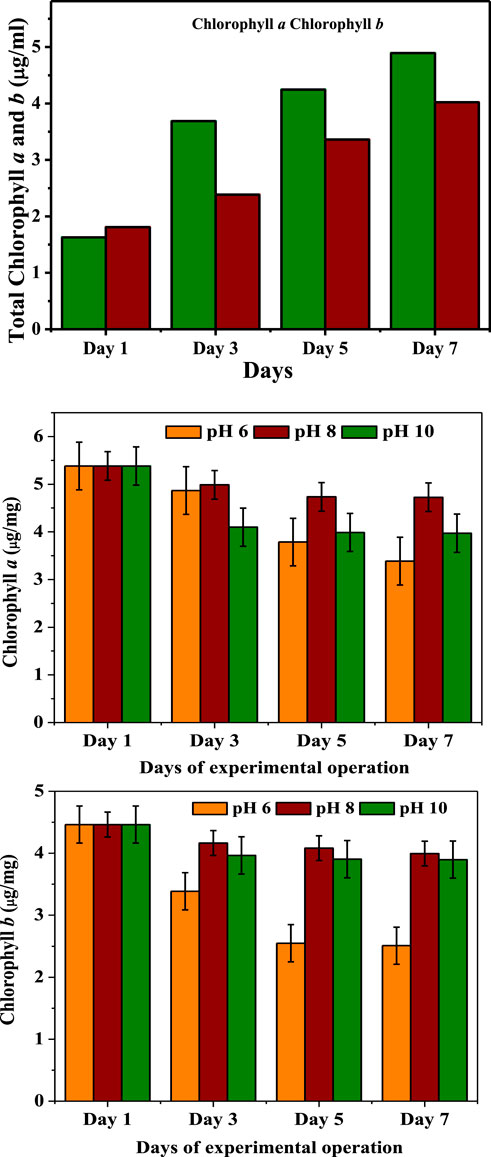
Pigment analysis (Chl a and b) revealed clear variations throughout the course of the investigation. Higher concentration of chlorophyll a than b was observed during the GP. A rise in the Chl a concentration of algal culture reflected higher biomass production (Figure 3). At the end of GP, chlorophyll a and b concentrations were discovered at 5.3 μg/ml and 4.4 μg/ml, successively, and the concentrations were higher than the initial phase (1.6 μg/ml; 1.4 μg/ml). Higher Chl a concentration directly supports the new biomass formation leading to the growth in the cell density (Venkata and Devi, 2012). This is because of the ratio of Chl a to biomass that can vary among algal cultures, and the measurement of Chl a concentration is considered a reasonable estimate of algal concentrations.
In contrast, greater concentration of Chl b and lower concentration of Chl a became evident at the final stage of SP. During the SP operation, the pH 8 operated condition showed higher Chl b than a concentration compared with the other pH operated conditions. At the end of SP, Chl b and a under pH 8 (4.7 μg/ml, 3.9 μg/ml) were observed followed by pH 10 (3.9 μg/ml, 3.7 μg/ml) and pH 6 (3.6 μg/ml, 2.5 μg/ml) in comparison with the initial condition (5.38 μg/ml; 4.46 μg/ml). The results for chlorophyll changed during the GP and SP phases showing variations in both Chl a and b concentrations, and there was a specific increase of Chl a related to pH variation. Under stress condition, Chlorophyll’s methyl groups may have been replaced by formyl groups, resulting in higher Chl b concentrations during the SP (Venkata and Devi, 2012). The SP operation demonstrated biomass development in response to lower Chl a concentration, indicating the impact of pH on growth instead of on chlorophyll. Chlorophyll loss was observed by visual colour differences in the algal cells, and the same observations were made in pH at 6 and 10 conditions of SP. Under pH 6 condition, the magnesium molecule (Mg+2) was lost, and the colour changed to the characteristic pheophytin olive green colour. In pH 10 (alkaline) condition, the methyl and phytyl esters were removed by producing chlorophyll in which there showed a bright green colour. Chl a concentration rapidly dropped, which might be due to its less stability than chlorophyll b in the operated pH conditions (Rai et al., 2015). At the end of the experiments, the chlorophyll concentration decreased due to the susceptibility to chemical or enzymatic (enzymes, weak acids, oxygen, light, pH and heat) degradation reactions (Hynstova et al., 2018). Throughout the SP, hydrogen ions can convert chlorophylls to their corresponding pheophytins by replacing the magnesium ion in the porphyrin ring. This reaction can cause discoloration, which may be caused by the chlorophylls’ conversion to pheophytins under the effect of pH. Chlorophyll was converted to pheophytin and pheophorbide, which change the color from brilliant green to a mild olive green or olive yellow.
3.1.2 Lipid profile
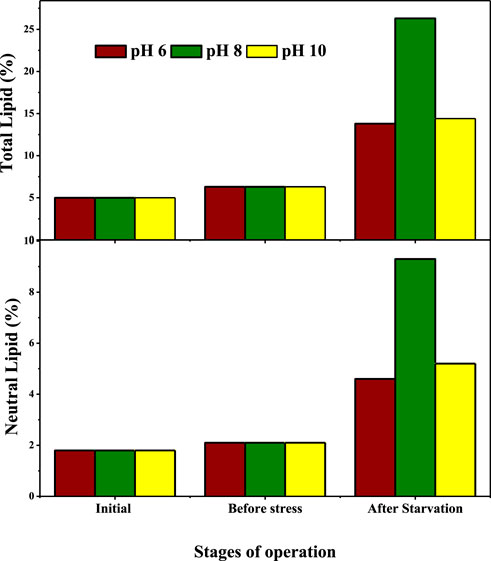
Data on lipid profiles revealed changes in lipid production in relation to the GP and SP experiments. Total lipid (TL) and neutral lipid (NL) profiles showed significant variations in all the conditions and were found to be uniform (6.3% and 2.1%) which were later increased during the experimental study (Figure 4). Lipid productivity profiles noticed after SP operation was two-fold higher than GP (Venkata and Devi, 2012; Vasistha et al., 2021). Comparatively, higher lipid productivity (total and neutral lipid) was noticed in pH at 8 operated conditions (26.93% and 9.3%) followed by pH 10 (14.4% and 5.2%) and pH 6 (13.8% and 4.6%). In this condition, higher lipid productivity was observed at pH 8 (15.4% and 5.2%) followed by pH 10 (10.3% and 3.8%) and pH 6 (8.8% and 2.8%). The yields of lipid productivities were well correlated with the intracellular carbohydrate utilization, as well as higher lipid productivity was proportional to the more utilization of intracellular carbohydrate content. Higher lipid production in various operating conditions were noticed among all conditions in the pH eight operating condition. Maximum lipid productivity in all conditions might be due to the nutrient-deprived (nitrogen, carbon, phosphorous etc.) conditions and the pH stress on microalgae (Venkata and Devi, 2012). The nutrient-deprived condition at this pH range stimulates all the enzymatic activities (fatty acid acyl Co-A and activate diacylglycerol acyltransferase) to arrest protein synthesis (nitrogen deprived condition) resulting in feedback inhibition of the citric acid cycle and inhibiting the photosynthetic efficiency to carbon fixation, which leads to the utilization of intermediate carbohydrate metabolites created by the process to yield triacylglycerols (TAGs) through the Kennedy pathway (Skrupski et al., 2013).
3.1.3 Intracellular carbohydrate levels Vs. lipid productivity
At the final state of GP and SP, the intracellular carbohydrate that microalgae had accumulated during GP was assessed. The detected lipid production patterns were consistent and well interrelated with carbohydrate concentrations, indicating that greater carbohydrate concentrations tend to accumulate less lipids. (Figure 5). Similarly, lower carbohydrate concentration reflects higher lipid productivity (Venkata and Devi, 2014). Intracellular carbohydrate concentration after the mixotrophic operation showed higher concentrations (223.4 mg/g algae), higher than the initial concentrations (29.2 mg/g algae), depicting the higher carbohydrate accumulation using organic carbon sources. The observed pattern of CHO accumulation in the algal cells is mainly due to the efficient utilization of available carbon and CO2 sequestration. The intracellular carbohydrate levels decreased during the SP experimentation, but the abatement differed regarding the defined conditions. The decline in the intracellular CHO indicates the intracellular conversion of CHO to lipids. The pattern of CHO utilization was related to lipid productivities noticed after SP operation. During SP, a higher amount of carbohydrate was utilized at pH 8, and it was well correlated with the lipid profiles. A significantly lesser intracellular carbohydrate utilization was noticed in the pH 6 operated condition. The leftover carbohydrate concentration in the cell was significantly higher (183.4 mg/g algae) than other used conditions. This was followed by pH 10 (163.5 mg/g algae) and pH 8 (108.3 mg/g algae). Comparatively, a higher amount of intracellular carbohydrate was utilized at pH 8 condition, which was well correlated with the lipid production profile. The documented results depict that the conditions with higher carbohydrate concentrations showed lesser production of lipid that can be connected with the non-conversion of carbohydrates to lipids and vice-versa.
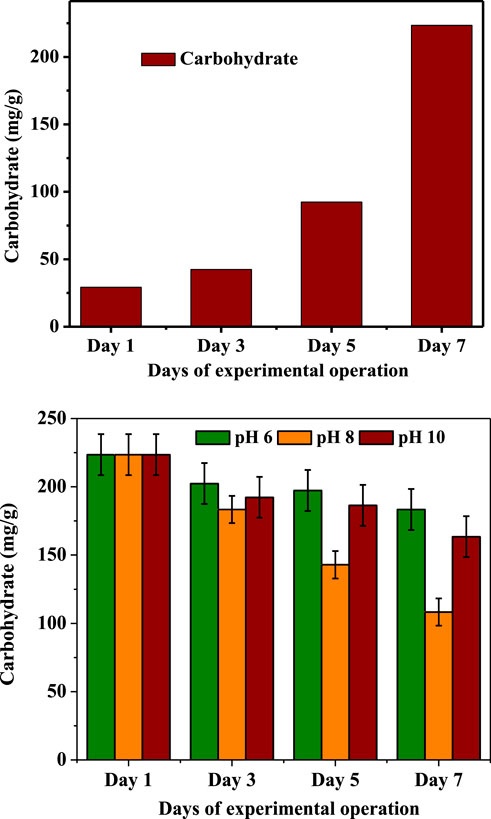
FIGURE 5. Changes in intracellular carbohydrate concentration during the growth phase and pH-induced stress phase.
3.1.4 FAME composition with the function of pH condition
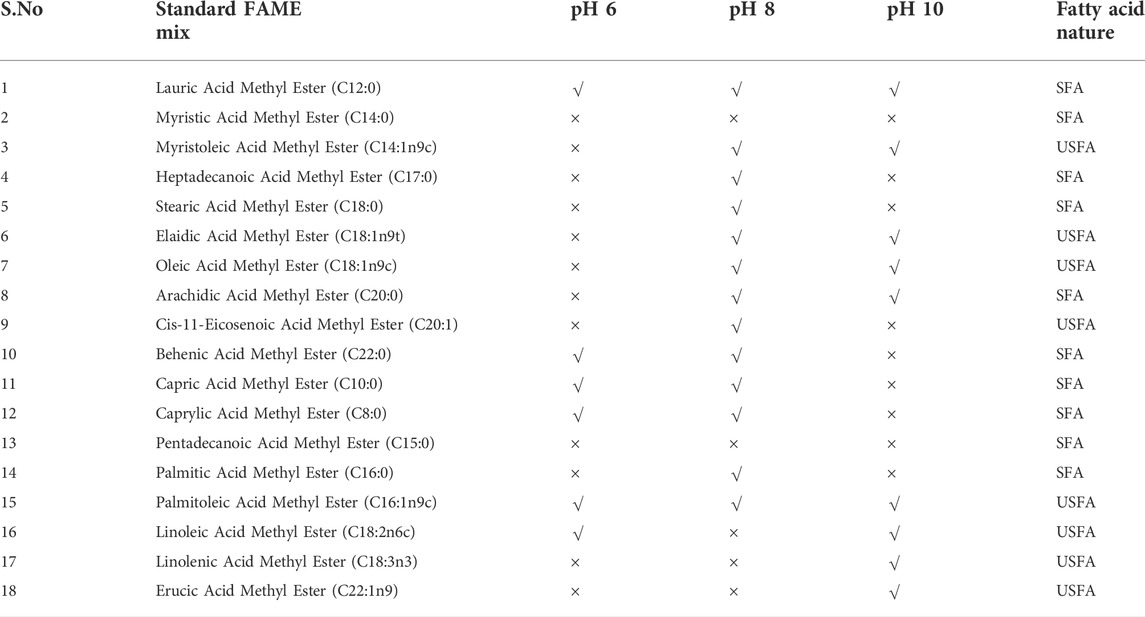
The total and neutral lipid fractions underwent the fatty acid composition (after GP and SP). Seventeen fatty acids were included in the fatty acid profile, of which 11 were saturated fatty acids (SFA) and 8 were unsaturated fatty acids (USFA). Table 1 shows the fatty acid concentrations and changes that were observed. Higher SFA than USFA was registered during the compositional analysis. A higher concentration of SFA than USFA in the algal-based lipid will favour biofuel production with less combustion characteristic (Subhash and Venkata, 2014). During the experimental study, a higher amount (number) of SFA than USFA composition was noticed at pH 8 (9:4), followed by pH 10 (5:2) and pH 6 (6:3). The composition of SFA favoured the use of algal lipid as a biofuel due to the inclusion of caprylic acid, methyl ester, capric acid, lauric acid, stearic acids, and palmitic acid. The operating condition at optimal pH showed a good total fatty acid profile depicting the storage of total lipids in neutral lipids. Alkaline pH stress leads to tri acyl glyceride (TAG) accumulation and declines membrane lipids.
3.1.5 Evaluation of mixed microalgal diversity
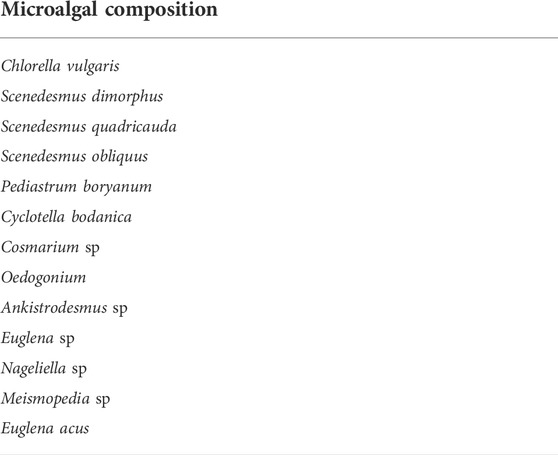
In the present studies, different microalgal species were observed in the culture collected during GP. Microalgae viz., Scenedesmus sp., centric (Coscinodiscophyceae) and pinnate diatoms (Bacillariophyceae), Pediastrum boryanum, Cyclotella bodanica, Cosmarium sp., Chlorella vulgaris, Oedogonium, Ankistrodesmus, Euglena and Nageliella were observed in the experimental study (Table 2). Microalgae have a lipid accumulation trait that varies by species. The microalgal range was varied according to the defined condition during the SP operation. A comparatively higher microalgal population was survived in LPP, pH 8 operated condition. In this defined condition, the survivability of Scenedesmus dimorphus, Scenedesmus quadricauda, Scenedesmus obliquus, diatoms and C. vulgaris was more than the other species. All the survived species were reported for higher lipid productivity (Devi et al., 2012). pH 10 operated condition documented the survivability of P. boryanum, centric and pinnate diatoms and C. vulgaris. A significantly less diversity profile was recorded in pH 6, where the C. vulgaris sp. Was dominant over others, and this is because of the survivability nature of such species under pH 6 conditions. The changes in lipid productions and the diversity of species seen under various operating situations were analogous and generally agreed upon.
3.1.6 Nile red staining for neutral lipids
While carbon is accessible, and vital elements like nitrogen are limited, oleaginous microorganisms (algae, bacteria, and fungus) accumulate significant quantities of lipids (Subhash and Venkata, 2014). In single-cell organisms, these accumulated lipids are stored in the form of intracellular lipid bodies (LBs) that are clearly noticed by Nile red fluorescence stains. (Kimura et al., 2004; Jusoh et al., 2020). In the present study by using Nile red fluorescence, at pH 8 operating conditions during the SP, the algal culture showed more LBs than other operating states at pH 10 and 6. Between day 1 and day 8, the stress phase saw an increase in lipid bodies within the algal cells. Fluorescence microscopy revealed that the LBs were ellipsoidal and circular in shape. The increased concentration of lipid bodies may be the result of the effective use of intracellular CHO and nitrogen limiting circumstances. Neutral lipids are kept in exclusive booths known as LB in eukaryotes (algae). They are accumulated in the ER’s technical subdomain, which accommodates the majority of structural and biosynthetic enzymes (Wältermann et al., 2005). The neutral lipids are placed between the two leaflets of the membrane bilayer as they cannot fit among the phospholipids. TAG makes up the majority (up to 90% and even more) of the neutral lipids in LB, and a phospholipid monolayer surrounds the neutral lipid core of the LB.
3.1.7 Wastewater treatment
COD removal efficiency (projected in the final state of BGP and LIP) presented efficient substrate degradation during GP. The mixotrophic operation showed maximum removal efficiency of 82% due to the availability of nutrients in the wastewater biomass. The application of such elements may be as a consequence of the system pH (8.2–9.0), one of the variables that can impact the use and buildup of organic compounds by aquatic organisms throughout numerous processes triggering the development in biomass concentration. The pH of the system can change the chemical characteristics of pollutants, particularly their water solubility (Venkata and Devi, 2012; Venkata and Devi, 2014). The pH of the system should, therefore, have an impact on how substances are transported from the water and how they interact with algal surfaces, influencing the way intracellular carbohydrates are accumulated by algae. Collecting a higher amount of carbohydrates during GP was one of the positive results obtained during this study.
4 Conclusion
Mixotrophic mode of operation during GP influenced higher biomass and carbohydrate accumulation by remediating wastewater. pH-induced stress during SP documented high lipid productivity. Accumulating elevated LBs under pH 8 induced stress conditions is positive evidence for converting intracellular carbohydrates to lipids. After GC analysis of FAME at the end of SP, a greater SFA proportion than USFA was recorded. Microalgae can be used to produce biofuel, which is a least expensive experimental strategy that may be used as a substitute stage to focus on the upcoming energy issue.
Data availability statement
The raw data supporting the conclusion of this article will be made available by the authors, without undue reservation.
Author contributions
YA and RM conceived and designed experiments. YA, GN, and RM performed laboratory and field experiments. YA, RM, SR, and MR performed data analysis. YA and RM managed funding and supervised experiments. GN, SR, MR, and YA wrote the manuscript. All authors discussed the findings and reviewed on the manuscript.
Funding
This work was supported through the annual funding track by the Deanship of Scientific Research, Vice Presidency for Graduate Studies and Scientific Research, King Faisal University, Saudi Arabia [Project No. AN000240].
Conflict of interest
The authors declare that the research was conducted in the absence of any commercial or financial relationships that could be construed as a potential conflict of interest.
Publisher’s note
All claims expressed in this article are solely those of the authors and do not necessarily represent those of their affiliated organizations, or those of the publisher, the editors and the reviewers. Any product that may be evaluated in this article, or claim that may be made by its manufacturer, is not guaranteed or endorsed by the publisher.
References
Abou-Shanab, R. A. I., Hoon, H. J., Yunchul, C., Min, B., and Jeon, B. H. (2011). Characterisation of microalgal species isolated from freshwater bodies as a potential source for biodiesel production. Appl. Energy 88, 3300–3306. doi:10.1016/j.apenergy.2011.01.060
Ahmad, S. F., Mofijur, M., Parisa, T. A., Islam, N., Kusumo, F., Inayat, A., et al. (2022). Progress and challenges of contaminate removal from wastewater using microalgae biomass. Chemosphere 286, 131656. doi:10.1016/j.chemosphere.2021.131656
Bhuyar, P., Trejo, M., Dussadee, N., Unpaprom, Y., Ramaraj, R., and Whangchai, K. (2021). Microalgae cultivation in wastewater effluent from tilapia culture pond for enhanced bioethanol production. Water Sci. Technol. 84, 2686–2694. doi:10.2166/wst.2021.194
Blankenship, R. (2021). Molecular mechanism of photosynthesis. John Wiley & Sons. ISBN: 978-0-632-04321-7.
Chai, W. S., Tan, W. G., Halimatul Munawaroh, H. S., Gupta, V. K., Ho, S. H., and Show, P. L. (2021). Multifaceted roles of microalgae in the application of wastewater biotreatment: A review. Environ. Pollut. 269, 116236. doi:10.1016/j.envpol.2020.116236
Dębowski, M., Zieliński, M., Grala, A., and Dudek, M. (2013). Algae biomass as an alternative substrate in biogas production technologies—Review. Renew. Sustain. Energy Rev. 27, 596–604. doi:10.1016/j.rser.2013.07.029
Devi, M. P., Swamy, Y. V., and Venkata, M. S. (2013). Nutritional mode influences lipid accumulation in microalgae with the function of carbon sequestration and nutrient supplementation. Bioresour. Technol. 142, 278–286. doi:10.1016/j.biortech.2013.05.001
Devi, M. P., and Venkata, M. S. (2012). CO2 supplementation to domestic wastewater enhances microalgae lipid accumulation under mixotrophic microenvironment: Effect of sparging period and interval. Bioresour. Technol. 112, 116–123. doi:10.1016/j.biortech.2012.02.095
Devi, M., Venkata, S. G., and Venkata, M. S. (2012). Heterotrophic cultivation of mixed microalgae for lipid accumulation and wastewater treatment during sequential growth and starvation phases: Effect of nutrient supplementation. Renew. Energy 43, 276–283. doi:10.1016/j.renene.2011.11.021
Gatamaneni, B. L., Orsat, V., and Lefsrud, M. (2018). Factors affecting growth of various microalgal species. Environ. Eng. Sci. 35, 1037–1048. doi:10.1089/ees.2017.0521
Hu, Q., Sommerfeld, M., Jarvis, E., Ghirardi, M., Posewitz, M., Seibert, M., et al. (2008). Microalgal triacylglycerols as feedstocks for biofuel production: Perspectives and advances. Plant J. 54, 621–639. doi:10.1111/j.1365-313X.2008.03492.x
Hynstova, V., Sterbova, D., Klejdus, B., Hedbavny, J., Huska, D., and Adam, V. (2018). Separation, identification and quantification of carotenoids and chlorophylls in dietary supplements containing Chlorella vulgaris and Spirulina platensis using high-performance thin-layer chromatography. J. Pharm. Biomed. Anal. 148, 108–118. doi:10.1016/j.jpba.2017.09.018
Jeffrey, S. W., and Humphrey, G. F. (1975). New spectrophotometric equations for determining chlorophylls a, b, c1 and c2 in higher plants, algae and natural phytoplankton. Biochem. Physiol. Pflanz. 167, 191–194. doi:10.1016/S0015-3796(17)30778-3
Jusoh, M., Kasan, N. A., Hashim, F. S., Haris, N., Zakaria, M. F., Mohamed, N. N., et al. (2020). Isolation of freshwater and marine indigenous microalgae species from Terengganu water bodies for potential uses as live feeds in aquaculture industry. Int. Aquat. Res. 12, 74–83. doi:10.22034/IAR(20).2020.671730
Katre, G., Joshi, C., Khot, M., Zinjarde, S., and Ravikumar, A. (2012). Evaluation of single cell oil (SCO) from a tropical marine yeast Yarrowia lipolytica NCIM 3589 as a potential feedstock for biodiesel. Amb. Express 2, 36–14. doi:10.1186/2191-0855-2-36
Kimura, K., Yamaoka, M., and Kamisaka, Y. (2004). Rapid estimation of lipids in oleaginous fungi and yeasts using Nile red fluorescence. J. Microbiol. Methods 56, 331–338. doi:10.1016/j.mimet.2003.10.018
Kirrolia, A., Bishnoi, N. R., and Singh, R. (2013). Microalgae as a boon for sustainable energy production and its future research & development aspects. Renew. Sustain. Energy Rev. 20, 642–656. doi:10.1016/j.rser.2012.12.003
Li, K., Liu, Q., Fang, F., Luo, R. H., Lu, Q., Zhou, W. G., et al. (2019). Microalgae-based wastewater treatment for nutrients recovery: A review. Bioresour. Technol. 291, 121934. doi:10.1016/j.biortech.2019.121934
Li, K. Q., Li, M., He, Y. F., Gu, X. Y., Pang, K., Ma, Y. P., et al. (2020). Effects of pH and nitrogen form on Nitzschia closterium growth by linking dynamic with enzyme activity. Chemosphere 249, 126154. doi:10.1016/j.chemosphere.2020.126154
Mathew, R. T., Alkhamis, Y. A., Rahman, S. M., and Alsaqufi, A. S. (2021). Effects of microalgae Chlorella vulgaris density on the larval performances of fresh water prawn Macrobrachium rosenbergii (De Man, 1879). Indian J. Anim. Res. 55, 303–309. doi:10.18805/IJAR.B-1335
Moheimani, N. R., and Parlevliet, D. (2013). Sustainable solar energy conversion to chemical and electrical energy. Renew. Sustain. Energy Rev. 27, 494–504. doi:10.1016/j.rser.2013.07.006
Molazadeh, M., Ahmadzadeh, H., Pourianfar, H. R., Lyon, S., and Rampelotto, P. H. (2019). The use of microalgae for coupling wastewater treatment with CO2 biofixation. Front. Bioeng. Biotechnol. 7, 42. doi:10.3389/fbioe.2019.00042
Morris, D. L. (1948). Quantitative determination of carbohydrates with Dreywoods anthrone reagent. Science 107, 254–255. doi:10.1126/science.107.2775.254
Mustafa, S., Bhatti, H. N., Maqbool, M., and Iqbal, M. (2021). Microalgae biosorption, bioaccumulation and biodegradation efficiency for the remediation of wastewater and carbon dioxide mitigation: Prospects, challenges and opportunities. J. Water Process Eng. 41, 102009. doi:10.1016/j.jwpe.2021.102009
Rai, M. P., Gautom, T., and Sharma, N. (2015). Effect of salinity, pH, light intensity on growth and lipid production of microalgae for Bioenergy application. OnLine J. Biol. Sci. 15, 260–267. doi:10.3844/ojbsci.2015.260.267
Renaud, S. M., Thinh, L. V., Lambrinidis, G., and Parry, D. L. (2002). Effect of temperature on growth, chemical composition and fatty acid composition of tropical Australian microalgae grown in batch cultures. Aquaculture 211, 195–214. doi:10.1016/S0044-8486(01)00875-4
Richards, R. G., and Mullins, B. J. (2013). Using microalgae for combined lipid production and heavy metal removal from leachate. Ecol. Modell. 249, 59–67. doi:10.1016/j.ecolmodel.2012.07.004
Sato, N., Hagio, M., Wada, H., and Tsuzuki, A. M. (2000). Environmental effects on acidic lipids of thylakoid membranes. Biochem. Soc. Trans. 28, 912–914. doi:10.1042/bst0280912
Skrupski, B., Wilson, K. E., Goff, K. L., and Zou, J. (2013). Effect of pH on neutral lipid and biomass accumulation in microalgal strains native to the Canadian prairies and the Athabasca oil sands. J. Appl. Phycol. 25, 937–949. doi:10.1007/s10811-012-9930-1
Srimongkol, P., Sangtanoo, P., Songserm, P., Watsuntorn, W., and Karnchanatat, A. (2022). Microalgaebased wastewater treatment for developing economic and environmental sustainability: Current status and future prospects. Front. Bioeng. Biotechnol. 10, 904046. doi:10.3389/fbioe.2022.904046
Subhash, G. V., and Venkata, M. S. (2011). Biodiesel production from isolated oleaginous fungi Aspergillus sp. using corncob waste liquor as a substrate. Bioresour. Technol. 102, 9286–9290. doi:10.1016/j.biortech.2011.06.084
Subhash, G. V., and Venkata, M. S. (2014). Lipid accumulation for biodiesel production by oleaginous fungus Aspergillus awamori: Influence of critical factors. Fuel 116, 509–515. doi:10.1016/j.fuel.2013.08.035
Vasistha, S., Khanra, A., Clifford, M., and Rai, M. P. (2021). Current advances in microalgae harvesting and lipid extraction processes for improved biodiesel production: A review. Renew. Sustain. Energy Rev. 137, 110498. doi:10.1016/j.rser.2020.110498
Venkata, M. S., and Devi, M. P. (2012). Fatty acid-rich effluent from acidogenic biohydrogen reactor as substrate for lipid accumulation in heterotrophic microalgae with simultaneous treatment. Bioresour. Technol. 123, 627–635. doi:10.1016/j.biortech.2012.07.004
Venkata, M. S., Devi, M. P., Mohanakrishna, G., Amarnath, N., Babu, M. L., and Sarma, P. N. (2011). Potential of mixed microalgae to harness biodiesel from ecological water-bodies with simultaneous treatment. Bioresour. Technol. 102, 1109–1117. doi:10.1016/j.biortech.2010.08.103
Venkata, M. S., and Devi, M. P. (2014). Salinity stress-induced lipid synthesis to harness biodiesel during dual-mode cultivation of mixotrophic microalgae. Bioresour. Technol. 165, 288–294. doi:10.1016/j.biortech.2014.02.103
Venkata Subhash, G., Rajvanshi, M., Kumar, B. N., Govindachary, S., Prasad, V., and Dasgupta, S. (2017). Carbon streaming in microalgae: Extraction and analysis methods for high value compounds. Bioresour. Technol. 244, 1304–1316. doi:10.1016/j.biortech.2017.07.024
Venkata Subhash, G., Rajvanshi, M., Kumar, G. R. K., Sagaram, U. S., Prasad, V., Govindachary, S., et al. (2022). Challenges in microalgal biofuel production: A perspective on techno economic feasibility under biorefinery stratagem. Bioresour. Technol. 343, 126155. doi:10.1016/j.biortech.2021.126155
Wältermann, M., Hinz, A., Robenek, H., Troyer, D., Reichelt, R., Malkus, U., et al. (2005). Mechanism of lipid-body formation in prokaryotes: How bacteria fatten up. Mol. Microbiol. 55, 750–763. doi:10.1111/j.1365-2958.2004.04441.x
Wang, J., and Curtis, W. R. (2016). Proton stoichiometric imbalance during algae photosynthetic growth on various nitrogen sources: Toward metabolic pH control. J. Appl. Phycol. 28, 43–52. doi:10.1007/s10811-015-0551-3
Xia, L., Rong, J., Yang, H., He, Q., Zhang, D., and Hu, C. (2014). NaCl as an effective inducer for lipid accumulation in freshwater microalgae Desmodesmus abundans. Bioresour. Technol. 161, 402–409. doi:10.1016/j.biortech.2014.03.063
Yu, H., Kim, J., Rhee, C., Shin, J., Shin, S. G., and Lee, C. (2022). Effects of different pH control strategies on microalgae cultivation and nutrient removal from anaerobic digestion effluent. Microorganisms 10, 357. doi:10.3390/microorganisms10020357
Keywords: biodiesel, carbohydrates, mixed microalgae, PH stress, water treatment
Citation: Alkhamis YA, Mathew RT, Nagarajan G, Rahman SM and Rahman MM (2022) pH induced stress enhances lipid accumulation in microalgae grown under mixotrophic and autotrophic condition. Front. Energy Res. 10:1033068. doi: 10.3389/fenrg.2022.1033068
Received: 31 August 2022; Accepted: 04 October 2022;
Published: 14 October 2022.
Edited by:
G. Venkata Subhash, Reliance Industries, IndiaCopyright © 2022 Alkhamis, Mathew, Nagarajan, Rahman and Rahman. This is an open-access article distributed under the terms of the Creative Commons Attribution License (CC BY). The use, distribution or reproduction in other forums is permitted, provided the original author(s) and the copyright owner(s) are credited and that the original publication in this journal is cited, in accordance with accepted academic practice. No use, distribution or reproduction is permitted which does not comply with these terms.
*Correspondence: Roshmon Thomas Mathew, cm1hdGhld0BrZnUuZWR1LnNh
 Yousef Ahmed Alkhamis
 Roshmon Thomas Mathew
 Ganesan Nagarajan
 Sheikh Mustafizur Rahman6