 Hao Zhang
 Hui Liu
 Guoqing Ma
 Chao Gu
- State Grid Shandong Electric Power Research Institute, Jinan, China
To reduce the impact of wildfires on the operation of power systems, a back-propagation neural network (BPNN) model is used to evaluate the wildfire risk distribution after feature selection. Data from 14 types of wildfire-related features, including anthropogenic, geographical, and meteorological factors, were collected from public data websites and local departments. The weight ranking was calculated using filtering and wrapper methods to form five feature subsets. These are used as the input sets of the BPNN model training, and network parameters are optimized by genetic algorithm (GA). Finally, the optimal feature subset is chosen to establish the optimal BPNN model. With the optimal model, the prediction results are graded to draw a wildfire risk distribution map. Situated in medium-, high-, and very-high-risk zones are 90.26% of new fire incidents, indicating the applicability of the proposed BPNN model.
Introduction
Electric power transmission lines often cross wildlands with complex terrain and high vegetation coverage. However, due to natural and human activities, such regions are prone to wildfires (Guo et al., 2018; Shi et al., 2018). As soon as these spread to transmission corridors, high temperatures, ash, and flame greatly deteriorate the insulating strength of air below and between transmission lines to induce tripping failures in the power system. Unlike the short duration of lightning strikes, the sustained combustion duration of wildfires makes it difficult to recover the insulation of transmission lines and prevents automatic reclosing devices from working successfully (Fonseca et al., 2002; Wu et al., 2012). Therefore, evaluating the occurrence probability of wildfires will help relevant power departments implement differentiated insulation design and maintenance measures for transmission lines.
Several methods have been proposed for evaluating or predicting the risk of wildfires (Jazebi et al., 2020). The first method is using numerical weather prediction and fire hazard mapping system for pre-disaster planning. The second is using some potential wildfire factors to derive regression models to predict the probability of wildfires over a wide range. Another is using complex machine-learning (ML) algorithms to train historical wildfire data. Based on extreme learning machines, Hu (2011) analyzed historical meteorological data and derived the probability of wildfires by combining temperature, humidity, and wind speed. In addition to conventional meteorological data such as precipitation, Jia (2018) suggested that the rainfall not only affects the current probability of wildfires but also for periods after rainfall. In his model, the precipitation interval is considered to calculate combustion indicators. While these studies emphasize the importance of climatic factors on wildfire occurrence, they do not consider anthropogenic and topographic factors, or seasonal changes in vegetation. Zhang et al. (2013) thus include topographic factors in a binary logistic regression model to calculate the risk of wildfire occurrence. Chen, Zhou, et al. (2021) take three types of wildfire-related factor—human, topographic, and meteorological—into a naive Bayes model. However, as there is a strong nonlinear relationship between wildfire incidents and the wildfire-related features, linear models cannot resolve the wildfire problem accurately. Back-propagation neural networks (BPNNs), which nonlinearly fulfill the intended targets through network training and weight threshold updates, have been widely used in investment risk assessment (Jiang et al., 2019), commercial economic index prediction (B. Chen et al., 2020), and indoor temperature prediction (Qi et al., 2015). They are also suitable for solving the multi-factor coupling problem of wildfire risk assessment.
In this paper, the optimal subset of features for wildfire occurrence assessment is selected by compositing a variety of feature selection algorithms, and a BPNN model is established with the optimal feature subset. The initial model parameters are optimized by using genetic algorithms (GA). The established model is then applied to assess the wildfire risk of the area under study for verification.
Data collection and pre-processing of wildfire-related features
Data collection
The study area is in the south of China. It was divided into grids of 1 km*1 km for study. Previous research has indicated that wildfire occurrence not only correlates to local meteorological conditions but also is affected by physiography, land cover, or socioeconomic features (Costafreda-Aumedes et al., 2018). Our study collected and aggregated data from 14 wildfire-related features over three categories (physiographical, meteorological, and anthropological). The occurrence probability of wildfire was used to represent the wildfire risk. All the data from the aggregated features were sourced from public data websites or provided by local power grids (Table 1.
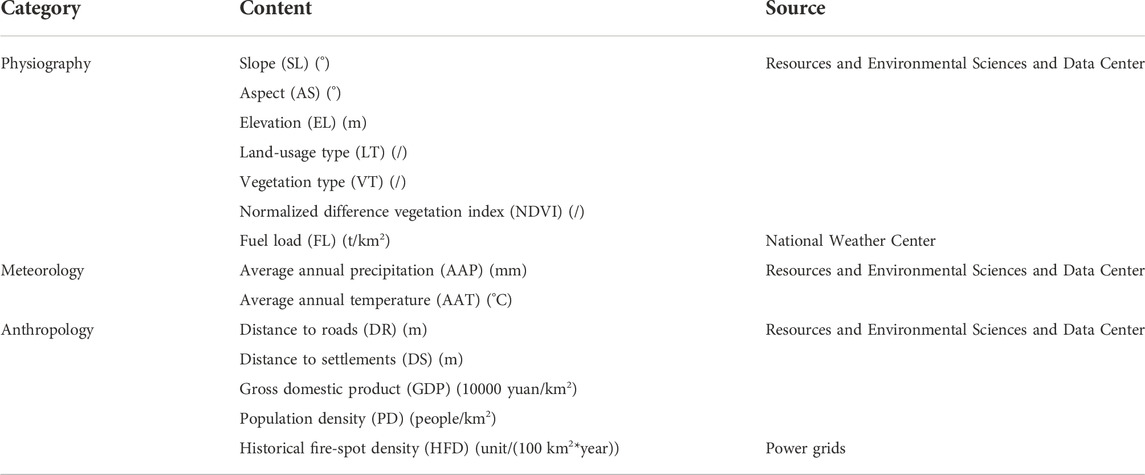
TABLE 1. Wildfire-related features and category.
There are several reasons for choosing these wildfire-related features. First, the occurrence of wildfire events requires comburent factors, which can be represented by land-usage type (LT), vegetation type (VT), normalized difference vegetation index (NDVI), and fuel load (FL). In addition, the physiographic features of slope and aspect affect the likelihood of wildfires burning and spreading. Furthermore, average annual precipitation (AAP) and average annual temperature (AAT) not only affect the lush growth of vegetation but also the moisture content of vegetation and, thus, its flammability. According to a survey, more than 90% of wildfire events are caused by intentional and unintentional human activities, power line failures, or machinery (FAO), 2007). We thus calculated distance to roads (DR), distance to settlements (DS), gross domestic product (GDP), and population density (PD) to represent the intensity of human activity. In addition to elevation (EL), which affects both human activity and vegetation, historical fire-spot density (HFD) was selected to comprehensively reflect the risk of wildfires in the grid. HFD is obtained by calculating the fire-spots occurring over 2010–2015 and then interpolating into each grid.
The data for roads, settlements, and PD were downloaded from the Resource and Environment Science and Data Center website, and data for FL distribution were provided by the National Meteorological Center. All dataset resolutions are 1 km*1 km. To maintain the data’s accuracy, the study area was divided into a 1 km*1 km grid. The HFD of power grids is obtained by using Kriging interpolation from a resolution of 2.5 km*2.5 km to 1 km*1 km.
Data pre-processing
Data of the aforementioned wildfire-related features were divided into real type (GDP, EL, FL, AAP, AAT, SL, AS, PD, FD, NDVI, DS, and DR) and enumerated type (VT and LT). Outlier detection and blank value filling were first performed on the data of all grids. After identifying the abnormal value of the feature through the univariate scatter plot, Lagrangian interpolation was used to replace the abnormal data and blanks with the feature value of the surrounding grids. For the real type features, standardized processing was used to reduce the influence of different feature value ranges on the model.
where σ and μ represent the variance and the average of the data population, respectively.
The data of VT and LT were graded by flammability (Tables 2 and 3. A higher grade means higher ease of causing a wildfire.
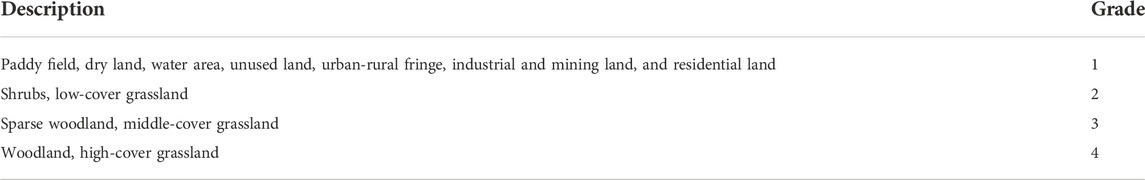
TABLE 2. VT grades.
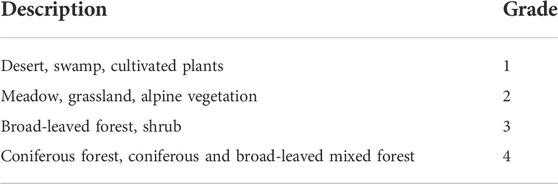
TABLE 3. LT grades.
Methodology
Feature selection algorithm
Redundant features would complicate the model and even weaken its generalizability (Che et al., 2017). In this study, three kinds of filtering algorithm and a wrapper algorithm are utilized to evaluate the importance of wildfire-related features for selecting the most suitable subset.
The evaluation criteria of the filters are specified by the dataset itself without model training. Generally, filter algorithms use the distance or the saliency score between different features to study the importance of features. Therefore, these algorithms can capture the commonality of the feature set as the evaluation criteria and are independent of the model algorithm (Ding et al., 2021). The wrapper would provide an optimal-feature subset with the highest classification accuracy for the model. The criteria are obtained from the evaluation of the training model. Multiple feature subsets are scored according to the accuracy of the trained models with the test set. However, this method uses much storage and is more time-consuming than repeated modelling.
Relief
The relief algorithm was first proposed in 1992 (Kira, 1992). Its basic idea is to assign different weights to features according to the correlation between each feature and the sample category. First, a sample R is randomly selected from the training set. Its nearest neighbor sample H in the same class and the nearest neighbor sample M in the different class are then searched separately. Thence, the distance between R, H, and M is calculated.
For the features with real type,
For the features with enumerated type,
The relief score of features
where m is the number of samplings.
Mutual information (MI)
MI is a measure of the interdependence between features (Huang et al., 2007), which can be calculated by Equation (5). Generally, a higher MI value indicates more interdependence between features.
where p(x) and p(y) are the marginal distributions of variables x and y, respectively. P(x, y) is the joint distribution of (x, y).
Pearson correlation coefficient (PCC)
The linear correlation between features can be expressed by their PCC (P. Chen, Li, et al., 2021).
where
For MI and PCC, these two algorithms can calculate the degree of correlation between features. The label of the wildfire occurrence becomes a feature when using MI and PCC. 1 means fire in the grid and 0 means none. By calculating the interdependence of 14 wildfire features with the label feature, the calculation of the wildfire-related weight was achieved.
Unlike the filter algorithm, wrapper algorithms calculate the weights of features through model training and testing. By assessing the trained models’ performance, the feature subsets are scored. However, due to the repeated training process, wrapper algorithms are generally time-consuming.
Random forest (RF)
RF is an ensemble learning algorithm based on decision tree, which can obtain the score during the training (Breiman, 2001).
1) About two-thirds of the total samples are randomly sampled to form a training set, whereas the rest of the samples are an out-of-the-bag set. After a decision tree model is established by using the training set, the out-of-the-bag error errOB1 is calculated for the decision tree.
2) Random noise is then added to sample features in out-of-the-bag data to calculate the relevant out-of-the-bag error errOB2.
3) Finally, the features importance V is calculated by the difference between errOB1 and errOB2.
where M is the number of decision trees. Adding noise to reduce the accuracy of out-of-the-bag data means that this feature has a great impact on the sample prediction results.
Error back-propagation neural network
The wildfire risk is evaluated by the BPNN algorithm, which is a multi-layer feedforward network trained and judged by error back-propagation (BP). In most cases, there are significant errors between the output signal and the expected output. The BP algorithm consists of two parts. One is signal-forward propagation and the other is error-back propagation. The input sample is first introduced from the input layer to the output layer. If the output differs from the expected output, the error is then back-propagated to calculate the loss function. By correcting the weights, the error is allocated to each unit until the output results are consistent with actual results (Z. Hu, 2016). The steps for establishing a BPNN model are as follows:
1) Determine the structure. The BPNN consists of an input, a hidden, and an output layer. The number of nodes in the input layer is equal to the number of wildfire-related features. By considering the characteristics of the sample set, the number of hidden layer nodes is set as 15. The number of the output layer is 1, to show the results. For the training set, the value of output is 1, indicating the occurrence of wildfire, whereas 0 represents the non-occurrence of wildfire.
2) Calculate output of the hidden layer. After the input signal is transmitted to the hidden layer, the output value H of the hidden layer is calculated by Eq. 8.
where xi represents the input of ith of the model, wij represents the connection weight between input layer node i and hidden layer node j, f is the hidden layer activation function, aj represents the threshold of hidden layer node j, and l represents the number of hidden layer nodes.
3) Calculate output of the output layer by Eq. 9.
where Hj represents the output of jth hidden layer node, wj represents the connection weight between the hidden layer nodes j and the output layer node, and b represents the threshold of output layer node j.
4) Calculate error of output. The error means the difference between the predictive result O and the actual output Y (Eq. 10).
5) Update the weight parameters and threshold parameters of each layer based on the BP algorithm.
6) Recalculate the error after updating the weights and thresholds. If the error satisfies the requirements, the updating will stop; if not, return to Step 2.
Genetic algorithm
The BPNN has a strong learning and generalization ability. However, it has problems, such as many parameters being optimized and a slow convergence speed. Learning according to the gradient descent method can easily fall into the local minimum value. GA has a good global search ability: it can quickly search for all solutions without falling into the trap of the rapid descent of local optimal solutions. It is also easy to combine with other algorithms and is scalable. If the optimal initial value of weights and thresholds is found at the beginning of neural network training, the training time would be greatly reduced. The probability of falling into the local optimum phenomenon would also be reduced (Z. Hu, 2016). The GA is realized as follows:
1) GA coding establishment and parameter setting. The optimal individual is represented by a real code in which the strings represent the connection weights and thresholds in the BPNN model. As there are 15(n+1) of connection weights numbers and 16 of threshold numbers, the length of the real code in the GA algorithm is thus 15n +31. The GA parameters of the model set the maximum genetic generation to 10, the population size to 20, the crossover probability as 0.2, and the mutation probability as 0.1
2) Fitness function calculation. The fitness value represents the individual’s ability to adapt to the environment. It is the absolute value of the difference between the actual and expected outputs.
where k is the coefficient of the fitness function, Y is the actual output of BPNN, and O is the predictive output.
3) Selection. The roulette method is used for selection; the selection probability is,
where pi is the selection probability of individual i, Fi is the fitness function value of individual I, and N is the number of individuals in the population.
4) Crossover. In this process, the structures of two parent individuals recombine into a new individual by the real number crossover method (Eqs 18 and 19).
where amj and anj represent the jth gene of chromosome m and n, respectively, and b is a random number between [0,1].
5) Mutation refers to the random modification of a gene value of an individual in the population. With mutation, GA can maintain the diversity of the population and has local random search ability.
where aij represents the jth position of the gene on chromosome I, amax and amin represent the upper and lower bounds of gene aij, respectively, c is a random number, g is the iteration number, Gmax is the maximum evolution number, and r is a random number between 0 and 1.
Results and discussion
Feature subset selection
To comprehensively evaluate the importance of wildfire-related features, the results of the four feature selection methods and their average value are shown in Figure 1. It can be seen that, for the same type of wildfire-related feature, each feature selection method has different evaluation results. Nevertheless, regardless of either method, HFD has the highest evaluation result. This is because wildfire occurrence has certain inertia, and HFD can comprehensively reflect the local living habits and ground environment. For the average results of four methods, the five most important wildfire-related features are HFD, VT, AAT, AAP, and EL.
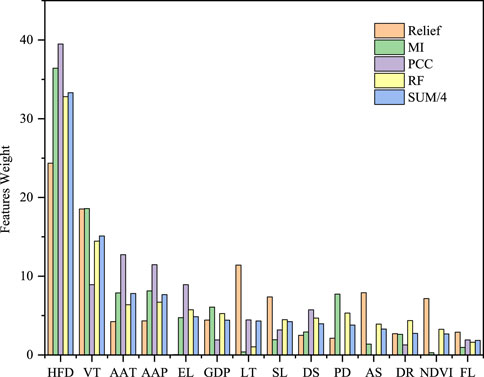
FIGURE 1. Weight results of feature selections.
Based on the results evaluated, five feature subsets are formed, as shown in Table 4. The HFD, VT, and AAT are the three most important features for fire and no-fire sample classification. These features represent the anthropogenic, geographical, and meteorological factors, respectively. The HFD reflects the number of historical wildfires that occurred near the study site. The more fires that occur near this point in history, the higher the probability of future wildfires. Second, the VT can lead the ignition and spread of wildfires. The AAT intuitively shows the level of local temperature. The higher the temperature, the more luxuriant the vegetation growth, and the greater the likelihood of wildfires.
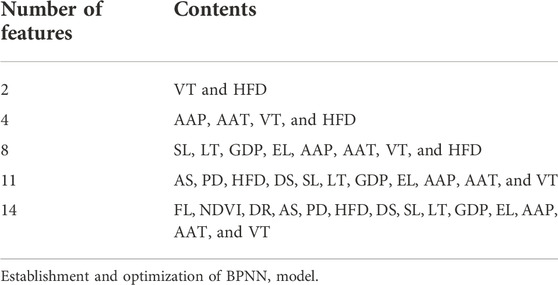
TABLE 4. Feature subsets.
There is a serious imbalance problem in the initial sample set: the number of fire samples is only 27153, which is much less than non-fire samples. Therefore, 27153 samples were extracted from the non-fire sample set by under-sampling to form a new sample set. The sample set was then divided into a training set with 50000 samples and a test set with 4306 samples. After that, the BPNN models were established with different feature subsets and the parameters were optimized by GA during the training process.
Confusion matrix as a visualization tool in machine learning is mainly used to compare classification results and actual values. It reflects the performance of a model and helps with subsequent adjustments. The confusion matrix structure is shown in Table 5; evaluation indicators can be calculated by Equations (21) to (23).
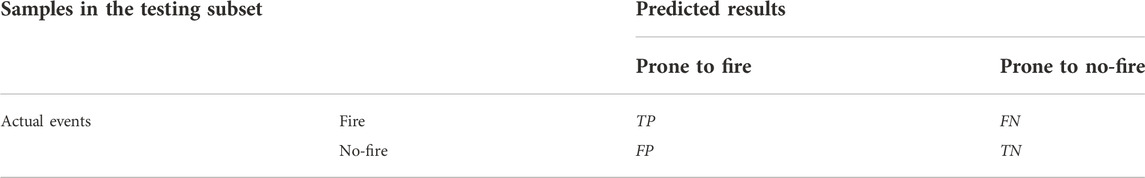
TABLE 5. Confusion matrix.
Accuracy: The proportion of correctly classified results in the total samples.
Precision: The proportion of correctly classified results in predicted positive samples.
Recall: The proportion of correctly classified results in actual positive samples.
F-score: The combination the outputs of precision and recall.
The accuracy of the model indicates the overall performance of evaluation in either wildfire occurrence or non-wildfire occurrence. Precision depends on the proportion of samples that are rated as high wildfire risk that actually have wildfire occurrence, whereas recall concerns how many wildfire samples are predicted to be in the right category. Generally, improving precision would reduce recall. Thus, the F-score is proposed to balance the importance between precision and recall. The results of accuracy, precision, recall, and F-score for BPNN models with different feature subsets are shown in Figure 2.
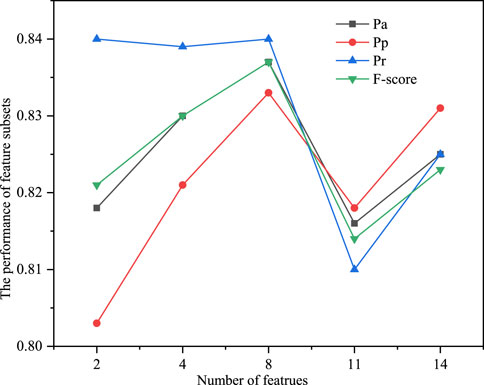
FIGURE 2. Performance of feature subsets.
When there are two wildfire-related features, the recall is as high as 84.02%, whereas the accuracy, precision, and F-score are slightly smaller. Considering that the impact of wildfires on the power grid may lead to large-scale power outages, the power operation and maintenance department should invest as much as possible into finding high-risk areas of wildfires. Therefore, when Q/GDW 11643-2016 formulated the guidelines for the distribution of wildfires, these two features (VT and HFD) were used to evaluate the risk of wildfire (Q/GDW11643-2016, 2016).
As the number of adopted features increases, the recall remains basically the same, but other indexes increase significantly. When the eight features of SL, LT, GDP, EL, AAP, AAT, VT, and HFD are used, all the evaluation indexes are optimal. Therefore, using these eight characteristics of wildfire to evaluate their risk not only takes into account the accuracy of the evaluation but also reduces the input operation and maintenance costs as much as possible.
Application of the wildfire risk assessment model
By using the optimal BPNN model, the wildfire risks of all grids in the target area are calculated through regression analysis. The wildfire risk outputs for all grids are shown in Figure 3. The average of the prediction value is 0.53. To clearly show the risk of wildfire, the predicted output is proportionally divided into five grades by the ratio 1:2:4:2:1, based on GB/T36743-2018 (Liu et al., 2016; Zhou et al., 2020).
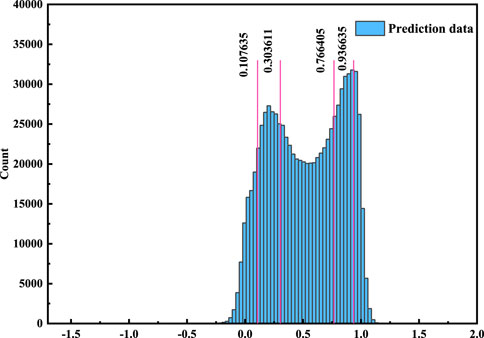
FIGURE 3. Grades of prediction outputs.
By assigning different colors to the grades, a wildfire risk distribution map is drawn using ArcGIS software, based on the latitude and longitude coordinates of grids, as shown in Figure 4.
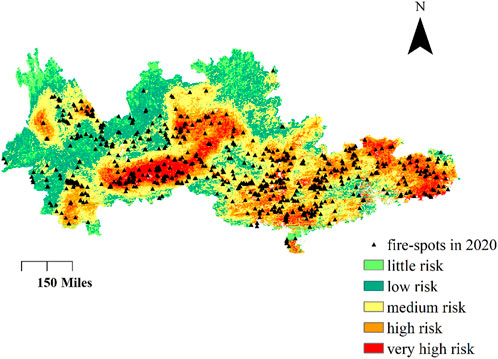
FIGURE 4. GA-BPNN-based wildfire risk distribution.
It is evident that the risk level of wildfire is relatively low in the northwest of the study area. Because this region is located in the Yunnan–Guizhou Plateau and Hengduan Mountains, this has the highest elevation of all regions. Its complex terrain and sparse population mean a low probability of wildfire occurrence there. Although the elevation of the Yangtze River and Pearl River Delta region is low, the wildfire risk in this region is still low due to its developed economy and high density of urban settlements and population.
Areas with high wildfire risk levels are located in the middle of study area, at the tri-junction of three provinces. The north-east of the study area also has a high wildfire risk because the vegetation in these areas is lush, resulting in a large fuel storage. In addition, the population density in this region is larger than that of the Yunnan–Guizhou Plateau but is smaller than in the Yangtze River and Pearl River Delta. Moderate population density can not only provide sufficient fire sources but also makes it difficult for fires to spread and develop, due to frequent human activity.
To verify the effectiveness of the wildfire risk distribution map, the wildfire spots in 2020 are superimposed on the map, as shown in Figure 4. The statistical results are listed in Table 6. About 52.37% of wildfire spots are distributed in the high-risk and very-high-risk areas. It is noted that these two risk areas account for only 30% of the total study area. If the medium risk area is also considered, the accuracy increases to 90.26%, which indicates the excellent performance of the proposed BPNN model for wildfire risk assessment.
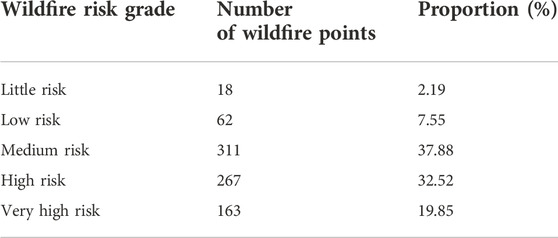
TABLE 6. Wildfire risk distribution of fire-spots in 2020.
In order to further study the adaptability of the proposed method, a BPNN model was re-established for only one province—a small area located in the west of the whole targeted region. In this small region, only 9773 fire spots were monitored during 2010–2019. The BPNN model’s performance for this small region is similar as for the larger region, with accuracy of 81.6%, precision of 79.8%, re-call of 84.9%, and an F-score of 82.3%; the wildfire risk distribution is mapped as Figure 5. More than 66.3% of 2020’s fire-spots are distributed in medium- and higher-risk regions, which shows that the proposed GA-BPNN method can also be used to assess the wildfire risk in small-scale areas.
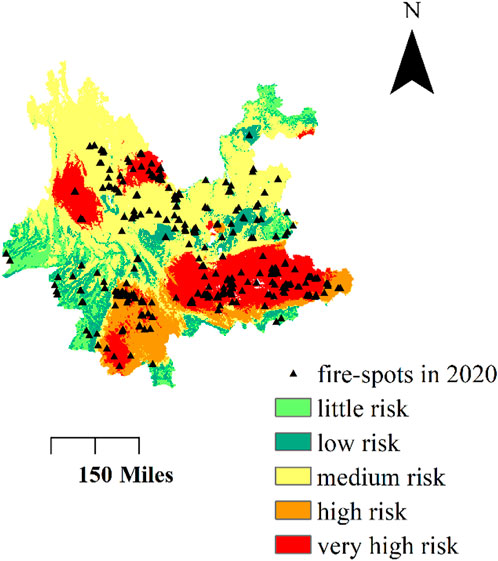
FIGURE 5. GA-BPNN-based wildfire risk distribution of one province.
Conclusion
This study proposed a GA based-BPNN model to assess the risk distribution of wildfire occurrence for the power grid. To optimize the model, four different types of feature selection algorithms were used to rank important wildfire-related features. The features of VT and HFD were most important in evaluating wildfire occurrence risk. Adding more wildfire-related features would improve the performance of the BPNN model. In particular, the optimal BPNN model was obtained by using eight wildfire-related features: SL, HFD, LT, GDP, EL, AAP, AAT, and VT. The optimal BPNN model has an accuracy of 83.7%, precision of 83.3%, recall of 84.0%, and F-score of 83.7%. The proposed model was used to draw a wildfire risk map. Of the wildfire events in 2020, 90.27% were distributed in medium-, high-, and very-high-risk zones. This map can be utilized for differentiated wildfire prevention for departments related to the power grid (Panagiotis, 2016).
Data availability statement
The raw data supporting the conclusion of this article will be made available by the authors, without undue reservation.
Author contributions
HZ contributed to the conception of the study; HL and GM performed the experiment; HZ and YZ contributed significantly to analysis and manuscript preparation; JY and CG performed the data analyses and wrote the manuscript; HZ and JY helped perform the analysis with constructive discussions.
Funding
The research was funded by the Science and Technology Projects funded by State Grid Shandong Electric Power Company for supporting this research under Contract No. 5206002000TM.
Conflict of interest
The authors declare that this research is supported by State Grid Shandong Electric Power Company. The funder had the following involvement in the study: data collection and data analysis.
Publisher’s note
All claims expressed in this article are solely those of the authors and do not necessarily represent those of their affiliated organizations, or those of the publisher, the editors, and the reviewers. Any product that may be evaluated in this article, or claim that may be made by its manufacturer, is not guaranteed or endorsed by the publisher.
References
Che, J., Yang, Y., Li, L., Bai, X., Zhang, S., and Deng, C. (2017). Maximum relevance minimum common redundancy feature selection for nonlinear data. Inf. Sci. (N. Y). 409, 68–86. doi:10.1016/j.ins.2017.05.013
Chen, B., Xing, L., Zhao, L., Xie, Y., and Chen, X. (2020). "Prediction model of commercial economic index based on BPNN optimization algorithm." 2020 International Conference on Computer Engineering and Application (ICCEA), Budapest, Hungary, 19–20.
Chen, P., Li, F., and Wu, C. (2021). Research on intrusion detection method based on Pearson correlation coefficient feature selection algorithm. J. Phys. Conf. Ser. 1757 (1), 012054. doi:10.1088/1742-6596/1757/1/012054
Chen, X, W., Zhou, Y., Zhou, E., Xiang, Z., and Lu, J. (2021). Wildfire risk assessment of transmission-line corridors based on naïve Bayes network and remote sensing data. Sensors 21 (2), 634. doi:10.3390/s21020634
Costafreda-Aumedes, S., Comas, C., and Vega-Garcia, C. (2018). Human-caused fire occurrence modelling in perspective: A review. Int. J. Wildland Fire 26, 983. doi:10.1071/WF17026
Ding, S., Wang, F., and Wei, W. (2021). Relief feature selection algorithm based on label correlation. Comput. Sci. 48 (4), 91–96. doi:10.11896/jsjkx.200800025
Fao, Food and Agriculture Organization, (2007). Fire management: Global assessment 2006. FAO For. Pap. 151, 135. doi:10.1016/j.biocon.2009.03.028
Fonseca, J. R., Tan, A. L., Silva, R. P., Monassi, V., Melo., M, Junqueira, W., et al. (2002). Effects of agricultural fires on the performance of overhead transmission lines. IEEE Trans. Power Deliv. 5 (2), 687–694. doi:10.1109/61.53071
Guo, Y., Chen, R., Shi, J., Jie, W., Yi, H., and Zhong, J. (2018). Determination of the power transmission line ageing failure probability due to the impact of forest fire. IET Gener. Transm. &. Distrib. 12, 3812–3819. doi:10.1049/iet-gtd.2018.0039
Hu, X. (2011). Research of wildfire prevention measures and power grid operation optimization. Master of Engineering (China Changsha: Changsha University of Science and Technology).
Hu, Z. (2016). "Research on application of BP neural network based on genetic algorithm in multi-objective optimization." 2016 8th International Conference on Information Technology in Medicine and Education (ITME), Fuzhou, China, 23–25 .
Huang, J., Cai, Y., and Xu, X. (2007). A hybrid genetic algorithm for feature selection wrapper based on mutual information. Pattern Recognit. Lett. 28 (13), 1825–1844. doi:10.1016/j.patrec.2007.05.011
Jazebi, S., de León, F., and Nelson, A. (2020). Review of wildfire management techniques—Part I: Causes, prevention, detection, suppression, and data analytics. IEEE Trans. Power Deliv. 35 (1), 430–439. doi:10.1109/TPWRD.2019.2930055
Jia, G. (2018). Research on risk assessment model and countermeasure of mountain fire disaster. Master of Engineering (China (Beijing): North China Electric Power University).
Jiang, Q., Huang, R., Huang, Y., Chen, S., He, Y., Lan, L., et al. (2019). Application of BP neural network based on genetic algorithm optimization in evaluation of power grid investment risk. IEEE Access 7, 154827–154835. doi:10.1109/ACCESS.2019.2944609
Kira, K. (1992). "The feature selection problem: Traditional methods and a new algorithm." The Tenth National Conference on Artificial Intelligence, San Jose, California, 12–16 .
Liu, M., Shao, Z., Shangguan, T., Tong, J., and Wang, X. (2016). Study on models and methods of risk assessment of transmission line fault caused by fire. Power Syst. Prot. Control 18 (6), 1941. doi:10.7667/PSPC150844
Panagiotis, T. T. (2016). Guidelines for drawing wildfire distribution on overhead transmission lines. Beijing, China: State Grid Corporation.
Qi, C., Wenbiao, W., and Siyuan, W. "Application of indoor temperature prediction based on SVM and BPNN." The 27th Chinese Control and Decision Conference (2015 CCDC), Qingdao, China, 23–25.2015.
Shi, S., Yao, C., Wang, S., and Han, W. (2018). A model design for risk assessment of line tripping caused by wildfires. Sensors 18 (6), 1941. doi:10.3390/s18061941
Wu, T., Ruan, J. J., Zhang, Y., Chen, C., and Wang, G. L. (2012). Study on the statistic characteristics and identification of AC transmission line trips induced by forest fires. Dianli Xit. Baohu yu Kongzhi/Power Syst. Prot. Control 40 (10), 138–143+148. doi:10.1161/01.CIR.0000145117.40114.C7
Zhang, H., Han, X., and Dai, S. (2013). Fire occurrence probability mapping of northeast China with binary logistic regression model. IEEE J. Sel. Top. Appl. Earth Obs. Remote Sens. 6 (1), 121–127. doi:10.1109/JSTARS.2012.2236680
Keywords: wildfire occurrence risk, artificial intelligence, feature selection, BP neural network, genetic algorithm
Citation: Zhang H, Liu H, Ma G, Zhang Y, Yao J and Gu C (2023) A wildfire occurrence risk model based on a back-propagation neural network-optimized genetic algorithm. Front. Energy Res. 10:1031762. doi: 10.3389/fenrg.2022.1031762
Received: 30 August 2022; Accepted: 31 October 2022;
Published: 13 January 2023.
Edited by:
Dongqi Liu, Changsha University of Science and Technology, ChinaReviewed by:
Yuesheng Zheng, Fuzhou University, ChinaChunjia Gao, North China Electric Power University, China
Copyright © 2023 Zhang, Liu, Ma, Zhang, Yao and Gu. This is an open-access article distributed under the terms of the Creative Commons Attribution License (CC BY). The use, distribution or reproduction in other forums is permitted, provided the original author(s) and the copyright owner(s) are credited and that the original publication in this journal is cited, in accordance with accepted academic practice. No use, distribution or reproduction is permitted which does not comply with these terms.
*Correspondence: Hao Zhang, c2RxenpoQDE2My5jb20=