 Duo Xu
 Liqiong Chen1†
94% of researchers rate our articles as excellent or good
Learn more about the work of our research integrity team to safeguard the quality of each article we publish.
Find out more
ORIGINAL RESEARCH article
Front. Energy Res. , 11 January 2023
Sec. Advanced Clean Fuel Technologies
Volume 10 - 2022 | https://doi.org/10.3389/fenrg.2022.1031006
This article is part of the Research Topic The Challenge and Opportunity of CCUS in the Development of Unconventional Resource View all 15 articles
The pipelines in mountainous areas have complex terrain conditions and pass through many densely populated areas. Once a pipeline leakage accident occurs, it will cause serious damage to the surrounding people and the environment. In this article, a leakage diffusion model of a bare natural gas pipeline is established for the exposed leakage scenario, and a simulation scheme is established according to the characteristics of pipeline-laying processes and environmental characteristics in mountainous areas. Research has been carried out on the diffusion pattern and the influence range of exposed gas transmission pipeline leaks under four types of factors: different leak apertures, ambient wind speed, mountainous obstacle conditions, and mountainous laying environment. The dangerous range formed by the gas diffusing along the ground and high altitude under different scenarios and the influence law of different influencing factors on the dangerous range are obtained, and suggestions for emergency rescue focus areas and emergency response strategies have been given. The research conclusions can provide a theoretical basis for emergency response strategies for exposed leakage accidents of high-pressure natural gas pipelines in mountainous environments and are of great significance to the quantitative analysis of the risk consequences of natural gas pipelines.
In recent years, the global demand for natural gas has continued to grow (Rui et al., 2017; Bu et al., 2021). Compared with other energy sources, natural gas can effectively reduce CO2 emissions (Aguilera, 2014). The mileage and number of natural gas pipelines, the most important modes of natural gas transmission, are also soaring in China, which leads to more transmission pipelines passing through areas where populations gather and buildings are concentrated. Due to the flammable and explosive nature of its transmission medium, the leakage failure of pipelines that carry natural gas often leads to environmental pollution, fire, and explosion accidents, which will cause great harm to the natural environment, social life, and public safety (Hoeks, 1975; Smith et al., 2005; Sklavounos and Rigas, 2006; Phillips et al., 2013; Jackson et al., 2014; Fan et al., 2018; Xiao et al., 2020; Zhang et al., 2020; Zhang et al., 2021; Zhu et al., 2021).
Gas pipeline leaks can be classified into two basic types based on the leak scenario: buried pipeline leaks and exposed pipeline leaks. Exposed gas pipeline leaks are usually caused by third-party damage and natural disasters, often leaking directly into the air over a large area, and according to the 2020 European Gas Pipeline Incident Data Group (EGIG) survey statistics, it was found that third-party damage caused up to 27% of pipeline incidents to occur within 2010–2019, which is the most significant pipeline failure factor (EGIG, 2020). Meanwhile, China has a complex geological landscape with many mountains and large drop-offs along some pipelines, and most of the pipelines are high-pressure natural gas pipelines. Since the mountainous terrain affects the gas leak diffusion pattern and makes it more difficult to predict the accident consequences and the environment in towering mountains and narrow valley bottoms is prone to the formation of confined spaces where gas leaks are more likely to occur in vapor cloud explosions, the complex topographic conditions dictate that the analysis of natural gas pipeline leak consequences should be different from that of plain areas and requires targeted research. Therefore, to avoid pipeline accidents resulting in casualties and property damage, the diffusion law of exposed gas pipeline leaks in mountainous environments should be clarified first to provide reliable theoretical support for emergency management after accidental gas pipeline leaks.
Since the 1970s and 1980s, theoretical and numerical simulations of gas diffusion processes have been studied, among which computational fluid dynamics and related techniques and methods have been more mature, based on which the current research has been conducted for the diffusion of bare gas leaks. Wilkening and Baraldi (2007) carried out a series of studies based on computational fluid dynamics for accidental leakage through small holes in high-pressure gas transmission pipelines and analyzed the effect of different properties of hydrogen and methane on the gas diffusion process and also the effect of different release scenarios, geometrical structures, and atmospheric conditions on the gas leakage pattern. Scargiali et al. (2011) conducted a numerical simulation study on the diffusion of heavy gas leaks and showed that the presence of buildings reduces the maximum concentration of heavy gas and increases the lateral diffusion of the gas. R.N. Meroney (2012) also studied the diffusion law of dense gas with finite volume based on computational fluid dynamics and analyzed the transient release diffusion of the gas on flat, sloping, and complex terrain surfaces under windless and windy conditions, respectively, providing data on the characteristics of transient plumes that are common in the field but difficult to accurately measure. B. Liu et al. (2016) carried out a study on the diffusion of carbon dioxide in complex environments, studied the CO2 diffusion patterns in two complex situations, namely, flat terrain with symmetrical hills and urban areas with buildings, and investigated their effects on the diffusion profiles by varying the source intensity, wind speed, and building height. L. Soulhac et al. (2016) used the SIRANERISK model for the array obstacle situation to study the diffusion of steady and unsteady leakage sources in diffusion behavior inside and above the obstacle. Y. Dai et al. (2018) similarly investigated the gas diffusion dispersion under an array obstacle and analyzed the effect of four computational parameters and two physical parameters on the simulation results, the findings of which led to a further improvement in the quality of CFD simulations. A. Liu et al. (2018) carried out a study on the leakage dispersion of urban natural gas pipelines, which simulated the natural gas leakage and dispersion under three different pipeline scenarios, and the study showed that the closed scenario had the largest blocking effect on the ambient wind, the strongest vortex effect, and the widest range of high gas concentrations.
It can be seen from the existing research results that the application of the CFD theory to analyze the gas dispersion law has been relatively mature, which when applied to a variety of practical conditions showed good simulation performance. At present, there is some research on gas leakage and the dispersion law in various complex situations, but the research focus is generally on medium- and low-pressure pipelines or other types of gases; thus, research on leakage and the dispersion law of exposed high-pressure natural gas pipelines in mountainous terrain is still unexplored. Therefore, in this article, we will refine the obstacle scenarios for the actual conditions of pipelines laid in mountainous areas and the characteristics of pipeline laying and study the diffusion law of pipeline leaks in mountainous areas.
Natural gas is compressible, and when a leak occurs, the gas pressure inside the pipe is much higher than the external ambient pressure. Under the effect of pressure difference, the internal gas exchanges momentum with the external world and forms a velocity gradient. The leakage state can be described by combining the continuity equation, momentum equation, energy equation, and gas state equation (Liu et al., 2016; Liu et al., 2018).
The theoretical basis of the continuity equation is the law of mass conservation, the physical significance of which is the difference between the mass of the fluid inflow and outflow per unit time, and the unit volume is equal to the value of its internal mass change. The equation is shown in equation (1), where
The momentum equation is based on Newton’s second law, and the equation is shown in equation (2), where
The energy equation is based on the law of conservation of energy, and the equation is shown in equation (3), where
For an ideal gas, the equation of the state of the gas is described as shown in equation (4), where
The flow state at the gas leakage port of the high-pressure gas transmission pipeline is turbulent flow, and the turbulence model should be selected for conducting the simulation. In this article, the standard
where
There are more mature theoretical models in gas diffusion, such as the Gaussian model, BM model, Sutton model, and box and similar model, each of which has different characteristics and adaptability (Slade, 1968; Ulden, 1974; Ermak et al., 1982; Pasquill and Smith, 1983; Britter and Mcquaid, 1988). Since the Gaussian model applies to light or neutral gases diffusing from a point source in a homogeneous atmospheric environment, the Gaussian model is chosen as the computational model for leakage dispersion in this article. The Gaussian model is divided into the Gaussian plume model and the Gaussian puff model. Among them, the Gaussian plume model applies to continuous leakage with a long leakage time and small leakage volume; the Gaussian puff model applies to transient leakage with a short leakage time and long diffusion time. The Gaussian model usually establishes the OXYZ coordinate system, where the leak point is the origin O, the downwind extension direction is along the x-axis, the y-axis is perpendicular to the x-z plane and intersects with the O point, and the z-axis is perpendicular to the x-y plane. Gaussian models are also based on the following assumptions:
the gas leakage diffusion area is free of obstacles, and the ground is flat;
mixed gas clouds have the same density as air and are not affected by buoyancy;
the distributions of concentration and density inside the cloud cluster and on the cross section of the plume follow the normal Gaussian distribution;
the moving speed of the cloud center or the axial spreading speed of the cloud plume is equal to the wind speed, and the wind speed is uniform and constant;
the temperature of the gas cloud remains unchanged during the diffusion process.
When small-hole leaks occur in natural gas pipelines, they tend to be small and have a long leak time and can be considered a continuous leak source. The Gaussian plume model is shown in equation (7), where
When a natural gas pipeline rupture or large bore leak occurs, the leak occurs rapidly and in a large volume, and the situation usually causes the activation of a pipeline shut-off valve to stop further gas leakage, which can be considered transient leak diffusion. The Gaussian puff model is shown in equation (8), where
This article mainly discusses the diffusion law and the diffusion range in the horizontal and vertical directions of the exposed gas pipeline after leakage to provide a basis for relevant control measures. Considering the large pipe diameter, high transmission pressure, and large impact range after gas leakage, it is difficult to solve the calculation and requires a high computer system if a three-dimensional model is used for analysis, and the two-dimensional model can also meet the research requirements. The simulation results are more intuitive, so a two-dimensional model is used to analyze the concentration distribution of the leaking gas. The model mainly includes the natural wind inlet, diffusion area, and the location of the leak, and the simplified model of the pipeline leakage is shown in Figure 1.
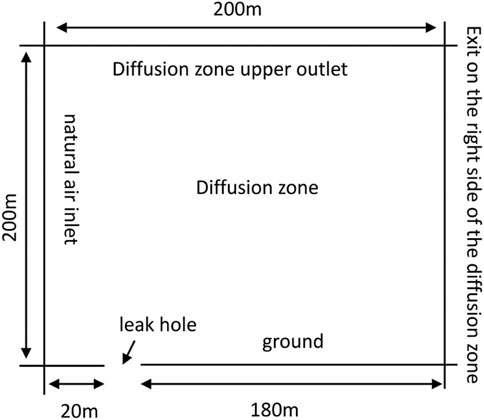
FIGURE 1. Schematic diagram of the leakage model of the exposed natural gas pipeline.
In this article, a diffusion space of 200 m × 200 m is established, and the meshing is combined with both structural and non-structural grid forms. Considering the high methane concentration near the leak hole and the strict requirements on the mesh quality, local refinement is carried out, and a sparse mesh is used for the boundary locations of the diffusion area far from the leak hole to reduce the computational workload while satisfying the simulation calculation requirements and accuracy requirements.
According to the aforementioned mesh division method, the mesh irrelevance verification is carried out for the default conditions as shown in Table 1, and the horizontal diffusion distance and vertical diffusion height after 60 s of leakage with different mesh numbers are shown in Figure 2. It can be seen that the simulation results tend to be stable when the number of grids exceeds 450,000. Therefore, based on the conclusion of the grid independence verification, the grid accuracy was tuned several times, and finally, a total of 445,784 grids were divided.
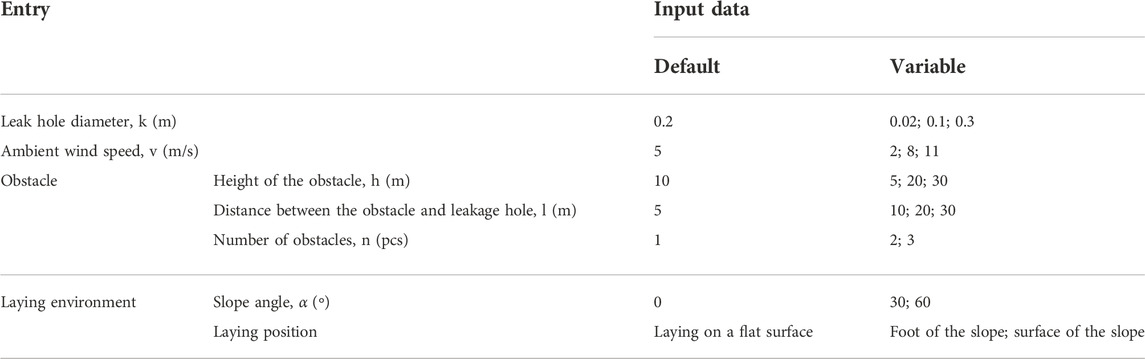
TABLE 1. Setting of simulation parameters.
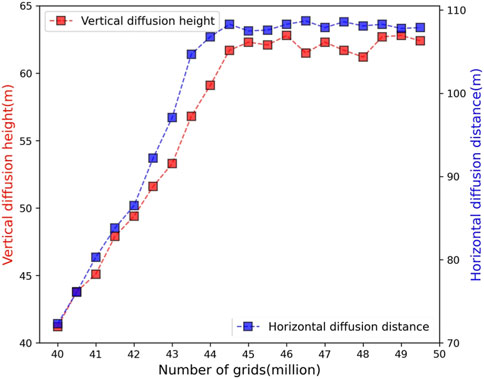
FIGURE 2. Grid independence verification.
Based on the analysis of the physical model of natural gas pipeline leakage and combined with the actual situation, the entrance boundaries set are mainly the velocity entrance of the natural wind on the left side and the velocity entrance of the gas from the leakage hole, and the exit boundaries set are mainly the pressure exit on the upper side and the right side, and the surface boundary is the ground on the lower side. At the same time, since the natural wind is not flowing at uniform velocity in all directions, but considering the operability of the simulation, the natural wind is considered to be flowing at uniform velocity.
The article verifies the accuracy of the leakage dispersion model by comparing it with the experiment of Liu et al. (2018), which used an aluminum–plastic composite pipe with a diameter of 15 mm, an inner diameter of 12 mm, and an opening of 7 mm, set at a pressure of 0.2 MPa, a distance of 1.33 m between the buildings around the pipe, and a distance of 0.23 m between the leak point and the building. Six monitoring points with methane concentration sensors were installed near the location of the leak hole, and the data of each monitoring point were collected at 120 s after the leak occurred. Comparing the numerical simulation data of monitoring point 2 (0, 0.93) and monitoring point 5 (0.23, 1.2) with the experimental data, the two have a high agreement with a maximum error of 8.3% and an average error of less than 6.5%, so the established model can be used for the study of leak dispersion in exposed natural gas pipelines. The comparison of numerical simulation and experimental results is shown in Figure 3.
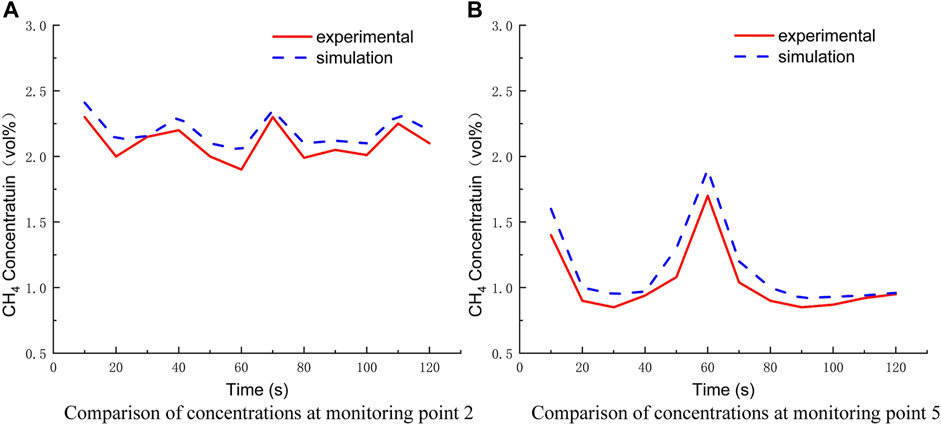
FIGURE 3. Comparison between numerical simulation and experimental results. (A) Comparison of concentrations at monitoring point 2. (B) Comparison of concentrations at monitoring point 5.
The factors affecting the diffusion of gas leaks from exposed gas transmission pipelines are derived from the analysis as both internal and external factors. The internal factors mainly include the operational parameters such as transmission pipe diameter, pressure, and leak hole diameter, while the external factors mainly refer to the external environmental factors in the diffusion zone, such as wind speed and obstacle conditions. Since there are woods and mountains of certain height along the natural gas pipeline in mountainous areas, the analysis of gas diffusion needs to focus on the gas diffusion under different obstacles.
Based on a field study of a section of a mountainous natural gas pipeline in China, a pipe diameter of 1,016 mm, a delivery pressure of 10 MPa, and a temperature of 300 K were considered. Since leaks in exposed natural gas pipelines occur mainly in small and medium bore leaks, the leak bore diameter is mainly taken as the default variable of 200 mm. Considering that the top of the pipeline is under the greatest threat of damage, the direction of leakage is set vertically upward. The specific simulation variable parameters are set as shown in Table 1.
To grasp the natural gas concentration at different typical locations, some simulation scenarios set up concentration monitoring points for analysis. As shown in Figure 4, the coordinates at the midpoint of the leak mouth are (20, 0), and four monitoring points, namely, point A (20, 5), point B (25, 1.5), point C (25, 5), and point D (20, 10), are set near the leak hole to observe the changes of gas diffusion concentration at different heights from the leak mouth and at different horizontal distances from the leak hole, where points A and D studied the concentration at different height changes, points A and C studied the concentration changes at different horizontal distances, and point B studied the concentration changes at the respiratory layer of the personnel.
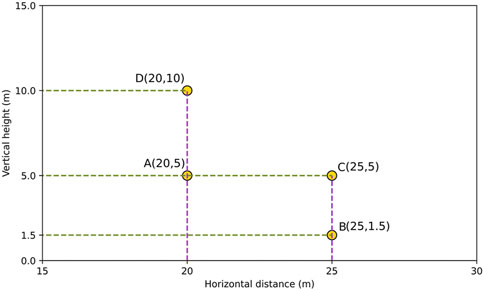
FIGURE 4. Location diagram of monitoring points.
Different methane concentrations cause different kinds of harm to the environment and people, and the article aims to study the diffusion law according to the methane concentration range corresponding to both fire explosion and poisoning. When the concentration ratio of methane in the air is within the range of 5%–15%, the mixture is in the explosive concentration range; when the concentration ratio reaches 25%–30%, the mixture starts to cause harm to the human body. Therefore, using 5%, 15%, and 25% as methane observation concentration boundaries, we record the changes in the vertical height and horizontal distance of the lower limit of methane explosion under different working conditions with time, compare the differences in the danger range under each working condition, and also compare the changes in concentration at monitoring points under the same leakage time and then realize the analysis of the working condition diffusion process.
The simulation scenario was set up according to the constants in Table 1 and without surrounding obstacles. The transient model was selected, the time step was set to 0.2 s, and the number of time steps was set to 600. The gas dispersion clouds after 10 s, 30 s, 60 s, and 120 s of leakage were obtained as shown in Figure 5, and the concentration changes at monitoring points at different moments were obtained as shown in Figure 6, and the hazard distance of the lower limit of methane explosion at different moments was obtained as shown in Figure 7.
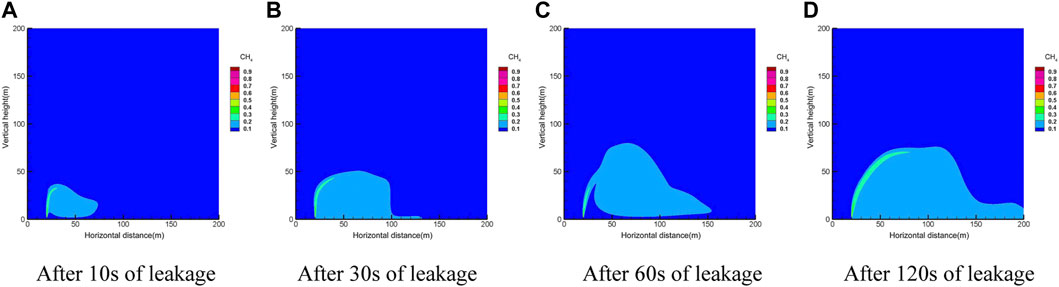
FIGURE 5. Time series of the diffusion process cloud diagram. (A) After 10 s of leakage. (B) After 30 s of leakage. (C) After 60 s of leakage. (D) After 120 s of leakage.
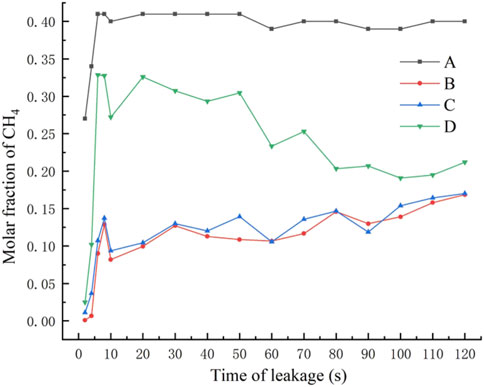
FIGURE 6. Concentration changes at monitoring points at different moments.
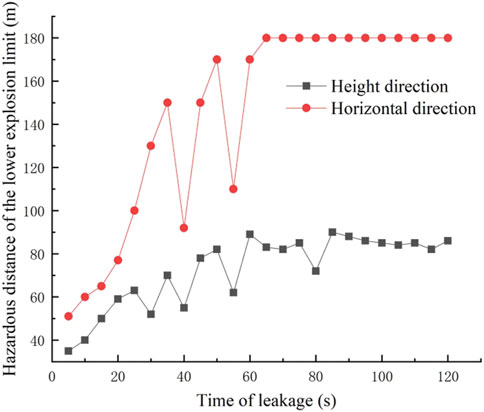
FIGURE 7. Hazard distance of the lower limit of methane explosion at different moments.
As can be seen from Figure 5, the exposed pipe is not affected by the soil resistance, and the gas is injected upward first with a large initial velocity at the beginning. With the increase in height, the kinetic energy of the gas decreases upward. At this time, the degree of influence of natural wind speed in the horizontal direction strengthens, and the gas starts to deflect to the right. The spread of natural gas and the extent of the danger zone increase with time.
From the concentration data of the monitoring points, it can be seen that the concentration change in the height direction is the largest and the fastest. When the height reaches a certain level, the concentration decreases due to the interference effect of the horizontal natural wind. Therefore, the concentration change at the monitoring point goes through three main stages: the gestation stage, the rapid growth stage, and the slow growth/stabilization stage. At the same moment, the closer to the leakage hole, the higher the gas concentration and the faster it reaches the steady state.
The lower limit of methane explosion at different moments of the change in the hazard distance can be found; the hazard distance first increases rapidly and then fluctuates at a certain interval, and finally, the boundary distance tends to stabilize. The reason for its fluctuations is that the pipeline leakage hole is small, resulting in a small amount of gas leakage, in the role of wind speed—gas is too late to form a stable boundary.
Under different leak hole diameters, the pressure at the leak outlet will change, and the leak rate will be different. The study selected four leak hole diameters of 0.02 m, 0.1 m, 0.2 m, and 0.3 m. The rest of the relevant parameters were set to default values. The gas concentration distribution under different hole diameters after the leak occurred for 60 s is shown in Figure 8, the concentration at the monitoring point under different hole diameters after 120 s is shown in Figure 9, and the diffusion heights of different apertures at different times are shown in Figure 10.
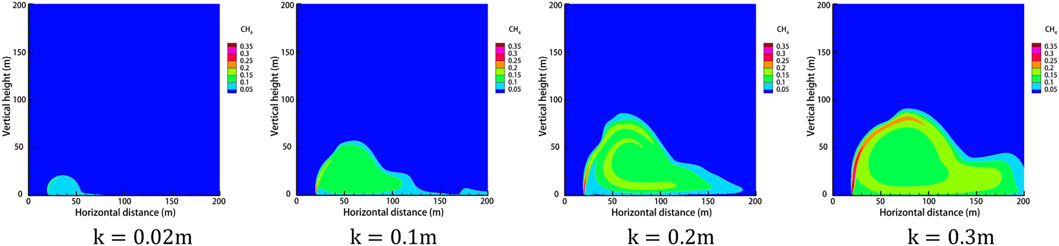
FIGURE 8. Cloud diagram of gas diffusion under different leakage apertures after 60 s of leakage. (A)
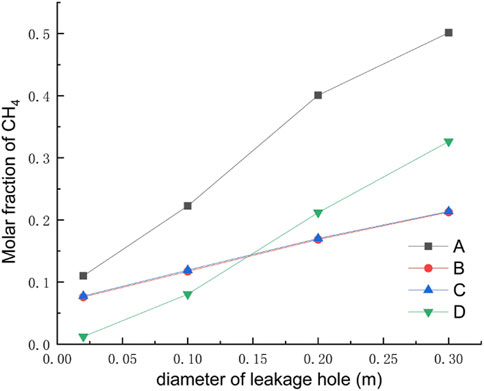
FIGURE 9. Concentration diagram of monitoring points under different leakage apertures after 120 s.
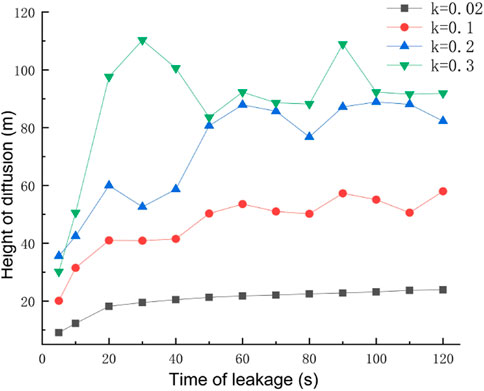
FIGURE 10. Diffusion height diagram of each leakage aperture at different times.
As can be seen from Figure 8, under the effect of a certain wind speed, there is a large effect of different sizes of leak hole diameters on the concentration range of natural gas diffusion, but the diffusion shape is roughly the same in each case. In the case of the same leak time, the size of the diffusion range of natural gas after the occurrence of a leak is proportional to the size of the leak hole diameter. By observing the concentration distribution of different orifice diameters at each monitoring point after 120 s of leakage, it is found that the closer to the leakage hole, the higher the concentration at the monitoring point. When the orifice diameter is small, the concentration at height monitoring point D is smaller than the concentration at horizontal monitoring point B/C, and as the leakage orifice diameter increases to 0.2 m, the concentration value at height monitoring point D exceeds the concentration value at the horizontal monitoring point B/C. Observation of the diffusion heights of different apertures at different moments reveals that when the leak aperture is larger, the turbulence effect is stronger, and the diffusion height of the gas is more volatile. As the leak aperture increases, the vertical diffusion height and horizontal diffusion distance of the gas increase, and the explosion hazard area range increases.
Therefore, the size of the leak hole is the most critical factor in determining the scope of the gas leak hazard, and the larger the leak hole, the wider the range of gas diffusion, resulting in more serious consequences of the accident, so the most effective emergency response is to block the leak or reduce the leak to prevent the scope of the hazard from becoming larger.
Through research on the meteorological situation along a section of a mountainous natural gas pipeline in China, the wind speed in the area is about 5 m/s for a long year, and four wind conditions of 2 m/s, 5 m/s, 8 m/s, and 11 m/s are selected considering individual extreme conditions. The rest of the relevant parameters are set to default values, and the gas leakage under different ambient wind speeds at the same leakage time is shown in Figure 11. The concentrations at the monitoring points after 120 s at different wind speeds are shown in Figure 12, and the diffusion heights at different wind speeds at different moments are shown in Figure 13.
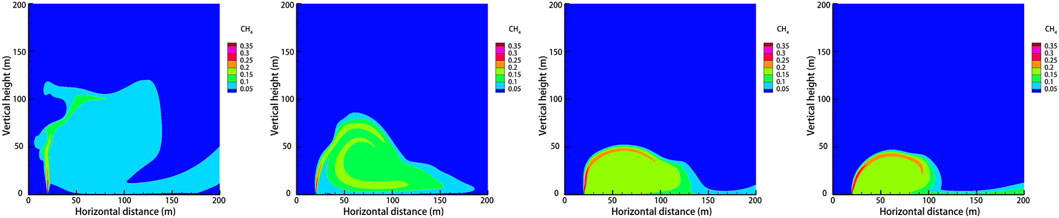
FIGURE 11. Cloud diagram of gas diffusion under different ambient wind speeds after 60 s of leakage. (A)
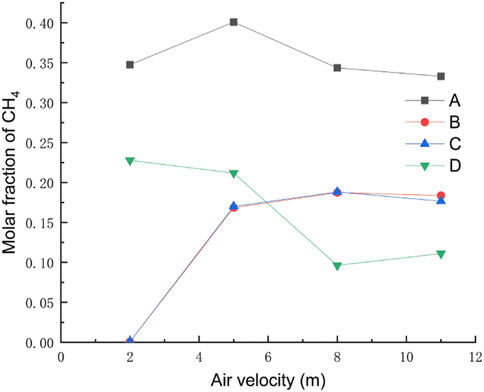
FIGURE 12. Concentration diagram of monitoring points under different ambient wind speeds after 120 s.
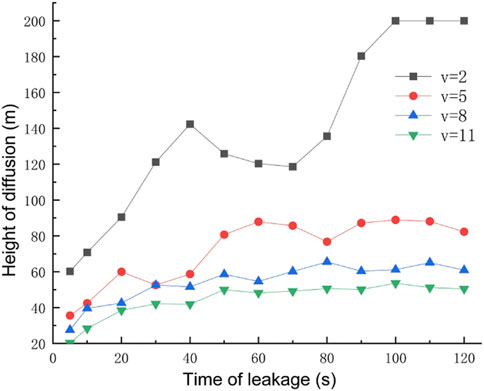
FIGURE 13. Diffusion height diagram of ambient wind speed at different times.
As can be seen from Figure 11, when the wind speed is small, the dominant effect of the gas leakage rate is obvious, and the distance of gas upward injection is larger. When the wind speed increases, the vertical diffusion height of the gas decreases and the horizontal diffusion distance increases because after the gas leak, the direction of its combined velocity shifts to the right, resulting in the gas leak being blown away by the horizontal wind speed before it has time to diffuse upward. By observing the concentration at each monitoring point under different wind speeds after the leakage occurred for 120 s, it can be concluded that when the wind speed is small, the concentration value of horizontal monitoring point B/C is very low, while the concentration of height monitoring point A/D is very high, and the gas mainly diffuses upward. As the wind speed increases, the concentration value of point B/C gradually increases, while the concentration value of point D decreases, and the gas mainly diffuses in the horizontal direction. By observing the diffusion height of each ambient wind speed at different moments, it is found that when the ambient wind speed is larger, the increase rate of vertical height decreases. As the wind speed increases, the vertical diffusion height of the gas decreases, while the horizontal diffusion distance increases, and the range of the explosion hazard area gathers near the surface.
The aforementioned analysis shows that the risk factor downwind of the leak is high, often forming a high-concentration zone, and an explosion will occur if there is an open fire in the area. Therefore, when designing pipeline lines, the local perennial wind direction should be taken into account, so that factories, residential areas, and other densely populated areas are as far away from the downwind direction of the pipeline as possible. When a natural gas leak occurs, people in the vicinity of the leak source and the downwind area should be quickly transferred to minimize casualties. When the wind speed is small, the rescue focus is on the high-altitude area. When the wind speed is large, natural gas is along the ground to form a high-concentration area, so the rescue focus is near the ground area. Wind speed can dilute the concentration of leaking gas, and emergency rescue, on the premise of eliminating the source of fire, should strengthen ventilation.
Since there are more trees and mountains in mountainous areas for natural gas pipelines, and it is found through field research that there are more densely populated high-consequence areas along the pipelines, and there are dense buildings around the pipelines, the gas dispersion pattern under various obstacle situations needs to be analyzed.
The obstacle was set to 5 m away from the leak, the obstacle height was taken as 5 m, 10 m, 20 m, and 30 m for four working conditions, the rest of the relevant parameters were set to the default values, and the gas leakage under different obstacle heights is derived as shown in Figure 14. After 120 s of leakage, the concentration at each monitoring point under different obstacle heights is shown in Figure 15. The diffusion heights of different obstacle heights at different times are shown in Figure 16.
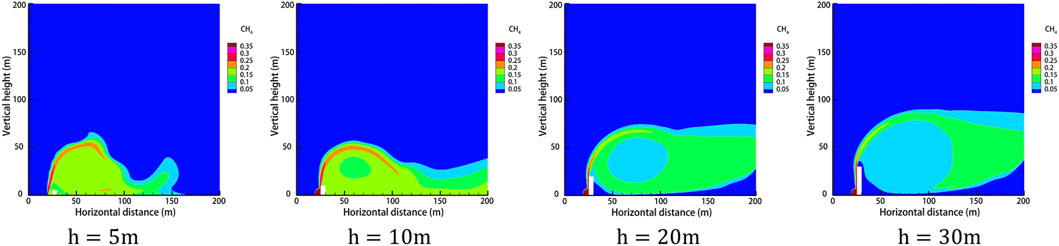
FIGURE 14. Gas dispersion clouds at different obstacle heights after 60 s of leakage. (A)
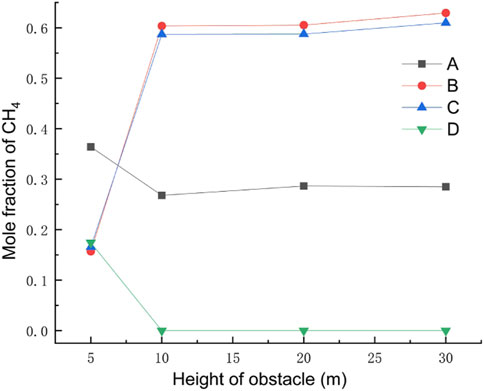
FIGURE 15. Concentration map of monitoring points under different obstacle heights after 120 s.
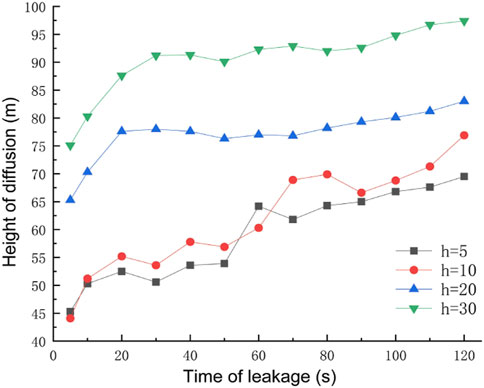
FIGURE 16. Diffusion height diagram for each obstacle height at different moments.
As can be seen from Figure 14, when the gas leak meets the obstacle, it will be subjected to the resistance effect, at which time point the part of the gas will move in the opposite direction, forming a vortex on the windward side of the obstacle, gathering a large amount of gas, and forming a high-concentration area, and the other part will cross the top of the obstacle and form a concentration, gathering area behind the obstacle. When the obstacle is too low, the leaking gas can easily cross the obstacle and form a high-concentration area both at the front and behind it. When the obstacle is high enough, the gas crosses the obstacle less and the gas concentration is lower near the surface of the leeward side of the obstacle, while when the height of the obstacle is greater, the gas will be moved higher and the leaking gas will blow away before it can fall back, resulting in a very low methane concentration in the area behind the obstacle. By observing the concentrations of each monitoring point under different obstacle heights after 120 s of leakage, when the obstacle is higher, under the effect of wind speed, a large amount of gas will be blown to the windward side of the obstacle. The gas will spread upward along the surface of the obstacle, which leads to very low concentrations at height monitoring point A/D and high concentrations at horizontal monitoring point B/C. Observation of different obstacle heights at different moments of gas diffusion height found that as the height of the obstacle increases, the vertical diffusion height of the gas increases, and the explosion hazard area range to the upper air layer gathered.
The height of the obstacle is set to 10 m, and the distance between the obstacle and the leak is taken as 5 m, 10 m, 20 m, and 30 m for four working conditions. The rest of the relevant parameters are set to the default values, and the gas leakage under different obstacle distances is obtained as shown in Figure 17. The concentration of each monitoring point under different obstacle distances after 120 s of leakage is shown in Figure 18. The dispersion heights of different obstacle distances at different times are shown in Figure 19.
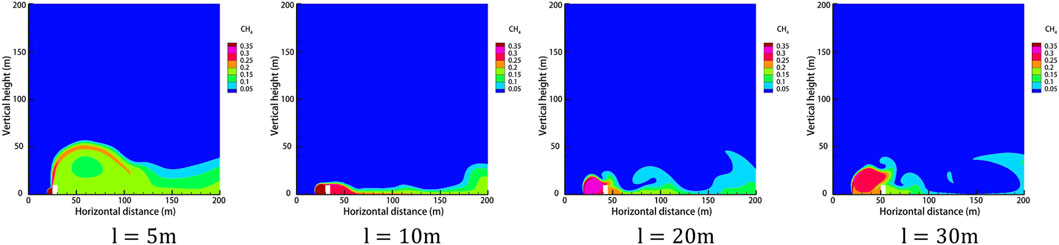
FIGURE 17. Gas dispersion clouds at different obstacle distances after 60 s of leakage. (A)
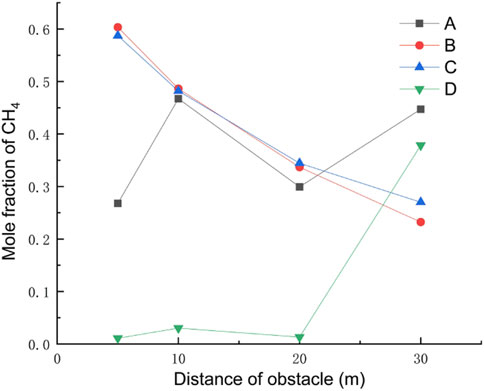
FIGURE 18. Concentration map of monitoring points at different obstacle distances after 120 s.
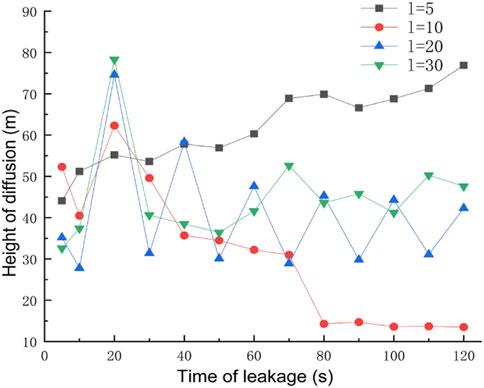
FIGURE 19. Diffusion height diagram of each obstacle distance at different moments.
As can be seen from Figure 17, the gas ejected from the leak will form a vortex area on the windward side of the obstacle, which is easy to form a high-concentration area. As the distance between the obstacle and the leakage port becomes farther, the high-concentration area on the windward side of the obstacle becomes larger, after increasing to a certain distance. Although the high-concentration area will become larger, due to the dilution effect, its concentration has been reduced. As the distance between the obstacle and the leak becomes farther, the gas diffusion area on the leeward side of the obstacle becomes smaller, and the concentration decreases. Observation of the concentration of monitoring points under different distances of obstacles after 120 s of leakage reveals that when the distance of obstacles becomes farther, the concentration of horizontal monitoring point B/C decreases, and the concentration of height monitoring point D increases, which is because of the vortex formed on the windward side of obstacles becomes larger, and the concentration decreases. Also, at this time, the gas will not spread upward along the surface of obstacles; meanwhile, the concentration of height monitoring point D appears to increase. Observation of the diffusion height of different obstacle distances in different moments reveals that with the increase in the obstacle distance, the gas vertical diffusion height first increases and then decreases, and in the obstacle at a distance of 10 m from the leak located at the mouth, the gas diffusion height is the smallest, indicating that the gas diffusion height and the distance of the obstacle are not in a linear relationship.
When the pipeline is located in a densely populated high-consequence area, the buildings here must be dense, and the gas leakage dispersion will be different when there are multiple buildings. The distance between buildings is set to 10 m, the rest of the relevant parameters set to default values, and the gas diffusion law is studied when two buildings and three buildings exist side by side. The gas diffusion under a different number of obstacles is derived as shown in Figure 20. The diffusion height under a different number of obstacles at different moments is shown in Figure 21.
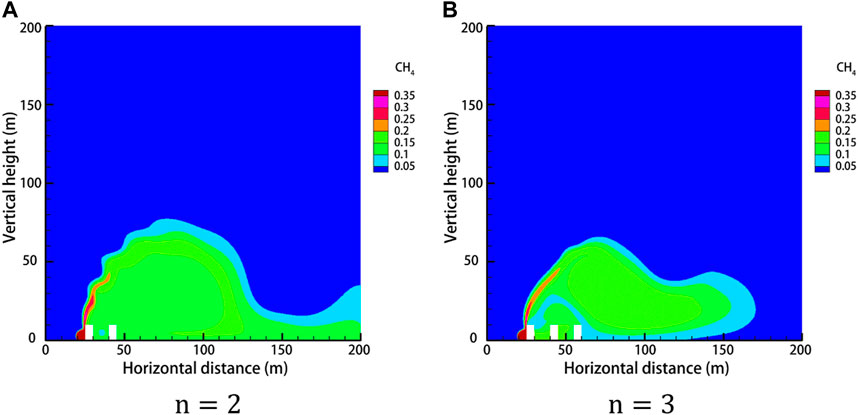
FIGURE 20. Gas dispersion clouds with different number of obstacles after 60 s of leakage. (A)

FIGURE 21. Diffusion height at different times for different number of obstacles.
From Figure 20, we can see that the number of obstacles changes the diffusion pattern after the gas leak. Two buildings side by side have a weaker blocking effect on the gas, and the concentration between buildings is lower, while the gas concentration in the area behind the buildings is higher, forming a larger concentration area. Three buildings side by side have a stronger blocking effect on the gas, and the concentration between buildings is higher, while the concentration in the area behind the buildings is lower. By observing the diffusion height at different moments with a different number of obstacles, it is found that the gas vertical diffusion height decreases with the increase in the number of obstacles.
Based on the law of the influence of different obstacle heights, distances, and quantities on gas diffusion, accident losses can be mitigated in the following ways:
1) The influence area is different with different obstacle heights. When the obstacle is low, the gas mainly converges near the surface, and when the obstacle is high, the gas diffuses to a high altitude. In the natural gas explosion accident, the main rescue area is the ground of low obstacles and high obstacles at high altitudes.
2) Because the higher the obstacle, the greater the barrier effect on the gas in the diffusion, under the conditions of meeting the economy, as far as possible to build a high retaining wall.
3) When planning the location of the retaining wall, it is not better to be closer to the pipeline. When it is too close to the pipeline, the leaking gas will easily cross the retaining wall, while when it is too far from the pipeline, the high-concentration area on the windward side of the retaining wall is too large, exposing a large risk area and causing waste of resources such as land. When planning pipeline routes, the distance should be reasonably planned when there are buildings and other obstacles around.
4) For accident rescue after natural gas leakage, the windward side of the obstacle should be included in the emergency rescue area, this area may be poisoned shock, rescue personnel need to be fully equipped, and the first task is to cut off all sources of ignition in the area to avoid an explosion accident.
As the mountainous terrain is more complex and changeable, the pipeline-laying environment is also different from that of the plain area. Through the research, the laying environment is divided into four situations: the foot of a 30-degree slope, the foot of a 60-degree slope, the surface of a 30-degree slope, and the surface of a 60-degree slope. The diffusion law of gas leakage under different situations is shown in Figure 22. The diffusion heights of the pipes laid at the foot of the slope at different times are shown in Figure 23, and the diffusion heights of the pipes laid on the surface of the slope at different times are shown in Figure 24.
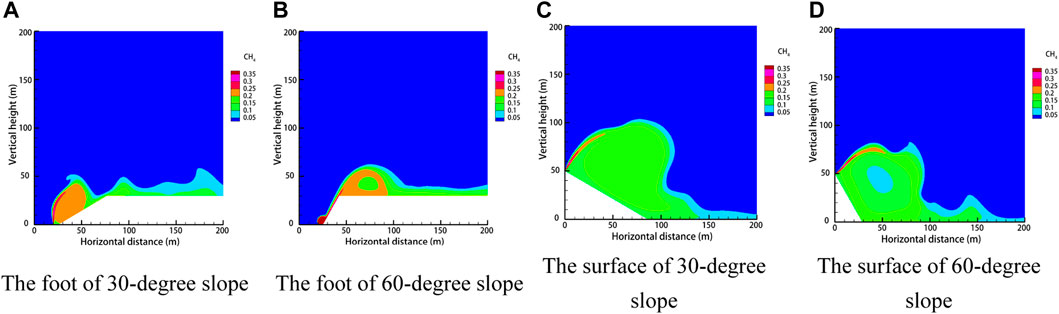
FIGURE 22. Dispersion clouds of different laying environments after 60 s of leakage. (A) Foot of 30-degree slope. (B) Foot of 60-degree slope. (C) Surface of 30-degree slope. (D) Surface of 60-degree slope.
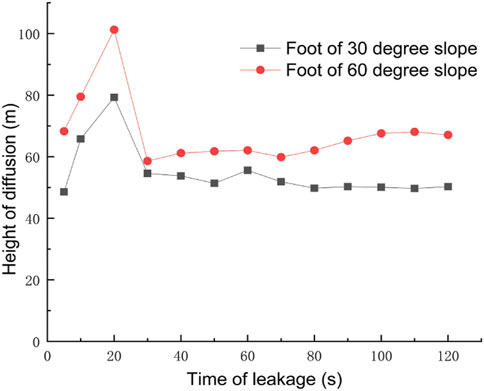
FIGURE 23. Diffusion height map of pipelines laid at the foot of the slope at different times.
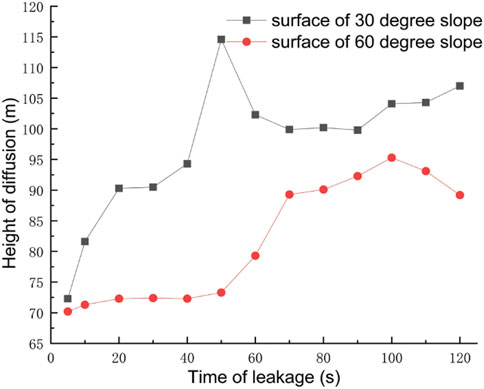
FIGURE 24. Diffusion height map of pipelines laid at the surface of the slope at different times.
For the pipeline laid at the foot of the slope, when the slope is small, the gas will form a large high-concentration area at the slope surface, and its diffusion law is closer to the obstacle-free condition. When the slope is larger, a smaller high-concentration area will be formed at the foot of the slope, and a part of the gas will be diffused upward along the slope. Its diffusion law is closer to the vertical obstacle condition. After the gas pipeline leaks at the foot of the slope, the focus of emergency and rescue is on the slope surface of the small slope and the top of the large slope. Meanwhile, as the slope increases, the vertical diffusion height of the gas increases, and the horizontal diffusion rate decreases.
For the pipeline laid on the surface of the slope, when the slope is small, the gas mainly diffuses upward and mostly gathers on the slope surface. When the slope is large, the height of gas diffusion upward decreases, the horizontal diffusion distance becomes farther, and the gas mostly gathers at the foot of the slope and forms an area of higher concentration on the ground. At the same time, with the increase in the slope, the vertical diffusion height of the gas decreases, the gas reaches the foot of the slope faster, and the horizontal diffusion speed increases.
Therefore, the location of the laid pipeline is different, and the focus of emergency rescue is different. When a leak occurs in the pipeline at the foot of the slope, the gas spreads along the surface of the slope. When the slope is small, the focus of control should be placed on the surface of the slope. When the slope is large, the focus of control should be placed on the top of the slope. When the pipeline on the surface of the slope is leaking and the slope is small, the control focus should be on the surface of the slope. When the slope is large, the control focus should be on the bottom of the slope.
This article establishes a diffusion model of exposed natural gas pipeline leakage, analyzes the leakage diffusion process, and analyzes the diffusion law and danger area under different leakage apertures, ambient wind speeds, obstacle situations, laying positions, and other factors according to the injury concentration threshold of natural gas and finally puts forward the focus of emergency rescue and control measures development, mainly forming the following conclusions:
1) The exposed pipeline is different from the buried pipeline leakage because it is not affected by the soil resistance. The gas is injected upward first, and the starting speed is large, with the increase in height. The kinetic energy of the gas decreases upward. Also, at this time, the influence of the natural wind speed in the horizontal direction is strengthened, and the gas will be deflected to the right. The diffusion range of natural gas increases with time, and the area of the danger zone increases. The lower explosion limit of methane after gas leakage in the height direction and horizontal direction of the hazard distance changing with the leakage time is roughly the same law, and the hazard distance first increases rapidly and then fluctuates at a certain interval. Finally, the boundary distance tends to be stable. Therefore, the vicinity of the leak source and downwind area should be used as the focus area for personnel rescue.
2) As the diameter of the leak hole increases, the vertical diffusion height of the gas, the horizontal diffusion distance, and the range of the explosion hazard area will increase. When the leak hole diameter is larger, the turbulence effect is stronger, and the gas diffusion height is more volatile. The size of the leak hole diameter is the most critical factor in determining the hazard range of a gas leak, and the most effective emergency response is to block the leak or reduce the leak to prevent the hazard range from becoming further larger.
3) With the increase in wind speed, the gas vertical diffusion height decreases, while the horizontal diffusion distance increases, and the scope of the explosion hazard area to the surface near the gathering increases. When the wind speed is small, the focus of rescue is the high-altitude area. When the wind speed is larger, along the ground to form a high-concentration area, the focus of rescue is near the ground area. Wind speed can dilute the concentration of the leaking gas, and emergency rescue, on the premise of eliminating the source of fire, should strengthen ventilation.
4) Obstacles have a certain resistance effect. With the increase in the height of the obstacles, the gas vertical diffusion height increases, the explosion hazard area range to the upper air layer gathered, and the gas diffusion height and the distance of the obstacles are not in a linear relationship. With the increase in the number of obstacles, the gas vertical diffusion height decreases. In the natural gas explosion accident, the main rescue area location is the ground of low obstacles and high obstacles of high altitude. When planning the location of the retaining wall, not being closer to the pipeline is better, and when there are buildings and other obstacles around the pipeline, the distance should be reasonably planned.
5) The location of the laid pipeline is different, and the focus of emergency rescue is different. When a leak occurs in the pipeline at the foot of the slope, the gas spreads along the surface of the slope. When the slope is small, the focus of control should be placed on the surface of the slope. When the slope is large, the focus of control should be placed on the top of the slope. When the pipeline on the surface of the slope is leaking and the slope is small, the control focus should be on the surface of the slope. When the slope is large, the control focus should be on the bottom of the slope.
The original contributions presented in the study are included in the article/Supplementary Material; further inquiries can be directed to the corresponding author.
DX: theoretical analysis, numerical simulation method study, and conclusion analysis; LC: theoretical analysis, establishment of simulation scenarios, and conclusion analysis; WZ: numerical modeling and validation; KZ: numerical simulation studies; JL: post-processing; YJ: pipeline-operating condition data collection and collation; and RM: literature research.
Author WZ was employed by Baoji Petroleum Steel Pipe Co., Ltd.
The remaining authors declare that the research was conducted in the absence of any commercial or financial relationships that could be construed as a potential conflict of interest.
All claims expressed in this article are solely those of the authors and do not necessarily represent those of their affiliated organizations, or those of the publisher, the editors, and the reviewers. Any product that may be evaluated in this article, or claim that may be made by its manufacturer, is not guaranteed or endorsed by the publisher.
Aguilera, R. F. (2014). The role of natural gas in a low carbon Asia Pacific. Appl. Energy 113, 1795–1800. doi:10.1016/j.apenergy.2013.07.048
Britter, R. E., and Mcquaid, J. (1988). Workbook on the dispersion of dense gases. Health & Saf. Exec. 211, 656–661.
Bu, F., Liu, Y., Liu, Y., Xu, Z., Chen, S., Jiang, M., et al. (2021). Leakage diffusion characteristics and harmful boundary analysis of buried natural gas pipeline under multiple working conditions. J. Nat. Gas Sci. Eng. 94, 104047. doi:10.1016/j.jngse.2021.104047
Dai, Y., Mak, C. M., Ai, Z., and Hang, J. (2018). Evaluation of computational and physical parameters influencing CFD simulations of pollutant dispersion in building arrays. Build. Environ. 137, 90–107. doi:10.1016/j.buildenv.2018.04.005
EGIG (2020). 11th Report of the European gas pipeline incident data Group (period 1970 – 2019) Comprising. EGIG Report
Ermak, D. L., Chan, S. T., Morgan, D. L., and Morris, L. K. (1982). A comparison of dense gas dispersion model simulations with burro series LNG spill test results. J. Hazard. Mater. 6, 129–160. doi:10.1016/0304-3894(82)80037-x
Fan, Y. V., Perry, S., Klemeš, J. J., and Lee, C. T. (2018). A review on air emissions assessment: Transportation. J. Clean. Prod. 194, 673–684. doi:10.1016/j.jclepro.2018.05.151
Hoeks, J. (1975). Effect of leaking natural gas on soil and vegetation in urban areas. Soil Sci. 120, 317–318. doi:10.1097/00010694-197510000-00022
Jackson, R. B., Down, A., Phillips, N. G., Ackley, R. C., Cook, C. W., Plata, D. L., et al. (2014). Natural gas pipeline leaks across Washington, DC. Environ. Sci. Technol. 48, 2051–2058. doi:10.1021/es404474x
Kiša, M., and Jelemenský, L. (2009). CFD dispersion modelling for emergency preparadnes. J. Loss Prev. Process Ind. 22, 97–104. doi:10.1016/j.jlp.2008.09.013
Liu, A., Huang, J., Li, Z., Chen, J., Huang, X., Chen, K., et al. (2018). Numerical simulation and experiment on the law of urban natural gas leakage and diffusion for different building layouts. J. Nat. Gas Sci. Eng. 54, 1–10. doi:10.1016/j.jngse.2018.03.006
Liu, B., Liu, X., Lu, C., Godbole, A., Michal, G., and Tieu, A. K. (2016). Computational fluid dynamics simulation of carbon dioxide dispersion in a complex environment. J. Loss Prev. Process Ind. 40, 419–432. doi:10.1016/j.jlp.2016.01.017
Meroney, R. N. (2012). CFD modeling of dense gas cloud dispersion over irregular terrain. J. Loss Prev. Process Ind. 104-106, 500–508. doi:10.1016/j.jweia.2012.01.001
Phillips, N. G., Ackley, R., Crosson, E. R., Down, A., Hutyra, L. R., Brondfield, M., et al. (2013). Mapping urban pipeline leaks: Methane leaks across Boston. Environ. Pollut. 173, 1–4. doi:10.1016/j.envpol.2012.11.003
Rui, Z., Han, G., Zhang, H., Wang, S., Pu, H., and Ling, K. (2017). A new model to evaluate two leak points in a gas pipeline. J. Nat. Gas Sci. Eng. 46, 491–497. doi:10.1016/j.jngse.2017.08.025
Scargiali, F., Grisafi, F., Busciglio, A., and Brucato, A. (2011). Modeling and simulation of dense cloud dispersion in urban areas by means of computational fluid dynamics. J. Hazard. Mater. 197, 285–293. doi:10.1016/j.jhazmat.2011.09.086
Sini, J. F., Anquetin, S., and Mestayer, P. G. (1996). Pollutant dispersion and thermal effects in urban street canyons. Atmos. Environ. 30, 2659–2677. doi:10.1016/1352-2310(95)00321-5
Sklavounos, S., and Rigas, F. (2006). Estimation of safety distances in the vicinity of fuel gas pipelines. J. Loss Prev. Process Ind. 19, 24–31. doi:10.1016/j.jlp.2005.05.002
Smith, K. L., Colls, J. J., and Steven, M. D. (2005). A facility to investigate effects of elevated soil gas concentration on vegetation. Water Air Soil Pollut. 161, 75–96. doi:10.1007/s11270-005-2833-x
Soulhac, L., Lamaison, G., Cierco, F. X., Ben Salem, N., Salizzoni, P., Mejean, P., et al. (2016). Siranerisk: Modelling dispersion of steady and unsteady pollutant releases in the urban canopy. Atmos. Environ. 140, 242–260. doi:10.1016/j.atmosenv.2016.04.027
Ulden, A. V. (1974). “On the spreading of a heavy gas released near the ground,” in Proceedings of First International Loss Prevention Symposium, 221–226.
Wilkening, H., and Baraldi, D. (2007). CFD modelling of accidental hydrogen release from pipelines. Int. J. Hydrog. Energy 32, 2206–2215. doi:10.1016/j.ijhydene.2007.04.022
Xiao, J., Kong, W., Wang, X., and Li, M. (2020). Numerical modeling and assessment of natural gas pipeline separation in China: The data from henan province. Pet. Sci. 17, 268–278. doi:10.1007/s12182-019-00400-5
Xing, J., Liu, Z., Huang, P., Feng, C., Zhou, Y., Zhang, D., et al. (2013). Experimental and numerical study of the dispersion of carbon dioxide plume. J. Hazard. Mater. 256-257, 40–48. doi:10.1016/j.jhazmat.2013.03.066
Zhang, S., Wang, X., Cheng, Y. F., and Shuai, J. (2020). Modeling and analysis of a catastrophic oil spill and vapor cloud explosion in a confined space upon oil pipeline leaking. Pet. Sci. 17, 556–566. doi:10.1007/s12182-019-00403-2
Zhang, Z. W., Wang, J. C., Zhang, J. H., and Frank Cheng, Y. (2021). Modeling of the mechano-electrochemical effect at corrosion defect with varied inclinations on oil/gas pipelines. Pet. Sci. 18 (5), 1520–1529. doi:10.1016/j.petsci.2021.08.012
Keywords: natural gas pipeline in mountains, the law of leakage diffusion, exposed pipe leakage, safety management, emergency response strategies
Citation: Xu D, Chen L, Zhan W, Zhang K, Lu J, Ji Y and Ma R (2023) Study on the leakage dispersion law of exposed high-pressure natural gas pipelines in the mountainous environment. Front. Energy Res. 10:1031006. doi: 10.3389/fenrg.2022.1031006
Received: 29 August 2022; Accepted: 21 September 2022;
Published: 11 January 2023.
Edited by:
Daoyi Zhu, China University of Petroleum, Beijing, ChinaReviewed by:
Wei Sun, Northeast Petroleum University, ChinaCopyright © 2023 Xu, Chen, Zhan, Zhang, Lu, Ji and Ma. This is an open-access article distributed under the terms of the Creative Commons Attribution License (CC BY). The use, distribution or reproduction in other forums is permitted, provided the original author(s) and the copyright owner(s) are credited and that the original publication in this journal is cited, in accordance with accepted academic practice. No use, distribution or reproduction is permitted which does not comply with these terms.
*Correspondence: Duo Xu, eHVkdW85NUAxMjYuY29t
†These authors contributed equally to this work and share first authorship
Disclaimer: All claims expressed in this article are solely those of the authors and do not necessarily represent those of their affiliated organizations, or those of the publisher, the editors and the reviewers. Any product that may be evaluated in this article or claim that may be made by its manufacturer is not guaranteed or endorsed by the publisher.
Research integrity at Frontiers
Learn more about the work of our research integrity team to safeguard the quality of each article we publish.