 Xiaolin Wang
 Xiangyi Lu1†
 Zhankun Liu
 Xiangping Hu
95% of researchers rate our articles as excellent or good
Learn more about the work of our research integrity team to safeguard the quality of each article we publish.
Find out more
ORIGINAL RESEARCH article
Front. Energy Res. , 24 January 2023
Sec. Sustainable Energy Systems
Volume 10 - 2022 | https://doi.org/10.3389/fenrg.2022.1029077
This article is part of the Research Topic Sustainable Planning and Life-Cycle Thinking of Energy Infrastructure View all 23 articles
China’s market-oriented reform supports the sustainable development of energy mix and the low-carbon target, and natural gas has bridged the transition from traditional fossil energy to clean and renewable energies. The third-party access policy, launched recently by China’s natural gas market, drives the decouple between gas trade and transport. The decouple might lead to the transmission resources of physical network not optimally used, which is caused by the contractual arrangement between entry and exit capacities in commercial network. Aiming at this issue, we established a mathematical programming with equilibrium constraints (MPEC) to integrate the allocations of commercial capacity and physical flows, based on a minimum cost maximum flow problem (MCMF) abstracted from China’s existing gas network. The MPEC model was then used to strategically evaluate the transmission efficiency, and identify the critical factors of its loss. Our results show that there is transmission efficiency loss of China’s gas network from the shortage of geospatial gas supply and the invisible segmentation of gas network due to interdicted cost of pipeline, bottleneck of pipeline capacity and economic radius of gas supply chains to transport gas. Therefore, the critical factor of the loss to be identified will be helpful for strategically reducing the cost of decoupling gas trade and transport.
1) The spatial mismatch of entry/exit capacities causes network transmission efficiency loss.
2) MPEC integrates the commercial capacity allocation and physical flows allocation.
3) The interdicted costs lead to the segmentation of local network.
4) The elasticity of pipeline capacity is spatially heterogeneous.
5) The economic radius of gas supply chains hinders network integration.
As a clean and efficient energy, natural gas has been bridging the energy transition security from traditional fossils to renewable energies for coping with climate change and energy sustainable development in countries all over the world (Ogden et al., 2018; Gillessen et al., 2019; Holz, 2020). Chinese government has been committed to the development and utilization of natural gas, meeting with the goal of carbon emission reduction (Qin et al., 2019; Xu & Lin, 2019). At present, market-oriented reform of natural gas is an important guarantee for the sustainable development and supply security of China’s natural gas market, which is very critical for supporting the energy transition.
Recently, China has promulgated the directive of the third-party access and established National Oil and Gas Pipeline Company (SONGPC) to accelerate natural gas market from monopoly to perfect competition (DNRC & NEA, 2018; DNRC, 2019). The directive encourages gas traders to enter natural gas network without discriminatory, resulting in gradual decoupling between natural gas trade and transport (Wang and Cheng, 2017; Xu, et al., 2017; Dong et al., 2019). Consequently, gas traders shift the competition for pipeline capacity to for entry and exit capacity of nodes in gas network. The SONGPC acts as a transmission system operator (TSO) to deliver gas from entry nodes to exit nodes. However, the entry-exit capacities booked by traders will hinder physical network not optimally used. It produces the transmission efficiency loss of gas network from the decoupling. Thereby, how to identify the critical factors of transmission efficiency loss is crucial for SONGPC to explore the strategies for reducing the efficiency loss by rationally allocating the entry and exit capacities for gas traders.
Analysing the transmission efficiency loss was firstly conducted in traffic network research (Roughgarden, 2002) by the cost of travellers in user equilibrium exceeding the optimal cost of the traffic network (Huang et al., 2006; Lindseya et al., 2019). The mathematical program with equilibrium constraints (MPEC) is employed to evaluate the losses between the leader TSO and the follower users (Patriksson and Rockafell, 2002). There were existing literatures focusing on either the minimum transport cost or the maximum profits of TSO, but little attention on the transmission efficiency losses of natural gas network.
The transport cost was involved in the allocation of gas flows. It is generally affected by the controls of compressors, valves and gas velocity, and usually optimized by mixed integer or linear programming models (Richard et al., 1979; Wolf & Smeers, 2000; Rose et al., 2016). In addition, the profit drives the TSO to arbitrage between transportation charge and transmission cost in liberalized gas market (Golombek et al., 1995; Gabriel, 2005). It may lead to the pipeline capacity to be allocated inefficiently. In market equilibrium modelling, many researchers have tried to explore the impacts of monopoly, transportation fee, long-term contract, and pipeline bottleneck on the efficiency losses (Cremer and Laffont, 2003; Egging et al., 2008; Gabriel and Smeer, 2006). However, these studies focused on the allocation of pipeline capacity rather than the entry/exit capacities of nodes.
Entry-exit regime was implemented in European gas market to allocate the entry-exit capacity around a virtual hub (Hunt, 2008). However, the regime faces a challenge of the transmission capacity not efficiently used because of the line-pack flexibility not commercially covered and the congestion from the contractual arrangement between one entry node and one exit node (Keyaerts et al., 2011; Hallack and Vazquez, 2013). Vazquez and Hallack (2013) developed a clearing algorithm for the combinational auctions of entry/exit capacity with the aim to discover the entry and exit nodal prices for guiding the efficient allocation of network resources. However, their studies still regarded physical network as a black box. These researchers expected that the hands of free market can allocate transmission resources efficiently. However, there are still market failures from the lack of TSO’s intervention through unified scheduling of gas flows.
Therefore, there is a necessary for the TSO to transform the allocation of entry and exit capacities into gas flows through physical gas network. Hiller and his colleagues have developed a bi-level programming for the TSO to improve the transformation with a two-stage model (Hiller et al., 2018). However, this programming is difficult to mathematically find a feasible solution since it is challenged by the uncertainty of capacity contracts and the transported feasibility of a given gas flow. Series of optimalization models (MINLP, NLP, and MPEC etc.) have been developed to overcome the drawbacks (Koch et al., 2015). Furthermore, based on the assumption of linear gas flow, Böttger et al. (2022) developed an exact single-level reformulation for a four-level programming to reduce the difficulty (Grimm et al., 2019).
To make it simpler, Hennig and Schwarz (2016) transferred the bi-level programming to an incapacitated maximum-minimum cost flow problem (UMMCF). In this programming, gas traders as a leader tried to pay the maximum transmission cost while TSO as a follower hoped to balance the injected and withdrawn gas at all nodes with the minimum cost. Furthermore, Hoppmann and Schwarz (2016) reformulated this problem by applying Karush-Kuhn-Tucker condition (KKT) to the follower, and then the UMMCF is substituted to the MPEC which is easy to solve with the software CPLEX. The above models, however, do not solve the spatial mismatch caused by the contractual arrangement between entry and exit capacities, which leads to gas flow inefficiently allocated in the physical network.
If all entry nodes are aggregated into one virtual entry node and all exit nodes into one virtual exit node, the UMMCF could be transformed into a classic minimum cost maximum flow problem (MCMF) with the objective at the upper level changed to the maximum entry-exit capacity (Boykov and Kolmogorov,2004; Benda et al., 2019; Moolman, 2020). Actually, gas traders are willing to pay the maximum transmission cost to book the entry or exit capacity at the node in advance as much as possible. Therefore, the entry and exit capacities can be optimally allocated to reduce the spatial mismatch between one entry node and one exit node without restriction from the contractual arrangement. The MCMF is also a combinatorial graph problem which is characterized by bipartite matching (Chen et al., 2022). It was usually solved by the primal-dual algorithm, but not efficient and robust (Moolman, 2020). In the early research literatures, Bollobás et al. (1998) and Russell et al. (1998) implied that MCMF was a bi-level optimization problem that could be easily solved by the MEPC model (Xie et al., 2012). Unfortunately, it has not been further reformulated into a MPEC problem.
In this paper, the transmission cost of gas network is taken as the efficiency index, and further a MPEC model was established to integrate the allocation of commercial capacity and that of physical flows, based on a MCMF problem abstracted from existing gas network with only one virtual entry node and one virtual exit node in Section 2. This model was a coarse-grained bi-level programming without considering gas pressure, velocity, and line-pack. Subsequently, the model was used to evaluate the transmission efficiency of China’s existing gas network in Section 3, and to identify the critical factors of its loss in Sections 4. Finally, some conclusions and suggestions were given in Section 5.
This paper has two contributions: Firstly, the MPEC model is established to integrate the allocation of commercial capacity and that of physical flows, based on a MCMF problem abstracted from existing gas network with only one virtual node and one exit node. It provides the direction for reducing the transmission efficiency loss of gas network from the spatial mismatch between the entry and exit capacity in the context of decoupling between gas trade and transport. Secondly, the transmission efficiency loss of China’s existing gas network is identified from two aspects: one from the spatial mismatch between the entry and exit capacities caused by the shortage of natural gas supply and another from invisible segmentation in gas network, which is caused by interdicted cost of pipeline, bottleneck of pipeline capacity and economic radius of gas supply chains to transport gas.
A natural gas network with multiple entry and exit nodes, illustrated by Wolf and Smeers (2000), was introduced in this paper with nodal pressure not considered, as shown in Figure 1A. In this network, Sg, Sm, Sk and Sn are the entry capacities. Similarly, Dh, Dl and Do are the exit capacities. Considering the entry and exit capacities, a transportation problem model (TP) could be employed to dispatch gas flows through physical network. As mentioned in Section 1, there might be a spatial mismatch from the contractual arrangement between entry capacity and exit capacity. TSO needs to reallocate the capacity booked by gas traders on the maximum carrying capacity of physical network to rebalance the booked entry/exit capacities through the gas flows.
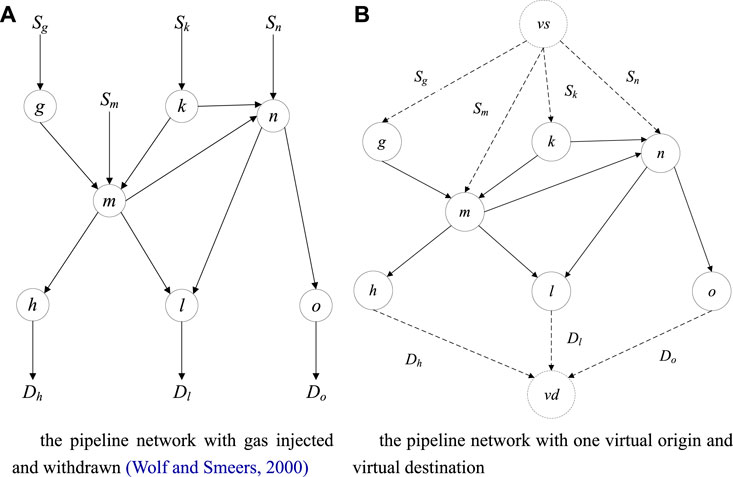
FIGURE 1. A transportation network is generalized into a network with a pair of O-D (A) the pipeline network with gas injected and withdrawn (Wolf and Smeers, 2000) (B) the pipeline network with one virtual origin and virtual destination.
All entry nodes g, m, k, and n are connected to a virtual original node
Suppose there is a gas network G (V, A, C, B), where
The upper level:
and the lower level:
The objective function in the lower level, as seen the Eq B-2, should comply with the constraint equations as follows from B-3 to B-6, where
Applying the KKT to the eqs B-2–6, we could obtain the dual conditions as given in Equations M-2 to M-7. If these conditions are combined with the objective function in the upper level, and then the MCMF would be reformulated into a MPEC model. This MPEC model could be solved by the software GAMS.
The MPEC model can obtain the optimal flows
The KKTs of the TP are:
The above three equations T-4, T-5 and T-6 constitute the MCP model of transportation programming (TP). The GAMS solver can be used to solve the MCP model to obtain the optimal flow distribution of the given gas-injected and withdrawn flows in gas network, as well as the entry/exit nodal price of each node. In addition, we can track the nodal prices along the arcs in gas network from equations T-4 and T-6 to get insight into the transmission efficiency loss. The right item of the equation T-4 can be denoted as
1) if
2) However, when
3) Conversely, in equation T-4 if
The length of China’s long-distance natural gas pipelines has reached 7.8 × 10⁴ km by the end of 2018, constructing a gas network that runs from the north to the south, and crosses from the east to the west (see Appendix 1). This network is mainly composed of the West-East Gas Transmission Lines, Shaanxi-Beijing Line, Sichuan-East Gas Transmission Line, Zhong-Wu Line and China-Myanmar Line. These pipelines are gradually linked by the branch pipelines, such as Ji-Qing-Ning line, Lan-Yin Line, Zhong-Gui Line and Zhong-Jing Line. Chinese government is planning to build China-Russian East Line, Sakhalin Line, Ordos-Anping-Cangzhou Line and Xinjiang-Guangdong-Zhejiang Line. These four trunk lines will make up for the gas shortage of five gas supply chains of Tarim Basin, Ordos Basin, Sichuan Basin, Songliao Basin and import LNG in southeast coast, as shown in Appendix 2 (Wang et al., 2022).
In this paper, gas sources and cities located at the main pipelines are selected as entry and exit nodes, respectively. According to their latitude and longitude, China’s exiting gas network is generalized as shown in Appendix 3. Therefore, there are 264 nodes and 309 pipelines in the generalized gas network.
1) Supply and demand nodes. There are 29 supply nodes and 235 demand nodes. The supply nodes include domestic gas, imported pipeline gas and LNG receiving stations as shown in Appendix 2. The imported LNG is converted to gas volume under the standard state by the conversion factor published in BP World Energy Statistical Yearbook (2022). The demand is the gas volumes consumed by a city or aggregated cities around a central city. Data resource are from the CNPC Yearbook, Sinopec Yearbook, China Energy Statistics Yearbook, provincial statistical yearbooks, and EPS database (CNOOC Yearbook, 2018; CNPC Yearbook, 2018; Sinopec Yearbook, 2018).
2) Pipelines and pipeline capacity. Pipelines in the generalized gas network include existing gas trunk lines and long-distance pipelines under construction. The pipeline capacity is based on the design transmission capacity. The data is from the CNPC Yearbook and Sinopec Yearbook.
3) Transportation cost. Pipeline transportation charge is determined by both unit transportation fee and distance. For simplicity, the distance between nodes is calculated by latitude and longitude, and the unit freight rate is regulated by National Development and Reform Commission in 2017. For examples, the unit freight rate of Sichuan-East Gas Transmission Line is 0.3894 RMB/1000 m3 km, and of Shaanxi-Beijing Line is 0.2857 RMB/1000 m3 km. In addition, the coastal LNG is transported according to the average transportation cost of CNPC, CNOOC and Sinopec pipelines.
The TP model is used to obtain the minimum transmission cost under existing gas supply and demand in 2017. And then, the MPEC model is carried out to obtain the minimum cost and maximum flow without supply and demand restrictions. In Table 1, the transmission cost of the former is reduced to about 80 × 108 m3/a, compared with the latter. It indicates that there is a transmission efficiency loss of 17.9% in the existing gas network. Moreover, the max flows optimized by the MEPC model is about 2914 × 108 m3/a, much larger than that by TP (2128 × 108 m3/a). These results show that existing gas network can provide entry and exit capacity of 2914 × 108 m3/a for gas traders, but it doesn’t happen. It implies that the allocation of entry and exit capacities depends on whether the gas physical network is optimally used through gas flows.
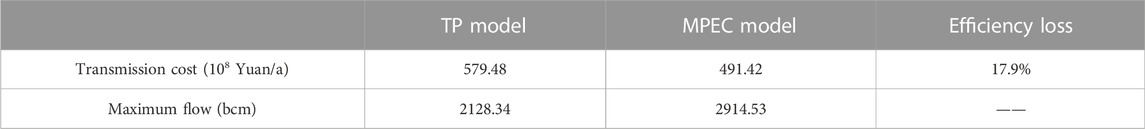
TABLE 1. Transmission efficiency of China’s natural gas network.
If the entry capacities obtained by MPEC and TP models are further deconstructed spatially as shown in Figure 2, we could observe that there are many nodes with vacant entry capacities. In particular, the entry capacities of LNG receiving stations along the coast of East China and South China have not been fully utilized, with the vacant capacity of about 21 bcm in South China and 38.5 bcm in East China, respectively. There is the insufficient LNG supplies in these two regions. Thereby, the shortage of gas supply in these two regions have to drive gas sources in Xinjiang and Sichuan Basin to be transported to these two areas over a long distance to make up for the shortage of LNG supply. The same reason is also applied to the vacant entry capacities of China-Myanmar pipeline and Daqing gas field. Therefore, the mismatch of capacities between the entry nodes and the exit nodes comes from the spatial insufficiency of gas supply. Moreover, MEPC model could be used to globally allocate these capacities, benefiting from the setting of virtual entry and extraction nodes in MCMF.
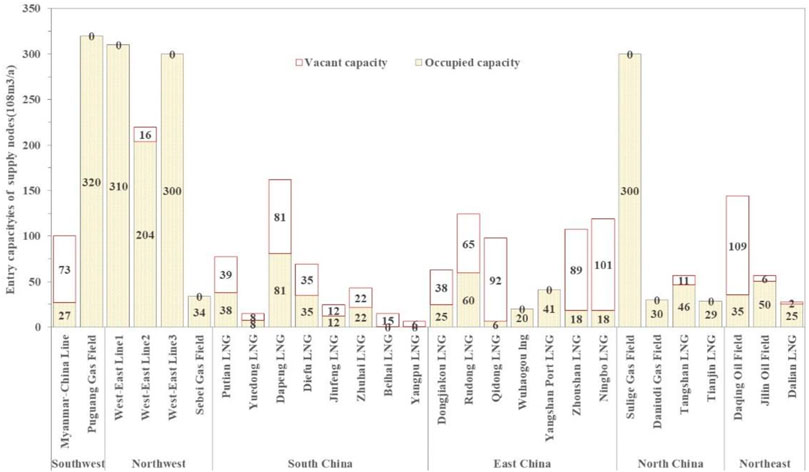
FIGURE 2. The occupied entry capacity obtained by TP model in existing gas network and the vacant capacity is the difference between the entry capacities obtained by MPEC and by TP.
The congestion degree of the pipeline and the nodal prices are obtained by TP model and MPEC model, respectively, as shown in Figure 3A, B. Comparing these two figures, we could get such an understanding that much more gas supply can improve spatially the reallocation of entry/exit capacities, leading to the pipeline capacities to be more optimally used with the lower nodal prices in Figure 3B. Concretely, the pipeline congestion degree obtained by MPEC model gradually decreases from west to east, compared with that obtained by TP model. However, the nodal prices show a concave distribution with high price in the middle and low price in the west and east. This is the capacities of entry nodes located at the southwest and east China to receive more natural gas, thus mitigating the pressure of long-distance transportation of natural gas in the west to supply the demands in the east.
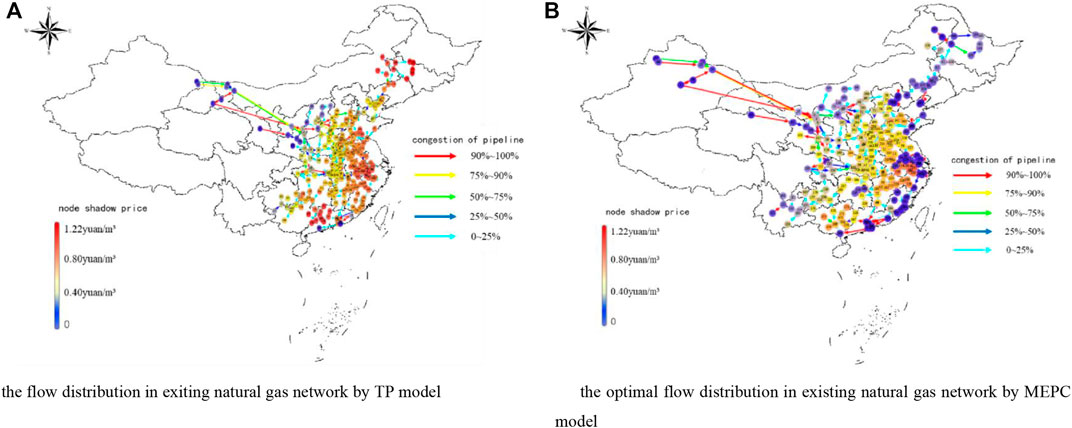
FIGURE 3. Spatial distribution of nodal prices and pipeline congestion in gas network (the pipeline congestion is expressed by the ratio of flow to capacity (A) the flow distribution in exiting natural gas network by TP model (B) the optimal flow distribution in existing natural gas network by MEPC model.
In addition, the MPEC model could be validated by the actual gas consumptions in 2017, 2018, and 2019 (BP, 2022). 212.8 bcm/a of natural gas could be transported by existing gas network, including PNG of 160.1 bcm and LNG of 537 bcm, as shown in Figure 2, which are close to the actual consumption 241.3 bcm in 2017. The optimal transportation capacity is 2911.4 bcm, which can cover the consumptions in 2018 and even 2019 with 283.9 bcm and 308.4 bcm, respectively.
In Figure 4A, The color of natural gas pipeline in northwest China is yellow, while that in central China, southeast China and south China is red. The color of the nodes in Figure 4A gradually changes from pale yellow to red and from the northwest to the southeast coast, except that the color of the gas supply node is blue. However, in Figure 4B, the color of nodes in central China, north China and south China is yellow, while the color of nodes in other regions is blue.
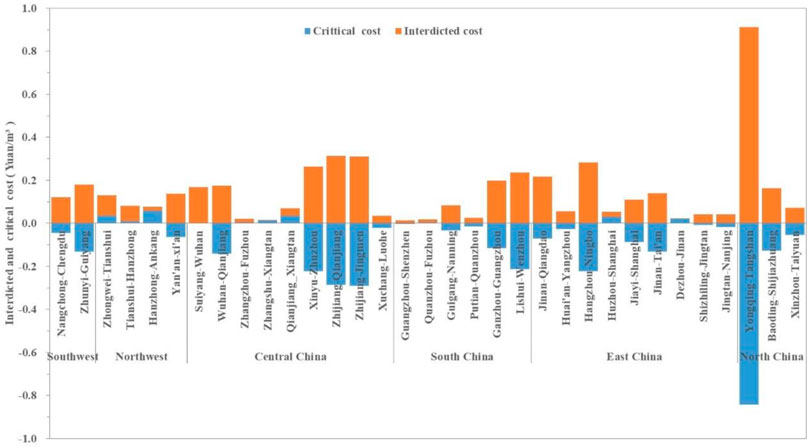
FIGURE 4. Spatial distribution of critical costs and interdicted costs of unoccupied gas pipelines.
We further investigate how the reallocation of entry and exit capacity affects the pipeline resources to be optimally used because the reallocation depends on whether gas physical network is optimally used, as stated in Section 3.2. It can also be asked that how the pipeline resources affect the spatial rebalancing of the entry and exit capacities. Therefore, we explore the mechanism of transmission efficiency loss from three aspects of network segmentation: the interdicted cost, the elasticity of pipeline capacity and the deployment of gas trunk lines in China’s natural gas market.
Looking back at the congestion degrees of pipelines and nodal prices in Figure 3A, there are 29 pipelines with their interdicted costs greater than zero under existing supplies and demands, as shown in Figure 4. It means that the gas flows through these pipelines are equal to zero, and the pipeline capacities is not occupied according to the complementary relationship between gas flows and the prices in eq. T-4.
It can be further observed that there are a few pipelines with critical cost greater than zero, which indicates that the transportation fee builds the cost barrier of gas flows through the pipelines. In addition, the critical cost of most pipelines is less than zero, that is, the regulated direction of gas flows through the pipeline produces the technical barrier of gas flow. Especially, the transportation channel between North China gas network with Northeast China gas network is interdicted by the regulated direction of Yongqing-Tangshan pipeline. Therefore, the interdicted cost hinders the fluidity of gas flows in the local network and then segments regionally the gas network, which potentially increasing the radius of gas supply chain to transport gas flows from Xingjiang, Erodes basin to gas network of Northeast China.
It is possible to decrease the interdicted cost of the above-mentioned 29 pipelines by reducing the transportation fee or reversing the direction of gas flows through pipelines for improving the transmission efficiency of exiting gas network. Therefore, among the 29 pipelines, the interdicted costs of pipelines in East China, North China and Southeast China are reduced respectively. Considering the segmentation between North China and Northeast China gas network from the Yongqing-Tangshan pipeline, it is necessary to independently observe the transmission efficiency by reversing its gas flow direction. The results are shown in Table 2.
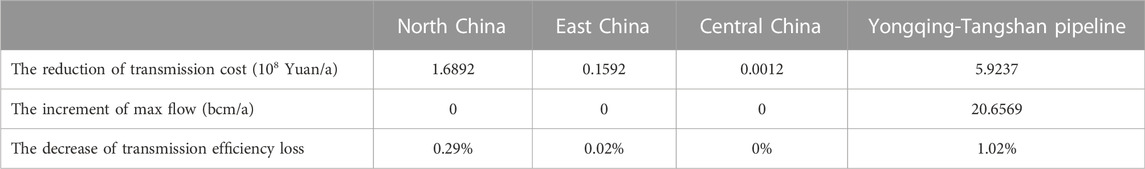
TABLE 2. Impacts of reducing interdicted cost on transmission cost, max flow, and transmission efficiency loss.
The results in Table 2 illustrate that the reduction of pipelines’ interdicted cost in North China, East China and Central China would heterogeneously affect the transmission cost and transmission efficiency loss of existing gas network. However, the maximum transmission capacity could be not affected, and the change would be close to 0. The reason is that these interdicted pipelines in these three regions only improve the transportation path of gas flow through the local gas network, but can’t cause the reallocation of entry and exit capacities.
Compared with the three regions, reversing the gas flow direction of Yongqing-Tangshan pipeline would not only increase the transportation capacity by 20.657 × 10⁸ m/a, but also reduce the transportation cost by 5.924 × 10⁸ yuan/a, resulting in a 1.02% reduction in transmission efficiency loss. This implies that once the channel barriers between gas network in North China and Northeast China are removed, natural gas from North China will flow to Northeast China through this key channel. At the same time, coastal LNG will supplement the natural gas demand in North China, East China and Central China. Although the nodal prices in Northeast China has increased by about 0.8 yuan/m3, compared with those before the gas flow direction change, the clearing prices of nodes in North China, Central China and Southeast China have decreased, as shown in Figure 2A and Figure 5. Therefore, the reversal of gas flow direction in this critical channel will cause the reallocation between the entry and exit capacities to move towards the optimization direction.
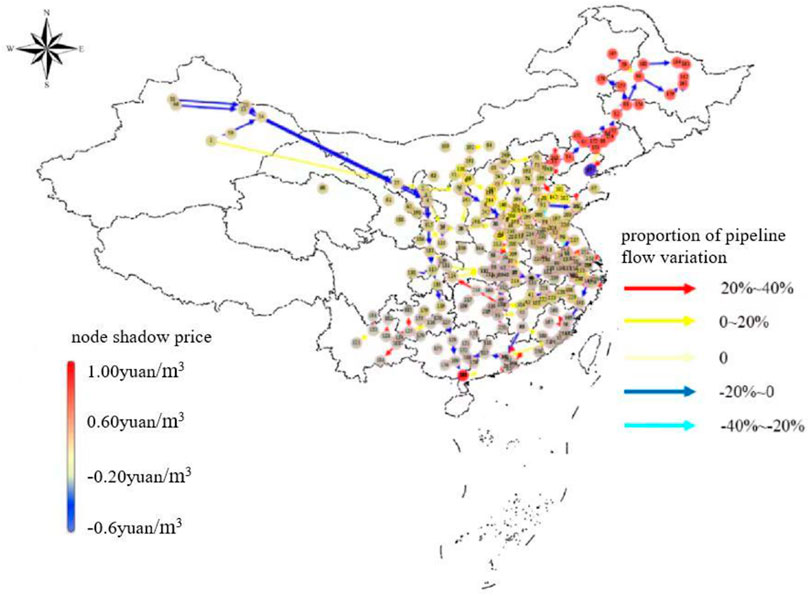
FIGURE 5. Nodal prices and flow distribution in gas network when reversing the gas flow direction through Yongqing-Tangshan pipeline.
There are 11 arcs congested by gas flows which obtained by MPEC model in exiting supply and demand. They are mainly located in Shaanxi-Beijing First line, Shaanxi-Beijing Second and Third lines, Yu-Ji line, and other eight branch lines, as shown in Fig. 6. One-unit capacity 1 × 10⁸ m3/a is added to these pipelines, respectively, to observe the changes of transmission efficiency and network maximum gas flow.
Once the capacities of these pipelines are expanded, the transportation cost will be correspondingly increased. In addition, the increase of the maximum gas flow is equal to the capacity expansion of Lunnan-Korla pipeline, Yulin-Taiyuan pipeline, Yulin-Shenchi pipeline and Puyang-Jinan pipeline respectively, as the dotted lines shown in Figure 6. It indicates that these four pipelines are still congested by gas flow, so they are still the bottleneck of gas network. However, for the residual seven pipelines, the increase of maximum gas flow is less than the increase of pipeline capacity, so these seven pipelines are no longer congested. Therefore, the expansion of pipeline capacity has certain elasticity, which will inevitably lead to the transmission efficiency loss.
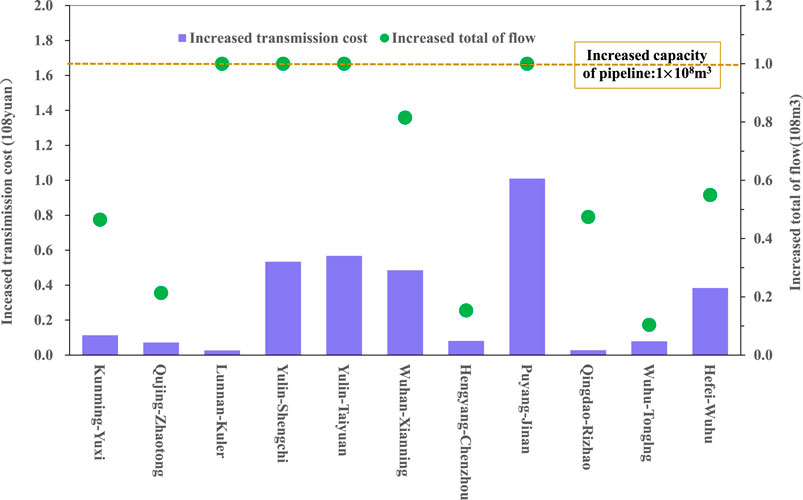
FIGURE 6. Impact of pipe capacity changes on the marginal cost and marginal flow of distribution network.
To measure the elasticity of pipeline capacity, we introduce the elasticity of “capacity-cost” by referring to price-demand elasticity in economics. The elasticity is expressed as
Four pipelines are selected for experiments and the elasticity curves of these four pipelines are obtained by simulation, as shown in Figure 7. It can be seen that the elastic curves of the four pipelines have different shapes. The curve of Puyang-Jinan pipeline is close to an “L" shape, that of Yulin-Taiyuan pipeline is close to an “S" shape. However, the curves of Yulin-Shenchi pipeline and Lunnan-Korla pipeline are close to a straight line. These different shapes imply that pipeline elasticity is spatially heterogeneous. In addition, we can observe that the elastic coefficient of Lunnan-Korla pipeline is much higher than that of the other three pipelines, while the coefficient of Puyang-Jinan pipeline is the smallest. The above two phenomena can be attributed to the fact that these two pipelines are located at different positions in gas network. Puyang-Jinan pipeline is located in the trunk of Yulin-Jinan line. There are many entry-exit nodes on this trunk line, and then the expansion of the capacity of Puyang-Jinan pipeline will reallocate increased gas flow among entry and exits nodes along this line. Thereby, the transportation cost by the expansion will be diluted. On the contrary, Lunnan-Korla pipeline is located on the West-East pipeline, and there are no more entry and exit nodes to dilute the transportation cost. Therefore, the location of the pipeline in gas network determines its’ elasticity, and then the transmission cost is robust to the expansion of the pipeline capacity of the trunk line, whereas it is rigid.
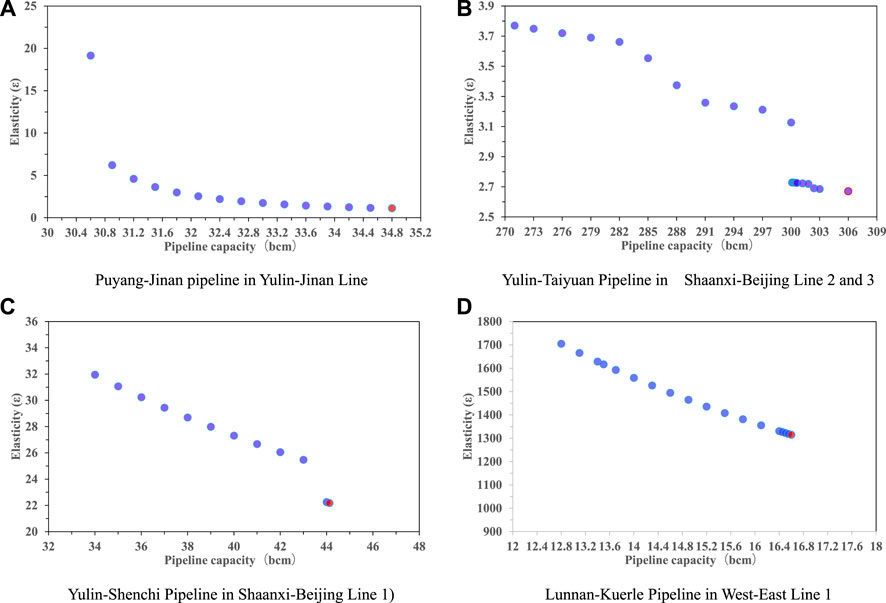
FIGURE 7. The heterogeneous elasticity of capacity-cost in China’s exiting gas network (A) Puyang-Jinan pipeline in Yulin-Jinan Line (B) Yulin-Taiyuan Pipeline in Shaanxi-Beijing Line 2 and 3 (C) Yulin-Shenchi Pipeline in Shaanxi-Beijing Line 1) (D) Lunnan-Kuerle Pipeline in West-East Line 1
Chinese government plans to build the China-Russia East Line and Sakhalin Line with the capacity of 380 × 108 m3/a, respectively. Moreover, Xinjiang- Guangdong-Zhejiang Line and Ordos-Anping-Cangzhou Line are planned to be built with the capacity of 300 × 108 m3/a. Their planned paths are shown in dotted lines in Appendix 1. Undoubtedly, these four trunk lines will expand the capacities of the two supply chains of Ordos Basin gas source and Russian imported natural gas. Therefore, we analyze the transmission efficiency of gas network in three scenarios, as follows:
1) Scenario Ⅰ: Xinjiang- Guangdong-Zhejiang Line and Ordos-Anping-Cangzhou Line are added to the existing gas network;
2) Scenario Ⅱ: China-Russia East Line and Sakhalin Line are added to the existing gas network;
3) Scenario Ⅲ: These four lines are added to the existing gas network, taking account into the requirement of China’s natural gas supply for gas network in 2030.
It could be found that the transmission efficiency losses in Scenario Ⅰ and Scenario Ⅱ are 21.51% and 24.84%, respectively. As shown in Table 3. Both of them are higher than 17.92% in MEPC model as seen in Table 1. Differently, the maximum flows in these two scenarios are only increases by 54.01 × 10⁸m3/a and 75.02 × 10⁸m3/a, compared with the result of MPEC model (see Table 1). Actually, the trunk lines to be built in these two scenarios only extend the gas supply chain radius of transporting gas flows from gas sources in Xingjiang, Erodes basin and imported gas from Russia to North China, East China and South China.
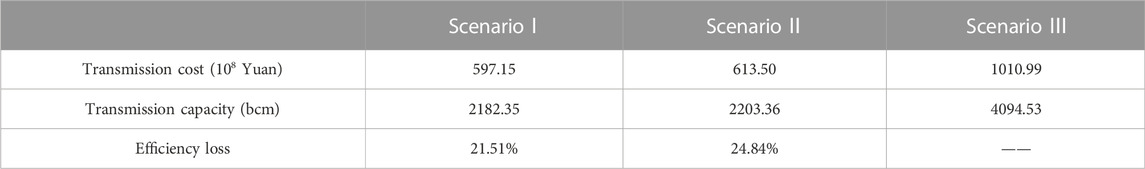
TABLE 3. The results of the three Scenario Ⅰ, Ⅱ, and Ⅲ
In Scenario Ⅰ, these two trunk lines to be built not only expand the entry capacities of gas sources from Xinjiang and Erodes basin, but also reduce the pressure of the supply chain of Xinjiang gas source on the gas supply in Southeast and South China. These two supply chains coordinate with each other and optimally reallocate entry and exit capacities, thus reducing the congestions and nodal prices, as shown in Figure 8A. Similarly, In ScenarioⅡ, natural gas imported from Russia also alleviates the gas supply pressure of the above two supply chains to Central, East and South China. Therefore, the congestion degrees and node prices in Scenario Ⅱ are lower than those in Scenario Ⅰ, as shown in Figure 8B.
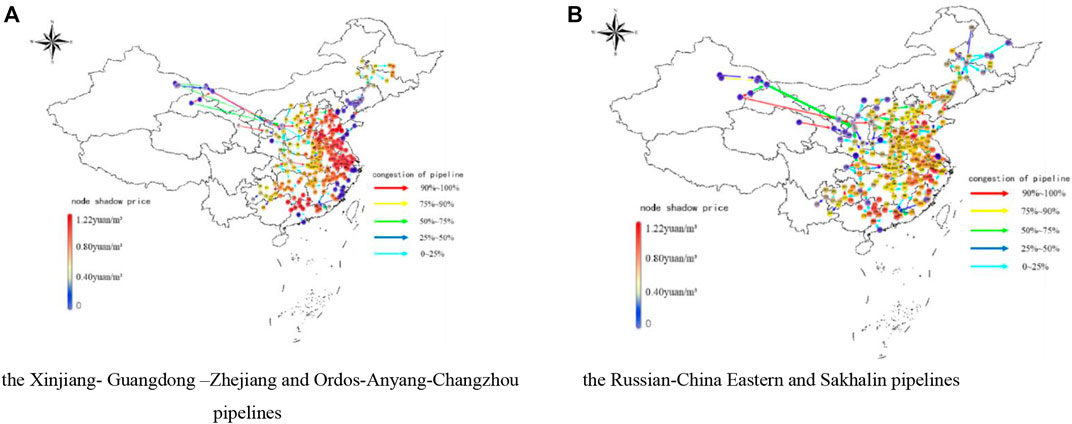
FIGURE 8. Distributions of nodal prices and pipeline congestions in scenario Ⅰ and Ⅱ (A) the Xinjiang- Guangdong–Zhejiang and Ordos-Anyang-Changzhou pipelines (B) the Russian-China Eastern and Sakhalin pipelines.
In Scenario Ⅲ, the maximum transportation capacity of China natural gas network will reach 4094.53 × 108 m3/a, although more transportation costs will have to be paid. That is to say, these four pipelines will greatly improve the spatial distribution of entry and exit capacities. It will also increase the fluidity of gas flows among the five gas supply chains, as shown in Appendix 2. Therefore, more gas supply chains will improve the spatial distribution of entry/exit capacity, thus reducing the gas supply shortage caused by the mismatch between entry and exit capacities.
The results need to be further discussed, even including the verification of the model in Section 3. Inspired by Acerbi et al. (2022), we triangulated this discussion from model, data, and information.
In MPEC, the transaction process of capacity (booking and nominating entry-exit capacity) is simplified, as well as technical constraints, such as gas pressure and compressibility which addressed by Hiller (2018) and Böttger et al. (2022). Thereby, our model is suitable for strategically evaluating the supports of existing physical network to commercial network, but not for real-time scheduling (hourly or daily) of entry-exit capacity. In addition, the spatial mismatch of deterministic entry-exit capacities is the focused of our model, rather than the capacities to be randomly booked in realistic and severe transport situations which were studied by Hiller (2018), Böttger et al., 2022 (2018) and Hennig and Schwarz (2016). From this point of view, we extended their research work.
The visualized results give three strategies of gas flow management: reducing the interdicted cost (reducing transportation cost and reversing gas flow direction), increasing the pipeline capacity and building new trans-regional pipelines. A high degree of physical gas market integration is of great importance to enhance competition under the Third-Access Party policy implemented recently in China. Therefore, the obtained gas flow data provides visual observation for TSO to improve gas flow andto decrease pipeline congestions for more gas market integration (Dieckhöner,et al., 2013). For example, the variation of natural gas flow direction and pipeline capacity can be realized practically by node pressure controls which normally optimized in technical and economic models (Wolf and Smeers, 2000; Rose et al., 2016).
Nodal prices are transmitted on gas network with gas flows. When pipeline congestion occurs, the congestion rent will be transmitted on the network along with nodal prices, and be recovered by TSO. Therefore, the nodal prices obtained by our model is similar to the nodal capacity price obtained by market auction (Vazquez and Hallack, 2013). This implies that the nodal price provides a reference for regionally pricing the entry/exit capacity. Moreover, congestion rents of pipelines could be fed back to the virtual origin and destination (as shown in Figure 1) to guide the total of entry/exit flows to be redistributed among all of entry and exit nodes. Hence, it implicitly suggests the sharing and distributing of nodal price signal is realized on the virtual origin and destination nodes, although our model design is more closely relate to UMMCF (Hennig and Schwarz, 2016; Hoppmann and Schwarz,2016).
In this paper, The MPEC model was established to evaluate the transmission efficiency and identified the critical factors of its loss. Some conclusions are made as follows.
The third-party access policy will drive the decoupling between gas trade and transport, leading to the transmission resources of the physical network cannot be optimally used to meet with the contractual arrangement between entry and exit capacities in commercial network. The MPEC model could integrate the allocation of commercial capacity and that of physical flows, based on a MCMF problem abstracted from existing gas network with only one virtual entry node and one virtual exit node. Moreover, this model cloud be used to spatially reallocate entry and exit capacities through the optimal scheduling of gas flow. It can reduce the transmission efficiency loss from the gap between commercial network and physical network, and delivers a feasible solution for the large-scale scheduling operation of natural gas network.
There is a transmission efficiency loss of 17.9% in China’s existing natural gas network and the loss mainly comes from the spatial mismatch between the entry and exit capacities caused by the shortage of natural gas supply in the South, East and Northeast China. However, the entry and exit capacities offered by TSO still depends on the optimal allocation of pipeline capacity. Specifically, the interdicted cost of pipeline, capacity-cost elasticity of pipeline and economic radius of gas supply chain to transport gas flows will produce the invisible segmentation of local networks, networks along trunk lines and regional networks, respectively. These invisible allocations will indeed extend the distance to transport gas, thus distorting the efficiency of pipeline capacity allocation. Thereby, the three segmentations are the critical factors of transmission efficiency loss in China’s natural gas network.
Some implications are given to improve the transmission efficiency.
Firstly, the allocation of entry-exit capacity should be dominated by TSO, not by traders. Otherwise, the contractual arrangement of entry-exit capacity will distort the allocation of pipeline capacity. China’s gas network could not be managed by absolutely copying the entry-exit regime in European natural market. The reason is that gas supply shortage and imperfect pipeline network layout will lead to supply security, which is the priority of TSO scheduling objectives.
Secondly, China government has formulated diversified import strategies to meet the market demand, but a large number of natural gas imports come from East Asian countries adjacent to Xinjiang. These imported natural gas are far away from the three high-demand areas of East China, South China and Northeast China. This means that China’s natural gas import should pay more attention to the LNG import volume of these two regions, so as to improve the mismatch between entry and exit capacities caused geographically by import gas shortage.
Thirdly, although China government promulgated the supervision and examination of pipeline transportation cost to regulate TSO’s abuse of market power, the transportation price may block gas flow in local network, resulting in local network segmentation. Therefore, a flexible transportation price system is needed for the fluidly of gas flow. Up to now, Chinese government has not issued regulations on pipeline capacity management. The spatial heterogeneity of pipeline capacity-cost elasticity is an important way to improve the transmission efficiency. But the detailed design is a challenge. In addition, it is necessary to complete the construction of planning pipeline as soon as possible to establish a multi-supply chain system, so as to improve the transmission efficiency.
The original contributions presented in the study are included in the article/supplementary material, further inquiries can be directed to the corresponding authors.
XW and XL conceptualized the idea of the study design and wrote the manuscript; XW, XZ, and XH designed the discussion. XW, XL, and XH revised the article; XW provided fund support. WZ and ZL collected the data and performed statistical analysis. All authors have read and agreed to the published version of the manuscript.
This research is financially supported by the National Natural Science Foundation of China (No. 71874166) and the Ministry of education of Humanities and Social Science project (No. 11YJC630211).
The authors appreciate the editors’ and reviewers’ help for improving the manuscript.
The authors declare that the research was conducted in the absence of any commercial or financial relationships that could be construed as a potential conflict of interest.
All claims expressed in this article are solely those of the authors and do not necessarily represent those of their affiliated organizations, or those of the publisher, the editors and the reviewers. Any product that may be evaluated in this article, or claim that may be made by its manufacturer, is not guaranteed or endorsed by the publisher.
The Supplementary Material for this article can be found online at: https://www.frontiersin.org/articles/10.3389/fenrg.2022.1029077/full#supplementary-material
Acerbi, F., Sassanelli, C., and Taisch, M. (2022). A conceptual data model promoting data driven circular manufacturing. Oper. Manag. Res. 15, 838–857. doi:10.1007/s12063-022-00271-x
Benda, D., Chu, X., Sun, S., Quek, T., and Buckley, A. (2019). Renewable energy sharing among base stations as a min-cost-max-flow optimization problem. IEEE Trans. Green Commun. Netw. 3 (1), 67–78. doi:10.1109/tgcn.2018.2876005
Bollobás, B. (1998). Modern graph theory. Springer Science & Business Media. Heidelberg, Germany, Vol. 184.
Böttger, T., Grimm, V., Kleinert, T., and Schmidt, M. (2022). The cost of decoupling trade and transport in the European entry-exit gas market with linear physics modeling. Eur. J. Operational Res. 297 (3), 1095–1111. doi:10.1016/j.ejor.2021.06.034
Boykov, Y., and Kolmogorov, V. (2004). An experimental comparison of min-cut/max-flow algorithms for energy minimization in vision. IEEE Trans. Pattern Anal. Mach. Intell. 26, 1124–1137. doi:10.1109/tpami.2004.60
BP (2022). Statistical Review of World Energy [EB/OL]. Available at: http://www.bp.com/statisticalreview.
Chen, L., Kyng, R., Liu, Y. P., Peng, R., Gutenberg, M. P., and Sachdeva, S. (2022). Maximum flow and minimum-cost flow in almost-linear time. https://arxiv.org/abs/2203.00671.
Cnooc, (2018). The yearbook of CNOOC. https://www.cnoocltd.com/col/col3881/index.html.
Cnpc, (2018). The yearbook of CNPC. http://www.cnpc.com.cn/cnpc/ndbg/201905/7e0bac0d766f4b43af8a29c86cc0a3d2/files/4f804543315143a28058814d5af95392.pdf.
Cremer, H., Gasmi, F., and Laffont, J. J. (2003). Access to pipelines in competitive gas markets. J. Regul. Econ. 24 (1), 5–33. doi:10.1023/a:1023943613605
Dieckhöner, Caroline, Lochner, Stefan, and Lindenberger, Dietmar (2013). European natural gas infrastructure: The impact of market developments on gas flows and physical market integration. Appl. Energy 102, 994–1003.
DNRC & NEA (2018). Notice on issuing opinions on accelerating the construction of gas storage facilities and perfecting the market mechanism of auxiliary services for gas storage and peak-shaving Regulation. https://www.ndrc.gov.cn/xxgk/zcfb/ghxwj/201905/t20190531_960966.html?code=&state=123.
DNRC (2019). Notice on the regulation measures for fair and open oil and gas pipeline network facilities. https://www.ndrc.gov.cn/xxgk/zcfb/ghxwj/201905/t20190531_960966.html?code=&state=123.
Dong, J., Sha, S., Li, X., Xu, J., Dai, W., and Duan, H. (2018). Ownership unbundling of natural gas transmission networks in China. J. Clean. Prod. 195, 145–153. doi:10.1016/j.jclepro.2018.05.173
Egging, R., Gabriel, S. A., Holz, F., and Zhuang, J. (2008). A complementarity model for the European natural gas market. Energy policy 36 (7), 2385–2414. doi:10.1016/j.enpol.2008.01.044
Gabriel, S. A., Zhuang, J., and Kiet, S. (2005). A large-scale linear complementarity model of the North American natural gas market. Energy Econ. 27 (4), 639–665. doi:10.1016/j.eneco.2005.03.007
Gabriel, S., and Smeers, Y. (2006). Complementarity problems in restructured natural gas markets. Recent Adv. Optim., 343–373.
Gillessen, B., Heinrichs, H., Hake, J. F., and Allelein, H. J. (2019). Natural gas as a bridge to sustainability: Infrastructure expansion regarding energy security and system transition. Appl. Energy 251, 113377.
Golombek, R., Gjelsvik, E., and Rosendahl, K. E. (1995). Effects of liberalizing the natural gas markets in Western Europe. Energy J. 16 (1). doi:10.5547/issn0195-6574-ej-vol16-no1-6
Hallack, M., and Vazquez, M. (2013). European Union regulation of gas transmission services: Challenges in the allocation of network resources through entry/exit schemes. Util. Policy 25, 23–32. doi:10.1016/j.jup.2013.01.003
Hennig, K., and Schwarz, R. (2016). Using bilevel optimization to find severe transport situations in gas transmission networks. ZIB-Report, 16–68.
Hiller, B., Koch, T., Schewe, L., Schwarz, R., and Schweiger, J. (2018). A system to evaluate gas network capacities: Concepts and implementation. Eur. J. Operational Res. 270 (3), 797–808. doi:10.1016/j.ejor.2018.02.035
Holz, F., Von Hirschhausen, C., and Kemfert, C. (2008). A strategic model of European gas supply (GASMOD). Energy Econ. 30 (3), 766–788. doi:10.1016/j.eneco.2007.01.018
Hoppmann, K., and Schwarz, R. (2018). “Finding maximum minimum cost flows to evaluate gas network capacities,” in Operations research proceedings 2017 (Heidelberg, Germany: Springer), 339–345.
Huang, H., Ouyang, L., and Liu, T. (2006). Upper bounds of efficiency loss for user equilibrium behavior in traffic networks. J. Beijing Univ. Aeronautics Astronautics 32 (10), 1215.
Keyaerts, N., Hallack, M., Glachant, J. M., and D’haeseleer, W. (2011). Gas market distorting effects of imbalanced gas balancing rules: Inefficient regulation of pipeline flexibility. Energy Policy 39 (2), 865–876. doi:10.1016/j.enpol.2010.11.006
Koch, T., Hiller, B., Pfetsch, M. E., and Schewe, L. (2015). Evaluating gas network capacities. Society for Industrial and Applied Mathematics. Philadelphia, PA, USA
Lindsey, R., De Palma, A., and Silva, H. E. (2019). Equilibrium in a dynamic model of congestion with large and small users. Transp. Res. Part B Methodol. 124, 82–107. doi:10.1016/j.trb.2019.04.005
Moolman, W. (2020). The maximum flow and minimum cost–maximum flow problems: Computing and applications. Asian J. Probab. Statistics, 28–57. doi:10.9734/ajpas/2020/v7i330185
Ogden, J., Jaffe, A. M., Scheitrum, D., McDonald, Z., and Miller, M. (2018). Natural gas as a bridge to hydrogen transportation fuel: Insights from the literature. Energy Policy 115, 317–329.
Patriksson, M., and Rockafellar, R. T. (2002). A mathematical model and descent algorithm for bilevel traffic management. Transp. Sci. 36 (3), 271–291. doi:10.1287/trsc.36.3.271.7826
Qin, Y., Tong, F., Yang, G., and Mauzerall, D. L. (2018). Challenges of using natural gas as a carbon mitigation option in China. Energy Policy 117, 457–462.
Richard, P., O'Neill, R. P., Williard, M., Wilkins, B., and Pike, R. (1979). A mathematical programming model for allocation of natural gas. Operations Res. 27 (5), 857–873. doi:10.1287/opre.27.5.857
Rose, D., Schmidt, M., Steinbach, M. C., and Willert, B. M. (2016). Computational optimization of gas compressor stations: MINLP models versus continuous reformulations. Math. Methods Oper. Res. (Heidelb). 83 (3), 409–444. doi:10.1007/s00186-016-0533-5
Roughgarden, T., and Tardos, É. (2002). How bad is selfish routing? J. ACM (JACM) 49 (2), 236–259. doi:10.1145/506147.506153
Russel, R. S., and Taylor, B. W. (1998). Operations management: Focusing on quality and competitiveness. Prentice-Hall. Hoboken, NJ, USA,
Sinopec, (2018). The yearbook of Sinopec. http://www.sinopecgroup.com/group/xxgk/jtnb/20210914/news_20210914_406264092787.shtml.
Smith, J. C., and Song, Y. (2020). A survey of network interdiction models and algorithms. Eur. J. Operational Res. 283 (3), 797–811. doi:10.1016/j.ejor.2019.06.024
Wang, J. H., and Cheng, X. J. (2017). Network bottleneck, strategic behaviorbehaviour and pipeline open fair A research based on the oil and gas industry. China Ind. Econ. 1, 117.
Wang, X., Qiu, Y., Chen, J., and Hu, X. (2022). Evaluating natural gas supply security in China: An exhaustible resource market equilibrium model. Resour. Policy 76, 102562. doi:10.1016/j.resourpol.2022.102562
Wolf, D., and Smeers, Y. (2000). The gas transmission problem solved by an extension of the simplex algorithm. Manag. Sci. 46 (11), 1454–1465. doi:10.1287/mnsc.46.11.1454.12087
Wood, R. K. (1993). Deterministic network interdiction. Math. Comput. Model. 17 (2), 1–18. doi:10.1016/0895-7177(93)90236-r
Xie, F., Jia, Y., and Jia, R. (2012). Algorithm for minimum cost maximum flow in transportation network. J. Converg. Inf. Technol. 7 (7), 165–173. doi:10.4156/jcit.vol7.issue7.21
Xu, J., Hallack, M., and Vazquez, M. (2017). Applying a third party access model for China’s gas pipeline network: An independent pipeline operator and congestion rent transfer. J. Regul. Econ. 51 (1), 72–97. doi:10.1007/s11149-017-9316-z
Keywords: natural gas network, transmission efficiency loss, minimum cost maximum flow problem, mathematical program with equilibrium constraints, market segmentation
Citation: Wang X, Lu X, Zhang X, Zeng W, Liu Z and Hu X (2023) Identifying the critical factors of transmission efficiency loss in China’s natural gas network. Front. Energy Res. 10:1029077. doi: 10.3389/fenrg.2022.1029077
Received: 26 August 2022; Accepted: 05 December 2022;
Published: 24 January 2023.
Edited by:
Massimo Gastaldi, University of L'Aquila, ItalyReviewed by:
Idiano D'Adamo, Sapienza University of Rome, ItalyCopyright © 2023 Wang, Lu, Zhang, Zeng, Liu and Hu. This is an open-access article distributed under the terms of the Creative Commons Attribution License (CC BY). The use, distribution or reproduction in other forums is permitted, provided the original author(s) and the copyright owner(s) are credited and that the original publication in this journal is cited, in accordance with accepted academic practice. No use, distribution or reproduction is permitted which does not comply with these terms.
*Correspondence: Xianfeng Zhang, dG9ieXpoYW5nQDE2My5jb20=; Xiangping Hu, WGlhbmdwaW5nLkh1QG50bnUubm8=
†These authors share first authorship
Disclaimer: All claims expressed in this article are solely those of the authors and do not necessarily represent those of their affiliated organizations, or those of the publisher, the editors and the reviewers. Any product that may be evaluated in this article or claim that may be made by its manufacturer is not guaranteed or endorsed by the publisher.
Research integrity at Frontiers
Learn more about the work of our research integrity team to safeguard the quality of each article we publish.