 Junhua Hu1
 Bingyan Guo
 Yunfeng Yan
- 1State Grid Zhejiang Electric Power Co., Ltd., Hang Zhou, China
- 2Zhejiang University, Hang Zhou, China
- 3State Grid Zhejiang Electric Power Company Electric Power Research Institute, Hang Zhou, China
Aiming at the problems of diversification, complexity and islanding of power operation and inspection data and the high dependence of operation and inspection operations on expert experience and normative information, the key technology research of intelligent judgment of defect types of power operation inspection equipment is carried out. For the field of power operation and inspection, the defect text classification algorithm based on graph convolutional neural network is proposed. And the practical tests in a large defect text network diagram built by main transformer defect reports are performed. And the proposed model achieves better classification results than 7 benchmark models in the defect text classification task. Specifically, the Accuracy, Weighed-Precision, and Weighed-F1 indicators reach 73.39, 72.42, and 72.21 respectively, which improves the model’s ability to identify defect types to a greater extent and plays an important role in improving the intelligence and digitalization of power operation and inspection work.
1 Introduction
Power operation and inspection is mainly responsible for operation, maintenance and repair of substations and transmission equipment as well as transformation and replacement, which generates a large number of different types of data every year, such as structured data like outage record lists, semi-structured data like defect reports and unstructured data like operation procedures (Zhuang et al., 2020). Due to the diversification, complexity and islanding of data in the field of power operation and inspection, it is time-consuming for inspection workers to find information, and the operation and inspection work relies more on expert experience. Therefore, it is of great significance to enhance the digitalization and intelligence of substation operation and inspection work (Li and Zhao, 2020).
When the operation and inspection personnel find equipment abnormalities, they are required to fill out a defect report according to the work specification, describing the actual situation of the defect and summarizing the defect type. Although the operation and inspection department has a detailed defect categorization guidelines document, but many field operation and inspection personnel have not seen or are not clear about the content of the guidelines document, so it often happens that the defect type and defect description does not correspond to the situation, which has a great impact on the subsequent expert maintenance and after the power data collation and standardization. Therefore, according to the description of the defect by the operation and inspection staff, the intelligent auxiliary system can automatically fill in the defect type or give the confidence of the defect type, which has an important role in the actual operation and inspection production (Li et al., 2022).
Nowadays, text classification is mainly divided into two types of methods: machine learning and deep learning. In the context of big data era, deep learning has the advantages of automatic feature extraction and higher accuracy than machine learning (Hu et al., 2019), and is a hot spot and focus of research.
In recent years, many text classification algorithms have been proposed. Kim proposes the TextCNN algorithm (Li et al., 2020), which uses convolutional neural networks trained on word vectors to achieve the text classification task; Lai et al. propose the TextRCNN algorithm (Liang, 2020), which introduces recurrent convolutional neural networks for text classification, using a recurrent structure to capture as much contextual key information as possible; Liu et al. propose the TextRNN algorithm (Wan et al., 2022), which improves text classification accuracy; Zhou et al. propose the Attention-BLSTM algorithm (Zhou et al., 2016), which improves the performance of classification tasks by automatically capturing important semantic information in text using an attention-based bidirectional long and short-term memory network. Joulin et al. propose the FastText algorithm (Wu et al., 2020), which improves model training and evaluation speed by multiple orders of magnitude without losing classification accuracy; Johnson et al. propose the DPCNN algorithm (Johnson and Zhang, 2017), which can effectively represent long associative semantic information in text by increasing the depth of the convolutional network, and improves classification accuracy with little additional computational cost. Devlin et al. propose the bert algorithm (Devlin et al., 2018), which introduces a novel bidirectional transformer (Shen, 2022) to encode the representation of language models and fine-tunes the pre-trained model with only one additional output layer, and obtains optimal results in 11 NLP tasks such as text classification.
In this work, a classification model of power operation inspection defect texts based on graph convolutional neural network (POIDT-GCNN) is proposed for power operation and inspection defect text, and the model is trained in a large defect text network graph built to achieve a better classification accuracy.
2 Model algorithms
2.1 Graph convolutional neural network
Graph Convolutional Neural Networks (GCNN) is a multilayer neural network trained in graph data, and the output is a node feature vector with neighborhood attributes. In previous work, both image data or text data processed by word embedding are with regular spatial structure, and they all conform to the translation invariance of convolution theorem, which makes the convolution structure effective for feature extraction. In fact, many data are non-Euclidean structured data, which include graph structured data, such as literature mutual citation data, knowledge graph data, etc. Even text can actually be constructed into complex graph structures, such as syntactic dependency trees, mutual information among words, etc. However, the convolutional structure of convolutional neural networks cannot maintain translation invariance on graph-structured data because each vertex in these data has a different number of neighboring vertices. When processing text data, text is directly input to the model as a sequence, but in fact, natural language is closer to a tree-like graph format, such as word co-occurrence, syntactic dependency trees, etc., which can better reflect the association relationship between words (Tong, 2021). So, GCNN has more advantages when processing text. The core problem of using GCNN to solve text classification task is to transform the text vocabulary sorted by sequence into the form of graph structure.
In general, define the graph G = (V,E), where V(|V| = n) is the set of nodes and E is the set of edges. Assume that each node is connected to itself, i.e., for any node v there is (v,v)∈E. Denote X∈Rn×m as the feature matrix of n nodea, where, m is the dimension of the feature vector, and each row Xv∈Rm is the feature vector of the node v; A is the adjacency matrix of the graph G, because the nodes are self-connected, and the diagonal in A is set to 1; D is the degree matrix of the graph G, where,
In GCNN, one layer of graph convolution can only capture the information of directly connected nodes, while stacking multiple layers together can capture more information of neighboring points. For a one-layer graph convolutional network, the k-dimensional node feature matrix L(1)∈Rn×k is calculated as:
where
where j is the number of graph convolution layers, when j = 0, L(0) = X.
2.2 Defect text classification algorithm based on graph convolutional neural network
Since the graph convolutional neural network is trained in graph data, and in order to make full use of the global word co-occurrence information of the defect text, a large defect text net graph is built, as shown in Figure 1. In the defect text net graph, the number of nodes |V| is the sum of the number of defect texts (corpus size) and the number of feature words.
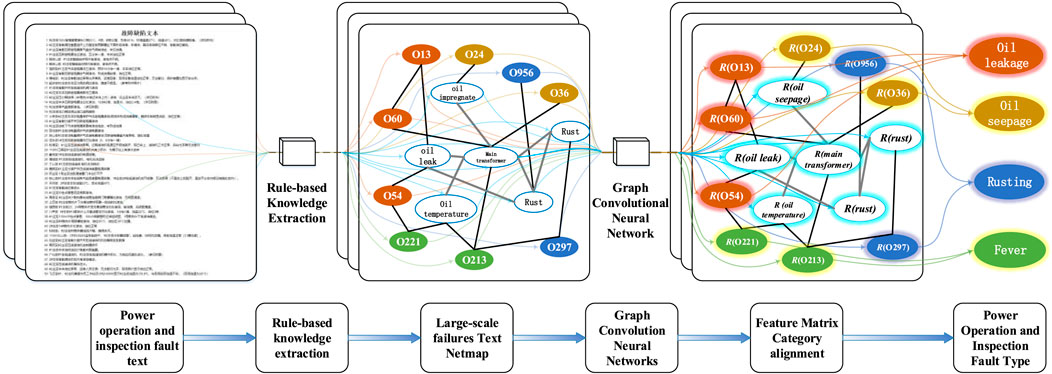
FIGURE 1. Block diagram of defect text classification algorithm based on graph convolutional neural network.
The initial feature matrix X is defined as the unit matrix I, i.e., the unique heat vector is used to represent each feature word and the defect text, and it is fed into the graph convolutional network.
Based on the word frequency statistics and word co-occurrence information, undirected edges are constructed between defect text and defect text, defect text and feature words, and feature words and feature word nodes, respectively. The edge weight between the defect text and the defect text is the text similarity calculated by the TextRank (Li, 2021) algorithm with the following formula:
where i and j are two defect texts and w is a word that appears in both defect texts at the same time. The edge weight between the defect text and the feature word is the term frequency-inverse document frequency (TF-IDF) of the feature word in the defect text (Yu and Salton, 1976; Amati and Rijsbergen, 2002), where the term frequency is the frequency of the feature word in the defect text, and the inverted document frequency is obtained by taking the quotient of the total is obtained by taking the logarithm of the quotient of the total number of defect texts and the number of defect texts containing the feature word, and the specific formula is as follows:
where i is the feature word, j is the defect text, nij is the number of occurrences of feature word i in defect text j, |D| is the total number of defect texts, and a is the traversed defect text. To utilize the global co-occurrence information, co-occurrence statistics are collected in the defect text corpus using a fixed-size sliding window, and then the point-wise mutual information (PMI) method (Liu, 2005) is used to calculate the edge weights between feature words and feature words, i.e., to measure the association between two feature words, with the following formula:
where, i and j are two feature words, Nsw(i) is the number of sliding windows containing feature word i in the corpus, Nsw(i,j) is the number of sliding windows containing both feature words, and Nsw is the total number of sliding windows in the corpus.
If PMI>0, it means that there is a high degree of correlation between the two feature words; if PMI<0, it means that there is little or even no correlation between the two feature words. Therefore, in this paper, we only build undirected edges for the two feature words of PMI>0. According to the above analysis, the edge weights between node i and node j can be obtained:
After constructing the defect text net graph, the net graph is fed into a bilayer graph convolutional neural network (Wang, 2022), where the number of nodes in the second layer is the number of defect classes and the activation function is a softmax classifier:
where
In the training process, the W0 and W1 weight matrices are optimized using the gradient descent method (Lan et al., 2017), and the loss function is the cross-entropy loss function:
where
The two-layer graph convolutional neural network allows information to be passed twice between the nodes, and therefore is able to capture feature information from more neighbors and increase the semantic interpretation of the defect text, thus improving the sparsity and informality of the defect text and improving the recognition of defect types (Yuan, 2020).
3 Experiment and analysis
3.1 Data collection and organization
In order to verify the classification effect of proposed POIDT-GCNN model on actual power operation inspection defect texts, a total of 3,147 power operation inspection defect reports from 2016 to 2021 are collected. By sorting and classification, 3,147 defect texts and 9 corresponding defect types are obtained as shown in Table 1. From the collated data set, it is found that the maximum length of defect text strings is 216 and the average length is only 33.2, which is characterized by short length and high sparsity and belonged to short text type. In addition, a simple browsing through the defect text shows that there are many typos and verbal (informal) language, which need to be precleaned by text cleaning as well as removing deactivated words.
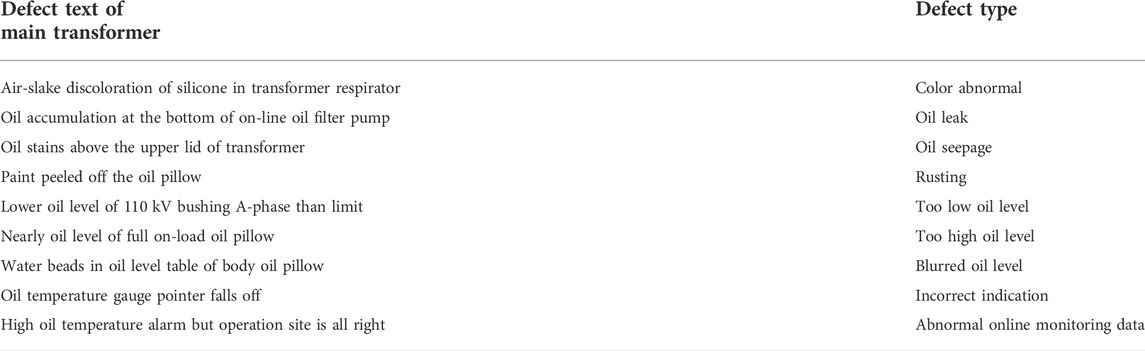
TABLE 1. Examples of power operation inspection defect text and defect type.
Since there are many special words in the electrical field, such as “ground”, “pull”, “oil seepage”, etc., it is almost impossible for general-purpose natural language processing (NLP) tools to classify and annotate the electrical. In this experiment, we need to obtain the corresponding vocabulary in the defect text, i.e., we need to separate the defect text into words. Therefore, this paper uses the construction of a dedicated electrical vocabulary through manual annotation to expand the corpus of NLP tools, so as to achieve accurate word separation of defect texts.
After the pre-processing of knowledge extraction such as word segmentation cleaning and removal of stop words, the corresponding set consisting of words with important key information in the defect text can be obtained, that is, the defect text can be simplified into a string of feature words. The specific example is shown in Figure 2.

FIGURE 2. Example of rule-based defect text knowledge extraction.
3.2 Environment construction
3.2.1 NLP toolkit
There are many excellent NLP toolkits in the open source community, such as Natural Language Toolkit (NLTK) for teaching, CoreNLP developed by Stanford University, Language Technology Platform (LTP) developed by HIT, Han Language Processing (HanLP) and so on. Among them, HanLP has the advantages of high speed, many functions, high accuracy and low memory consumption, and its number of Stars on Github is much higher than the mainstream NLP toolkits such as NLTK, CoreNLP and LTP, and has a strong community activity, so HanLP is chosen as the NLP toolkit here.
3.2 2 Deep learning framework
The common deep learning frameworks include PyTorch, TensorFlow, Theano, Keras, etc. Among them, PyTorch has the advantages of simple packaging, fast running speed, flexible and easy-to-use interface, and provides a complete documentation guide and an active community, which enables users to easily build algorithmic frameworks, so it is being favored by more and more researchers. PyTorch is chosen as the deep learning framework for this experiment.
3.2.3 GPU
Since convolution involves a lot of parallel operations, using GPU can improve the model running efficiency and shorten the experiment period, so the mainstream Nvidia graphics card RTX3090 was chosen for this experiment.
3.2.4 Parameter setting
During the experiment, the random initial feature dimension of the node is 300; the PMI sliding window size is 15; and the learning rate is 0.085. Besides, 10% of the defect text dataset is randomly selected as the test set, and Adam is chosen as the training optimizer with a training period of 150.
3.3 Evaluation index
Based on the collected and collated data, it is known that there are 9 types of defects, so this experiment is a multiclassification task. Three metrics,
where,
For any class c∈C in the category C set, define True Positives (TPc) as the number of samples correctly assigned to that class (i.e., the number of correct predictions), False Positives (TPc) as the number of samples incorrectly assigned to that class, and False Negatives (FNc) as the number of samples incorrectly assigned to other classes when they should have been assigned to that class. Note that:
The weighted index takes into account the uneven number of sample categories and takes the weighted average of “Precision value”, “Recall value” and F1 values. The specific formula is as follows:
Where,
3.4 Experimental results
3.4.1 Defect text network diagram
According to the description in Section 3.2, a large defect text network diagram is built and imported into the Gephi diagram database for visual analysis, as shown in Figure 3, where “testx” refers to the defect text. It can be seen from the figure that the key information such as feature words are closely connected with other nodes and gathered in the middle part, such as “main change”, “oil level”, etc.; the general information such as defect text is less connected with other nodes and scattered around.
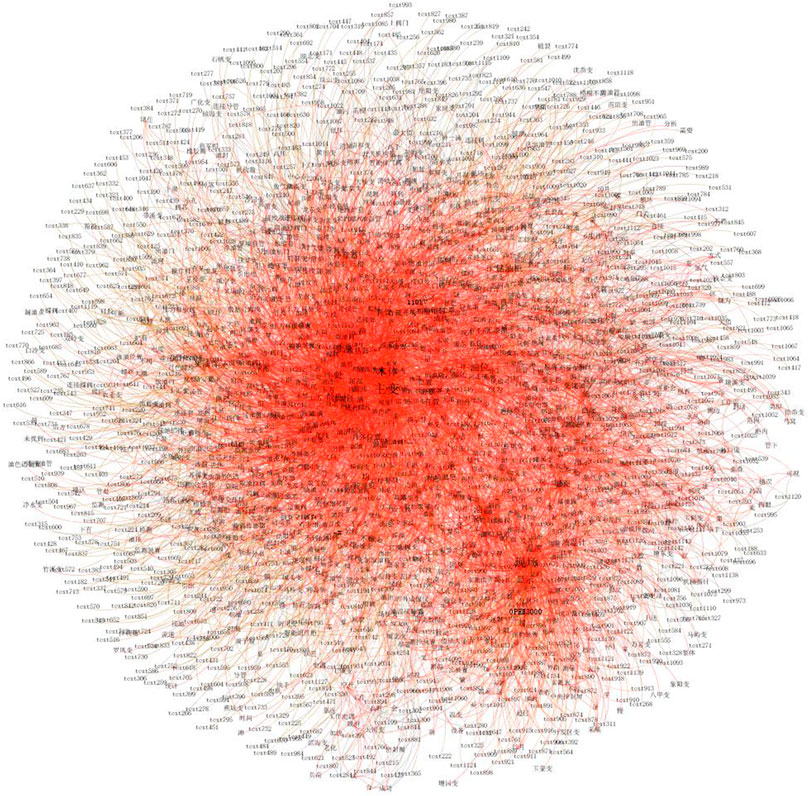
FIGURE 3. Large-scale defect text network diagram.
3.4.2 Algorithm evaluation
To test the effectiveness of POIDT-GCNN models, seven benchmark models are used for comparison in this paper: TextCNN (Li et al., 2020), TextRCNN (Liang, 2020), TextRNN (Wan et al., 2022), Attention-BLSTM (Zhou et al., 2016), FastText (Wu et al., 2020), DPCNN (Johnson and Zhang, 2017), and Bert (Devlin et al., 2018). The classification results of each model are shown in Table 2.
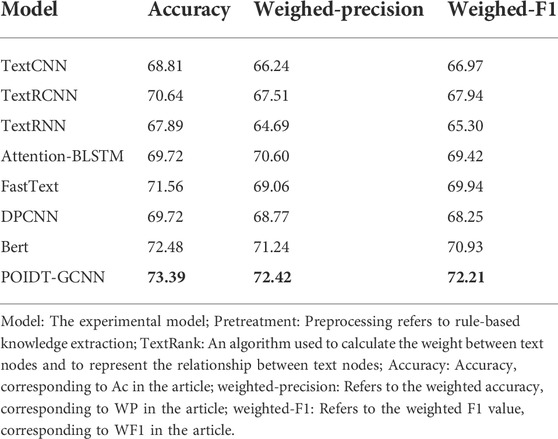
TABLE 2. Performance comparison of defect text classification models.
The POIDT-GCNN model achieves better classification results than the seven benchmark models in the defect text classification task, and the Accuracy, Weighed-Precision, and Weighed-F1 metrics all reach their maximum values. In addition, it can be seen from the table that the evaluation indexes of the long and short-term memory network models are all slightly higher than those of the convolutional neural network model, which is because the long and short-term memory network model can effectively remember the pre and post text information and improve the recognition of defect text to a certain extent, while the POIDT-GCNN model captures more neighboring point feature information through the two-layer graph network structure to increase the semantic parsing of the text and to a greater extent improve the model’s ability to recognize defect types.
3.4.3 Classification visualization
Using the t-SNE nonlinear dimensionality reduction algorithm, the defect text high-dimensional feature vectors output from the TextRCNN, FastText, Bert, and POIDT-GCNN models are reduced to two dimensions and labeled in the coordinate system to obtain the visualized defect text classification results, as shown in Figure 4.
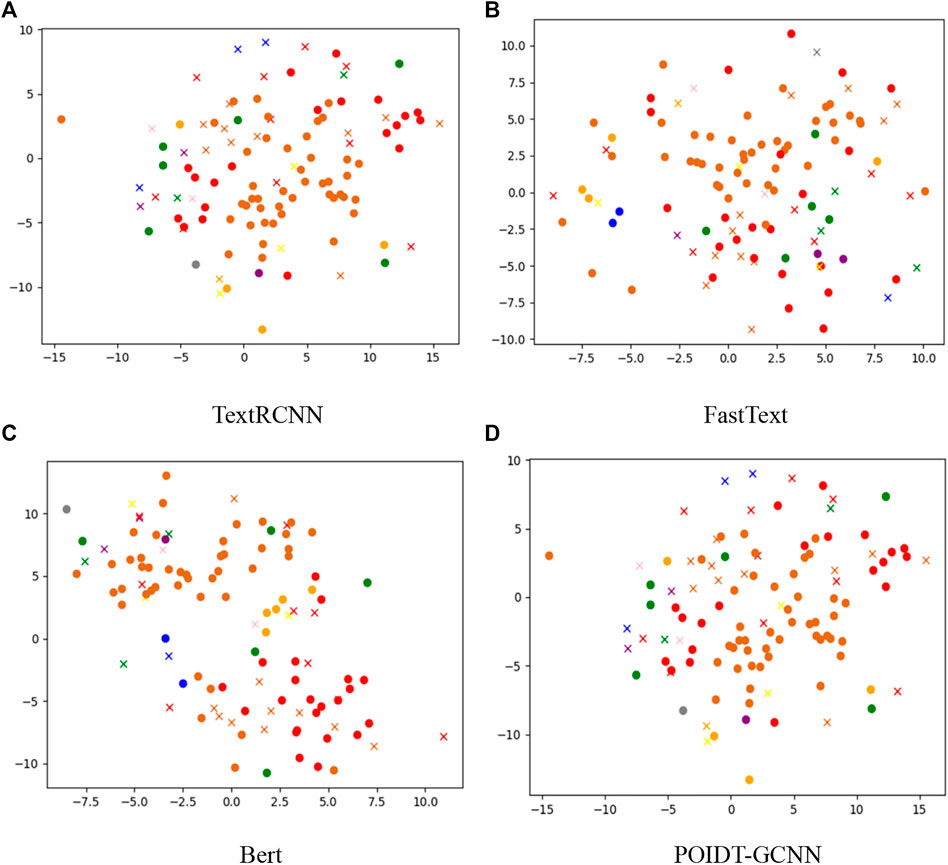
FIGURE 4. Defect text classification visualization.
According to the output visualization results of TextRCNN and FastText models, it can be seen that various types of defect text feature points are mixed together, and the classification effect is not ideal; in Bert model, similar feature points have a tendency to be clustered, but it is not obvious, and various types of feature points are still mixed together; compared with the above models, the defect text feature points output by POIDT-GCNN model have a more obvious clustering effect and a clearer classification boundary, which also verifies the classification performance of the model from the side.
3.4.4 Ablation experiments
The POIDT-GCNN model is an expanded version on the basis of TextGCN according to the text characteristics of defects in power operation inspection. Therefore, this work mainly conducts ablation experiments on the two extended parts. The model structure comparison is shown in Figure 5, and the experimental results are shown in Table 3. Specifically, the “Pretreatment” refers to the rule-based knowledge extraction. While the TextRank refers to the algorithm used to calculate the edge weights between the defective texts. When the model does not include the “Pretreatment” and “TextRank”, the POIDT-GCNN model can be regarded as the TextGCN algorithm. According to the experimental results in Table 3, it can be seen that the POIDT-GCNN model including the “Pretreatment” and “TextRank” achieves the better classification effect. While the model with the Pretreatment alone has the worst classification effect, because the Pretreatment deletes a large amount of the unimportant text while keeping only the key words (shown in Figure 2). In the absence of TextRank connecting defective text nodes, the defective text network graph loses a large number of transmission paths of different text feature information, which weakens the semantic understanding of defective text. When the model only contains TextRank, the model can capture the text feature information from more transmission paths and enhance the semantic discrimination due to the supplementary defective text node connections, and thus the classification effect is improved compared with TextGCN algorithm. However, too much unimportant information also introduces large noise, which limits the semantic understanding of the model. Therefore, the POIDT-GCNN model in this work contains the Pretreatment to extract the key information, which can alleviate the interference from the noise to the model, so as to further improve the classification effect and enhance the recognition ability of the model to the defect type.
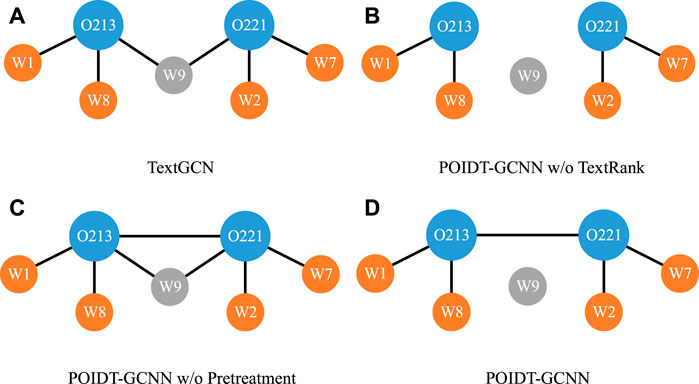
FIGURE 5. Model structure of ablation experimental.
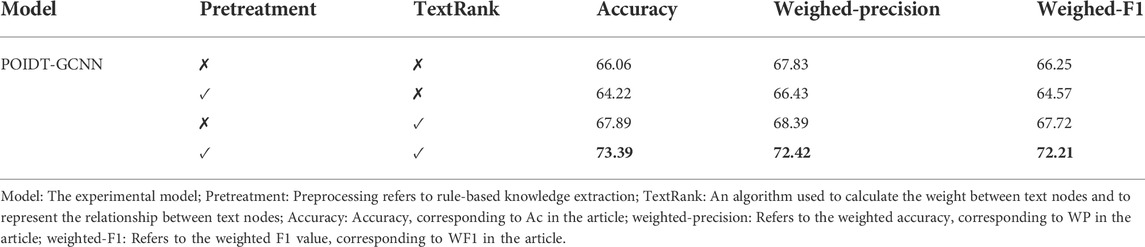
TABLE 3. Performance comparison of ablation experimental models.
4 Conclusion
This work carries out research on the key technology of intelligent determination of defect types in power operation and inspection, and proposes a GCNN-based text classification algorithm for power operation and inspection defects. Besides, the practical tests in a large defect text network diagram built by electricity inspection defect reports are conducted. Compared with the benchmark model, the proposed model achieves the best classification results, with Accuracy, Weighed-Precision, and Weighed-F1 indicators reaching 73.39, 72.42, and 72.21 respectively. In practical application, the algorithm proposed in this paper can intelligently assist in filling in the defect types automatically according to the description of defects by operation and inspection staff, which is important for improving the intelligence and digitalization of power operation and inspection production.
5 Perspectives
How to deal with these power operation inspection defect texts and extract more valuable information is of high practical significance. Although this paper has improved the text classification effect to a certain extent, there are still many areas that need to be improved and optimized, and further research will be conducted in the following aspects in future work:
1) Whether there is a better way to construct a text graph to better represent the word-word and word-document relationships and thus improve the classification effect by constructing a text adjacency matrix A as the input of the network model will be the focus of the next research.
2) For the memory overhead problem of large text classification. As the size of text data increases, the demand for hardware gradually increases, and it is worth considering how to reduce memory consumption, allocate system resources rationally, and reduce computing costs.
3) The problem of training speed for text classification. The use of better text representation and more complex network models can better fit the text and improve the classification effect, however, many realistic tasks, such as texts with high requirements for timeliness such as hot topics, require fast processing of text, so the next step will be to consider how to design an efficient model to improve the speed of text classification.
Data availability statement
The data analyzed in this study is subject to the following licenses/restrictions: Grid internal data. Requests to access these datasets should be directed to WXVmZW5nLllhbl9Ab3V0bG9vay5jb20=.
Author contributions
JH: Conceptualization, Writing-Reviewing and Editing; BG: Writing-Original draft preparation; WY: Supervision; JL: Conceptualization; CL: Resources; YY: Investigation.
Funding
This work was supported by the State Grid Corporation Headquarters Science and Technology Project (5700-202019487A-0-0-00).
Conflict of interest
Author JH was employed by State Grid Zhejiang Electric Power Co., Ltd. Authors JL and CL were employed by State Grid Zhejiang Electric Power Company.
The remaining authors declare that the research was conducted in the absence of any commercial or financial relationships that could be construed as a potential conflict of interest.
The authors declare that this study received funding from State Grid Corporation Headquarters Science and Technology Project (5700-202019487A-0-0-00). The funder had the following involvement in the study: data collection.
Publisher’s note
All claims expressed in this article are solely those of the authors and do not necessarily represent those of their affiliated organizations, or those of the publisher, the editors and the reviewers. Any product that may be evaluated in this article, or claim that may be made by its manufacturer, is not guaranteed or endorsed by the publisher.
References
Amati, G., and Rijsbergen, C. J. V. (2002). Probabilistic models of information retrieval based on measuring the divergence from randomness. ACM Trans. Inf. Syst. 20 (4), 357–389. doi:10.1145/582415.582416
Devlin, J., Chang, M. W., and Lee, K. (2018). Bert: Pre-training of deep bidirectional transformers for language understanding. arXiv preprint arXiv:1810.04805. doi:10.48550/arXiv.1810.04805
Hu, Y., Luo, D. Y., and Hua, K. (2019). A review and discussion on deep learning. J. Intelligent Syst. 14 (1), 1–19. doi:10.11992/tis.201808019
Johnson, R., and Zhang, T. (2017). Deep pyramid convolutional neural networks for text categorization. Proc. 55th Annu. Meet. Assoc. Comput. Linguistics 1, 562–570. doi:10.18653/v1/P17-1052
Lan, M. R., Wang, Y. G., Zheng, D. Q., and Zhai, Q. Q. (2017). Observation matrix optimization based on gradient descent method and QR decomposition. Comput. Technol. Dev. 27 (01), 190–194. doi:10.3969/j.issn.1673-629X.2017.01.043
Li, F., and Zhao, D. X. (2020). Research on substation intelligent operation and inspection system based on power IOT and GIS fusion. Power Big Data 23 (02), 38–45. doi:10.19317/j.cnki.1008-083x.2020.02.006
Li, T. Z. (2021). Design and implementation of fact detection system based on natural language processing technology. Nanjing, China: Southeast University. doi:10.27014/d.cnki.gdnau.2021.001471
Li, W. K., Liu, P. Y., Zhu, Z. F., and Liu, W. F. (2020). A sentence classification model based on convolutional neural network and Bayesian classifier. Comput. Appl. Res. 37 (02), 333–336+341. doi:10.19734/j.issn.1001-3695.2018.07.0525
Li, Y. R., Chen, Y. J., Wang, H. F., and Wu, X. h. (2022). Application problems and countermeasures of knowledge mapping in text error checking of power equipment defects. J. Power Syst. their Automation 34 (07), 113–119+128. doi:10.19635/j.cnki.csu-epsa.000912
Liang, Z. L. (2020). Research on structural damage identification based on recursive graph and convolutional neural network. Hefei, China: Hefei University of Technology. doi:10.27101/d.cnki.ghfgu.2020.001613
Liu, H. T. (2005). Computational linguistics from a comparative perspective. J. Xianning Coll. 2005 (04), 60–66. doi:10.16751/j.cnki.hbkj.2005.04.021
Shen, J. Y. (2022). Research on hyperspectral remote sensing image classification based on convolutional neural network and attention mechanism. Qingdao, China: Qingdao University of Science and Technology. doi:10.27264/d.cnki.gqdhc.2022.000643
Tong, G. M. (2021). Research on text classification methods based on graph convolutional networks. Shanghai, China: East China Normal University. doi:10.27149/d.cnki.ghdsu.2021.001046
Wan, M., Ren, J., Ma, M., and Cao, R. (2022). A study on the application of multi-task learning in Chinese dialect classification. Comput. Technol. Dev. 32 (04), 109–115. doi:10.3969/j.issn.1673-629X.2022.04.019
Wang, S. M. (2022). Research on aspect-level text sentiment classification based on heterogeneous graph convolutional networks. Tianjin, China: Tianjin Normal University. doi:10.27363/d.cnki.gtsfu.2022.000323
Wu, Y. J., Li, J., Song, C. F., and Chang, J. (2020). A text classification method based on efficient with neural networks. J. Electron. 48 (02), 279–284. doi:10.3969/j.issn.0372-2112.2020.02.008
Yu, C. T., and Salton, G. (1976). Precision WeightingAn effective automatic indexing method. J. Acm 23 (1), 76–88. doi:10.1145/321921.321930
Yuan, J. (2020). Research on fault text data analysis mining method of railroad system based on machine learning. Beijing, China: Beijing Jiaotong University. doi:10.26944/d.cnki.gbfju.2020.002921
Zhou, P., Shi, W., and Tian, J. (2016). “Attention-based bidirectional long short-term memory networks for relation classification,” in Proceedings of the 54th annual meeting of the association for computational linguistics, 2, 207–212. doi:10.18653/v1/P16-2034
Keywords: power operation inspection, text classification, graph convolutional networks, deep learning, smart grid
Citation: Hu J, Guo B, Yan W, Lin J, Li C and Yan Y (2022) A classification model of power operation inspection defect texts based on graph convolutional network. Front. Energy Res. 10:1028607. doi: 10.3389/fenrg.2022.1028607
Received: 26 August 2022; Accepted: 09 September 2022;
Published: 26 September 2022.
Edited by:
Yaxing Ren, University of Lincoln, United KingdomReviewed by:
Yingjie Wang, University of Liverpool, United KingdomNing Yang, University of Liverpool, United Kingdom
Copyright © 2022 Hu, Guo, Yan, Lin, Li and Yan. This is an open-access article distributed under the terms of the Creative Commons Attribution License (CC BY). The use, distribution or reproduction in other forums is permitted, provided the original author(s) and the copyright owner(s) are credited and that the original publication in this journal is cited, in accordance with accepted academic practice. No use, distribution or reproduction is permitted which does not comply with these terms.
*Correspondence: Yunfeng Yan, WXVmZW5nLllhbl9Ab3V0bG9vay5jb20=