
94% of researchers rate our articles as excellent or good
Learn more about the work of our research integrity team to safeguard the quality of each article we publish.
Find out more
ORIGINAL RESEARCH article
Front. Energy Res., 14 November 2022
Sec. Sustainable Energy Systems
Volume 10 - 2022 | https://doi.org/10.3389/fenrg.2022.1028310
 Monib Ahmad1
 Abraiz Khattak1*
 Abdul Kashif Janjua2
 Ahmad Aziz Alahmadi3
 Muhammad Salman Khan4Nasim Ullah3
The globally soaring energy prices and electricity shortfall are major hurdles in the economic development of Pakistan. To cope with periodic power outages, small and medium enterprise (SME) business owners have to fall back on alternate power sources such as backup generators and uninterruptible power supplies (UPS), which further increase the per kWh cost of electricity, power quality issues, and greenhouse gas (GHG) emissions. On the contrary, grid-tied solar photovoltaic (PV) systems are not only economical and sustainable but support the national power grid to mitigate environmental emissions. This study aims to investigate and compare the techno-economic viability of grid-connected solar photovoltaic power plants for the manufacturing SME sector in four different districts of Punjab, Pakistan. Based on the technical, financial, and environmental indicators, a detailed techno-economic, sensitivity, and GHG emission analysis is conducted using RETScreen Expert software. The research findings clearly show that the proposed solar PV projects for all four locations are technically, financially, and environmentally viable, however, Sargodha as compared to other sites is the most feasible location with the highest capacity factor of 17.8 %, highest internal rate of return 14.9 %, lowest payback period 7.7 years, and least levelized cost of electricity 8.5 ¢/kWh. For validation, the simulation results are compared with performance metrics from PV plants erected in various parts of the world. Applying the same research approach to the whole industrial sector of Punjab recommends adding 13,469 MW of PV capacity to satisfy the industry’s 20446.21 GWh annual energy consumption and to cut emissions by 90,17,581 t
In the current era of globalization, electricity generation, per capita electricity consumption, and energy footprint of a country are considered indicators to assess the development, economy, industrial growth, exports, and living standards of its inhabitants (Arto et al., 2016; Khan et al., 2020). According to the “World Bank Database of Sustainable Energy for All” (1998–2019), only 73.914 % population in Pakistan has access to electricity (THE WORLD BANK, 2022). This number is the lowest among all other South Asian countries including Maldives, Sri Lanka, Bhutan, India, Afghanistan, Bangladesh, and Nepal as shown in Figure 1. This situation intimates a lack of a holistic approach to power sector expansion planning and implementation to ensure reliable and indiscriminate access to electricity amid growing energy demands. To meet growing energy needs Pakistan heavily relies on carbon-intensive fossil fuels as its primary source of energy (Babar et al., 2021). As of May 2021, thermal power plants in Pakistan constituted 66 % of the total installed generation capacity, the hydel share was 29 %, and variable renewable energy sources such as bagasse, wind, and solar collectively accounted only for 5 % of total power generation mix as shown in Figure 2 (National Electric Power Regulatory Authority (NEPRA), 2022).
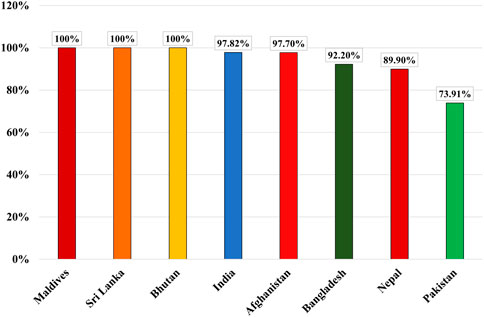
FIGURE 1. Population having access to electricity in South Asia (THE WORLD BANK, 2022).
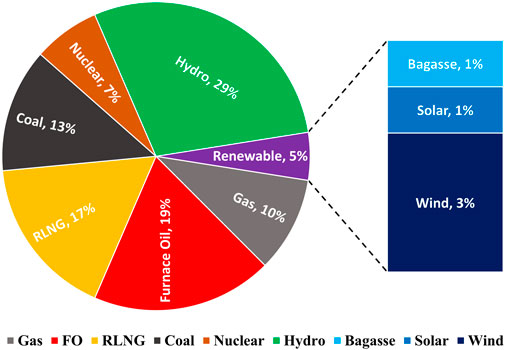
FIGURE 2. Percent share of installed generation capacity in Pakistan (National Electric Power Regulatory Authority (NEPRA), 2022).
About 47 % of electricity generation assets in the country are dependent on imported fossil fuels which is why Pakistan has to import one-third of its energy resources to accomplish a balance between power generation and demand (National Electric Power Regulatory Authority (NEPRA), 2022). Back in the year 2017–2018 Pakistan’s net energy imports were USD 14.4 billion compared to USD 10.9 billion in the preceding year. Out of this recorded USD 3.5 billion increase, only 25 % was due to increased energy imports while the rest of 75 % was reported due to inflated energy prices (Malik et al., 2020). The prices of these fuels keep on fluctuating in the international market and cause the per unit electricity generation cost to increase (Yasmeen et al., 2019). This increment in turn reflects in electricity bills as a fuel price adjustment. The fuel price volatility and an increased risk of energy insecurity have not only put socio-economic sustainability at stake but also made Pakistan vulnerable to global and regional geopolitics (National Electric Power Regulatory Authority (NEPRA), 2022; Nawaz and Alvi, 2018). In terms of energy security, the “World Energy Council” has ranked Pakistan 83 among 101 countries for the year 2021 (WORLD ENERGY COUNCIL, 2022).
The troubling situation of economy, energy insecurity, and stochastic fuel price volatility are posing a serious threat to the survival of the manufacturing industry in the country especially when it comes to small and medium enterprises (SMEs), already struggling with limited resources and technical expertise to compete with local and international markets (Small and Medium Enterprises Development Authority (SMEDA), 2021a).
SMEs play a key role in the socio-economic and industrial uplift of a country. Particularly in Pakistan, being a developing economy, the role of SMEs cannot be overemphasized. Pakistan is known to have 3.2 million SME units which account for about 90 % of all enterprises operating in the country, takes into employment about 78 % of the non-agriculture labor force, has a 30 % share in the export sector and approximately 40 % share in annual GDP of the country (Ali et al., 2020; Arshad et al., 2020). Punjab with a population of 110 million is the most populous province of Pakistan (Quick Stats, 2021). It is an industrial hub of the country and houses about 65.26 % of SME units making it the biggest consumer of electricity. In the meantime, SMEs in the said province suffer from several constraints such as the risk of investment loss due to high uncertainty, limited financial and intellectual resources, and above all seasonal power crises leading to recurrent and extended power outages (Arshad et al., 2020; Qazi et al., 2020). Among these constraints load shedding is the most critical one as it disrupts the production process by making equipment go offline leading to spoilage of raw material, idle time labor wages, delayed fulfillment of customer orders and opportunity loss, etc. (Bukhari Institute of Public Policy (BIPP), 2021).
According to “National Transmission and Dispatch Company” (NTDC) in the year 2021, 24,106 MW of electricity demand was recorded in Pakistan whereas, the installed generation capacity was reported to be 34,100 MW. Despite a 9994 MW gap between installed capacity and load demand, the country observed hours-long load shedding on daily basis to manage 2500–3000 MW of load demand. “National Electric Power Regulatory Authority” (NEPRA) investigation disclosed the core reason of load shedding was underutilization of RLNG power plants due to unavailability of fuel, poor governance, and weak transmission and distribution network (National Electric Power Regulatory Authority (NEPRA), 2021a). These power cuts caused permanent cessation of several SMEs while left many other ailing (Qazi et al., 2020).
Thus, to ensure a consistent supply of electricity at the SME end, the SME business owners usually switch to alternate sources of electricity such as UPS and backup generators, etc. No doubt UPS serves the purpose for the time being but in a long run, it is believed to be a major source of harmonics and consequently line losses in the power distribution network (Ahmad et al., 2016; Arshad and Ali, 2017). Whereas backup generators are noisy and pollution pervasive, run-on fossil fuels, and are again subjected to the same constraint of fuel price volatility. As reported by “Institute for Energy Economics and Financial Analysis”, after hydroelectric power solar and wind are the cheapest renewable energy sources in Pakistan (Ahmed et al., 2021). Hence, to indigenize the generation mix and to ensure energy security, the techno-economic feasibility study of other sustainable energy resources must have to be explored.
Several literature studies highlight energy crises as a major and common issue faced by SMEs in Punjab and other provinces of Pakistan. However, to the best knowledge of authors not even a single case study was found that discusses in detail a sustainable solution to help SMEs tackle the problem of energy crises considering their actual energy needs. Therefore, to fill this research gap this paper undertakes case studies of four export-oriented SME businesses dealing in marble processing, commercial textile embroidery, rock salt products, and plastic products manufacturing. The clusters of said SMEs are located in Multan, Lahore, Sargodha, and Rawalpindi respectively (Small and Medium Enterprises Development Authority (SMEDA), 2021b; Small and Medium Enterprises Development Authority (SMEDA), 2022a; Small and Medium Enterprises Development Authority (SMEDA), 2022b; Small and Medium Enterprises Development Authority (SMEDA), 2022c). The geographical locations of these districts are indicated in Figure 3 and coordinate details are given in Table 1.
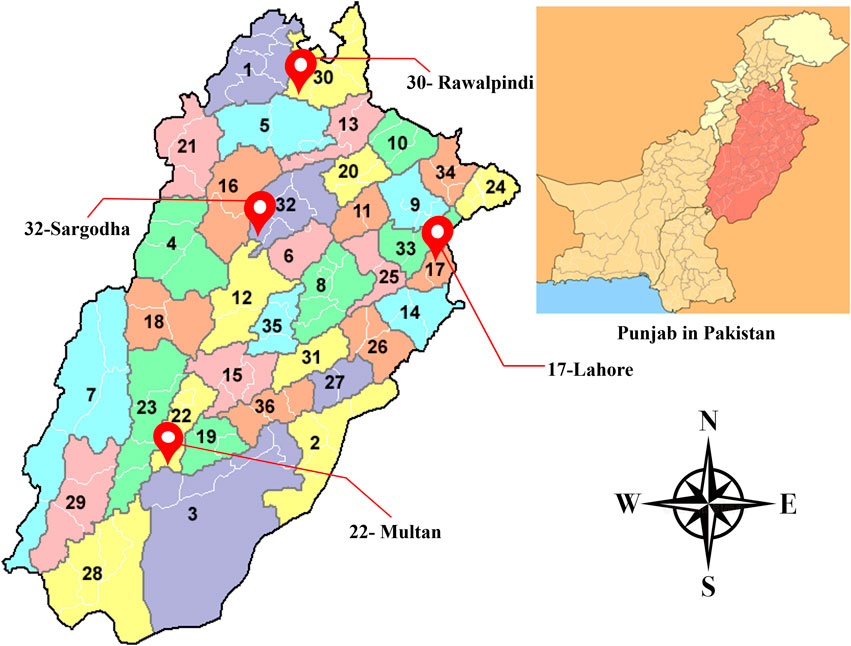
FIGURE 3. Geographical locations of selected SME clusters in Punjab, Pakistan.
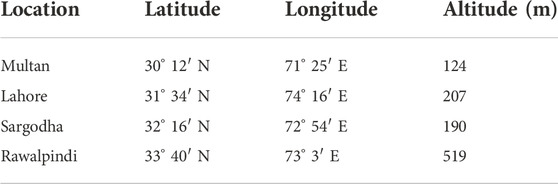
TABLE 1. Coordinate details of selected locations.
The main objective of this study is to assess the techno-economic feasibility of grid-connected PV systems for these four SME sectors at their respective clusters. The core focus is on solar PV technology as it is not only time-tested and mature but is clean, sustainable, and scalable too. RETScreen Expert - Professional—8.1.2.13 software is used to perform techno-economic feasibility and performance evaluation analysis. Also, a detailed emission analysis is performed to estimate the GHG mitigation potential of each project site under study. The results of this research are equally important for other developing economies in the region facing similar challenges of energy crises.
The techno-economic feasibility studies of grid-connected solar PV plants at different locations in the world have been investigated in the recent past. Khalid et al. (2013) investigated the economic viability of a 10 MW solar PV plant at Quetta, Pakistan using RETScreen software. For single-axis tracking mode, the electricity production cost of 0.157 USD/kWh and net present value of USD -14.9 million were calculated (Khalid and Junaidi, 2013). Obeng et al. (2019) evaluated the techno-economic feasibility of a 50 MW PV system for monocrystalline, polycrystalline, and thin-film PV technologies at the UENR campus in Nsoatre. The findings revealed that the electricity generation costs 10.9 to 12.4 ¢/kWh and the payback period ranges between 6.4 and 7.2 years (Obeng et al., 2020). The authors analyzed the performance of the 15 MW grid-tied PV plant at the University of Jordon. The analysis results indicated an annual specific yield of 1668 kWh/kWp and a payback period of about 3 years for a fixed axis PV system (Ayadi et al., 2018). The researchers carried out a techno-economic analysis of a 2.5 MW on-grid PV plant for a garment zone in Jaipur, India. The results manifested an electricity generation cost of 0.228 USD/kWh, a payback of 6.29 years, and a net present value of USD 4.99 million for an off-site power plant (Chandel et al., 2014).
The author explored the techno-economic potential of a 5 MW grid-connected PV plant at 35 locations in Ethiopia using HOMER and RETScreen software. The findings revealed an annual average yield of 8674 MWh and an average capacity factor of 19.8 % for all locations (Kebede, 2015). The 29 potential sites in Egypt were subjected to techno-economic feasibility analysis for the placement of a 10 MW grid-tied PV plant using RETScreen software. The results confirmed maximum annual energy yield and capacity factor values of 29.493 GWh and 33.7 % respectively for the Wahat Kharga site (EL-Shimy, 2009). The six states in Nigeria were subjected to a detailed techno-economic feasibility assessment of installing a 6 MW grid-connected PV plant. Among selected sites, Yobe state was found to have the highest per annum life cycle savings of 205,928 USD, an energy production cost of 0.128 USD/kWh, and the least payback period of 13.6 years (Owolabi et al., 2019).
Abas et al. (2022) investigated the techno-economic feasibility of installing 100 MW grid-tied solar PV plant in Pakistan. The results revealed 180 GWh of annual energy yield, 11.89 years SPBP, and 90,225 t
The authors investigated the energy efficiency of a Turkish sugar factory. The annual energy demand for this sugar factory was optimized to be 43,590.25 tons of oil equivalent (toe) whereas, the per unit energy cost was calculated 688.22 USD/toe (Taner et al., 2018). (Taner, 2015) improved the energy-efficient procedures for a drying facility (Taner, 2015a), (Taner and Sivrioglu, 2015). The authors evaluated the techno-economic feasibility of turbine power plant by developing a sugar production process model for a sugar production plant. The results suggested unit cost of 0.87 USD/kWh and payback period of 4.32 years (Taner and Sivrioglu, 2017). (Taner, 2018) performed experimental optimization for proton exchange fuel cell with core aim to improve performance efficiency. The research findings revealed exergy and energy efficiencies of 50.4 % and 47.6 % respectively (Taner, 2018). The performance efficiency of PEM fuel cell could be improved by adjusting parameters such as pressure, voltage, flow rate and cleaning process (Taner, 2017). The PEM fuel cell has certain advantages such as low operating temperature, high power density, alternative catalysts, water and heat management etc. (Taner, 2015b; Taner et al., 2019). However, it has several disadvantages as well including degradation, gas diffusion and flow field layers, catalyst problems etc. (Taner, 2015b; Taner et al., 2019). The techno-economic analysis revealed that the cost of PEM fuel cell with higher power density decreases however, the initial capital investment stays high (Taner, 2019).
To evaluate the techno-economic viability of energy transition in the SME sector, four export-oriented SME clusters were identified and surveyed in far-flung districts of Punjab to incorporate the effect of climate diversity into research findings. Based on the survey, an SME in each cluster was designated as a representative SME. Grid-tied solar PV systems were designed considering the actual load profile of all four representatives SMEs. RETScreen energy management tool was used to model designed PV systems. Finally, techno-economic, sensitivity, and GHG emission reduction analyses were carried out for all project sites.
Figure 4 illustrates the six-step methodology flowchart. These steps are: 1) Literature review 2) Case study 3) Data collection 4) Simulation 5) Analysis and comparison 6) validation of results.
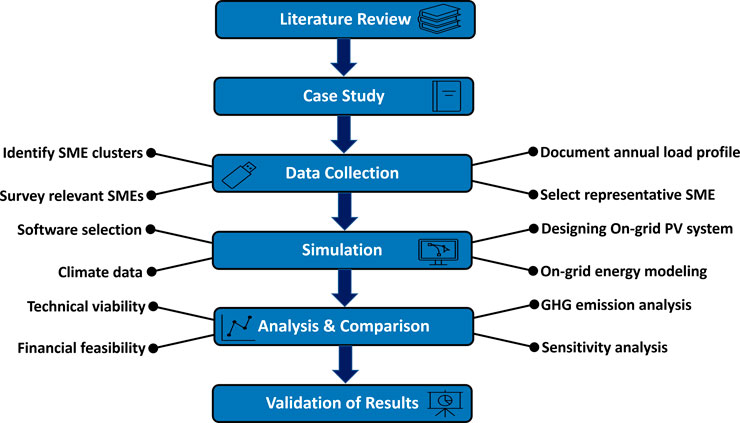
FIGURE 4. Research methodology flowchart.
The very first step involved in the design and feasibility assessment of a PV system is to determine the energy requirements of the facility. One way to establish energy demand is to perform an energy audit of the facility site and list down continuous power ratings of all loads that are supposed to be run on the PV system. Multiplying the nameplate power rating (in watt) of each load with its daily time of use (in hours) yields the daily energy demand of the facility in Watt-hour (Wh). Whereas the more realistic and practical approach followed by solar PV system installers to estimate the energy requirements of a facility is to make use of per month/year energy consumption data available on utility bills. Therefore, to obtain actual energy consumption data of selected SME sectors a questionnaire was designed. The principal purpose of this questionnaire was to document the monthly energy consumption of selected SMEs for the past 12 months.
Further, to have better industry insight and to broaden the scope of study other fields such as the number of employees, seasonality constraints, working hours, and product range were also included in the questionnaire. Ten SMEs were chosen for this survey in each SME cluster. The business owners of selected SMEs were then approached in this regard and those who gave positive responses were then interviewed. After conducting surveys data was compiled and statistically analyzed. Based on the analysis of survey data, one SME in each cluster that best suited the applied methodology was chosen as a representative SME. All four representative SMEs were then considered for PV system design at their respective clusters. Table 2 and Figure 5 show the monthly electricity consumption statistics of each representative SME.
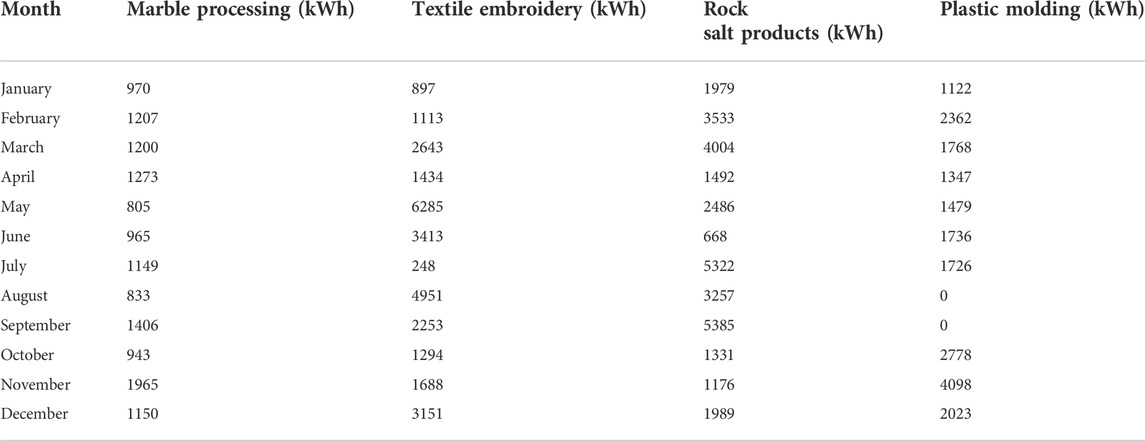
TABLE 2. Twelve-months energy consumption data of representative SMEs.
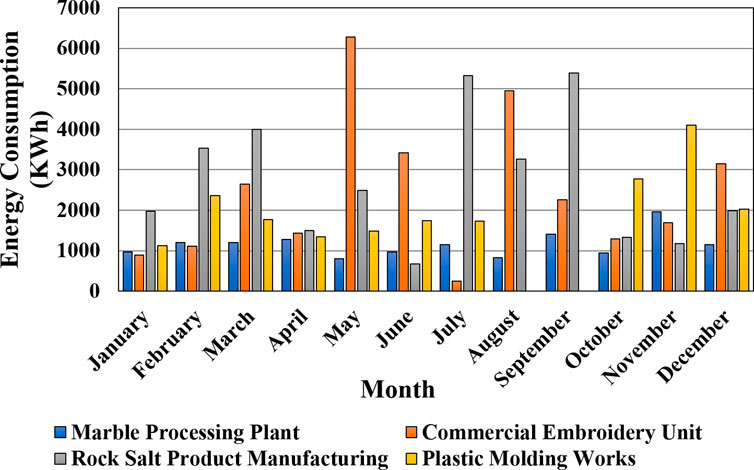
FIGURE 5. Monthly averaged electricity consumption of representative SMEs.
To establish reference climate conditions for each facility location, RETScreen derives meteorological data either from the global satellite database of the National Aeronautics and Space Administration (NASA) or nearby ground-based weather monitoring stations or both (Sreenath et al., 2021; Owolabi et al., 2019). Climate data from local ground-based weather monitoring stations are preferred over satellite data from NASA due to its lower uncertainty. The monthly average climate data of selected facility locations are listed in Table 3. District Sargodha has the highest monthly average solar radiation of 5.62 kWh/m2/d followed by Multan and Lahore with 5.54 kWh/m2/d and 5.09 kWh/m2/d respectively. Rawalpindi has the least value of 4.39 kWh/m2/d. Also, the monthly variance of average daily solar irradiation and ambient air temperature of chosen facility locations is shown in Figure 6, Figure 7 respectively. The daily average solar irradiation magnitudes range from 4.43 kWh/m2/d (December) to 6.08 kWh/m2/d (April) in Multan, 3.77 kWh/m2/d (January) to 5.95 kWh/m2/d (May) in Lahore, 4.67 kWh/m2/d (December) to 6.61 kWh/m2/d (May) in Sargodha, and 2.84 kWh/m2/d (January) to 5.45 kWh/m2/d (October) in Rawalpindi.
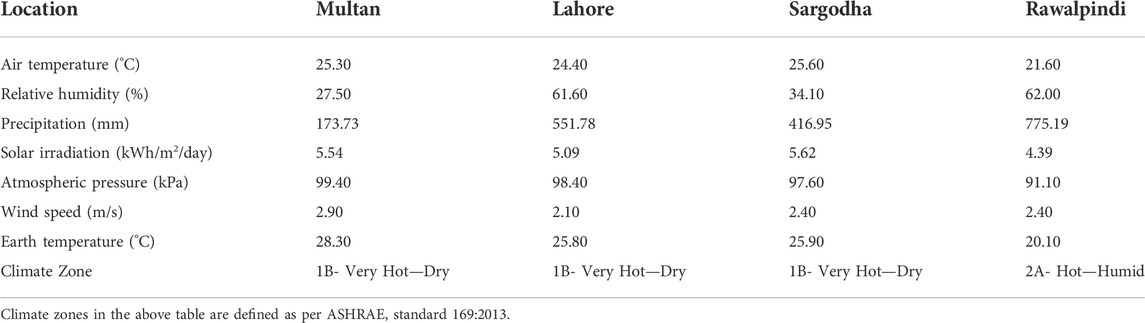
TABLE 3. Monthly average climate data of selected facility locations.
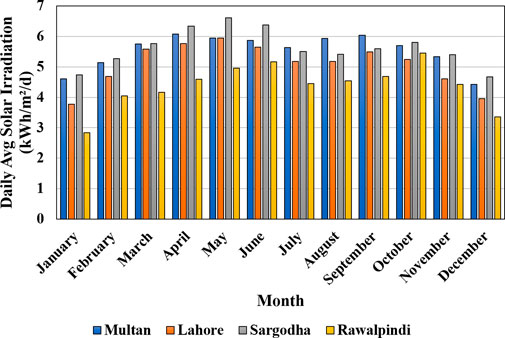
FIGURE 6. Monthly variance of average daily solar irradiation.
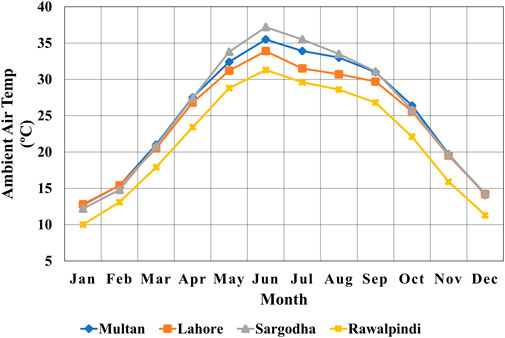
FIGURE 7. Monthly variance of ambient air temperature.
The ambient air temperature of a facility location has a significant effect on the efficiency of PV modules and therefore plays a key role in the performance evaluation of PV systems (Ahmed et al., 2021). The minimum and maximum values of ambient air temperature are 12.7°C, 12.8°C, 12.2°C, and 10°C (in January) and 35.5°C, 33.9°C, 37.2°C, and 31.3°C (in June) for Multan, Lahore, Sargodha, and Rawalpindi respectively. Figure 8 shows the variation of the monthly average wind speed of sites under study. Multan shows the highest monthly average wind speed of 4.0 m/s followed by Rawalpindi, Lahore, and Sargodha having average wind speeds of 3.8 m/s, 3.1 m/s, and 2.7 m/s respectively.
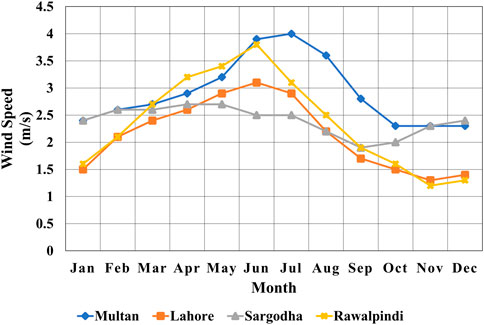
FIGURE 8. Monthly average wind speeds.
RETScreen is an Excel-based clean energy management platform developed by “Canmet Energy Research Center” and “Natural Resources Canada” (Khalid and Junaidi, 2013). This study uses an updated version of this software called RETScreen Expert 8.1. It is a validated simulation tool and is widely used for its outstanding ability to perform a preliminary assessment of renewable energy projects with an accuracy of 0–6% of actual energy yields (Khalid and Junaidi, 2013). It contains several worksheets required to perform a comprehensive project analysis. It is easy to use and is also available free of cost in viewer mode (Sreenath et al., 2021).
The following steps describe a systematic simulation approach to establish the techno-economic feasibility of a grid-connected photovoltaic power system.
• Select the location of the proposed facility site.
• Provide technical details e.g., tilt and azimuth angle, PV technology and module rating, Inverter rating and losses, etc.
• Enter values required for economic analysis of PV project e.g., initial cost, operation, and maintenance (O&M) cost, electricity export rate, interest and discount rate, etc.
• Input the values required for environmental analysis e.g., base case energy mix and T&D losses, etc.
• Perform energy, cost, emission, financial and risk analysis.
Figure 9 shows the flowchart for a better understanding of the simulation approach adopted in this study.
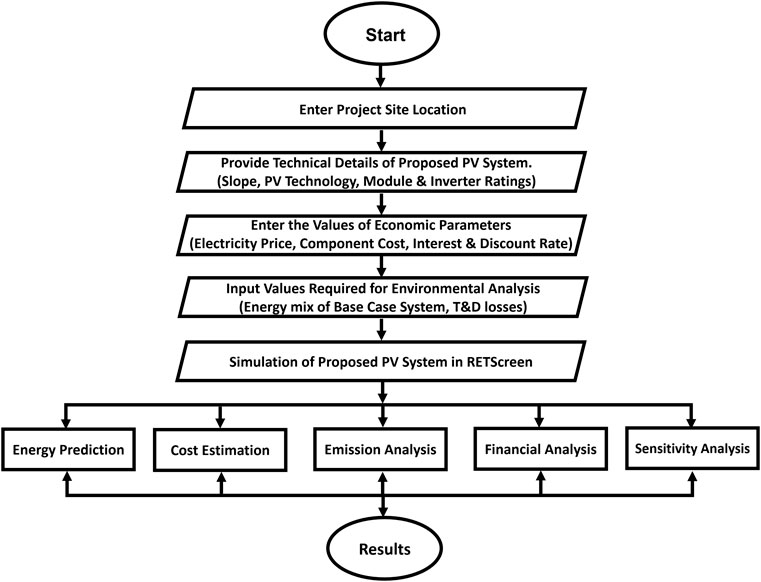
FIGURE 9. RETScreen simulation flowchart.
The grid-tied PV system (Figure 10) modeling in RETScreen requires the user to specify the power capacity of the PV system and inverter in its energy modeling worksheet. Therefore, to calculate the PV power capacity, the number of solar panels, the rated power capacity of inverters and batteries, this section discusses in detail the design methodology and technical specifications of proposed grid-tied solar PV systems considering the actual load profile data of selected SMEs.
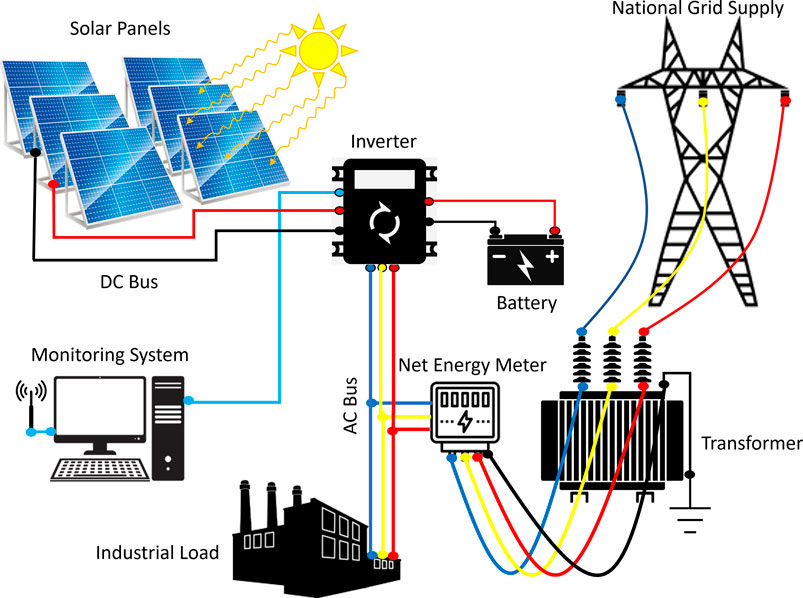
FIGURE 10. Schematic diagram of a grid-connected solar PV system.
The panel generation factor (PGF) is regarded as an essential parameter in the calculation of the total watt peak rating of PV modules (Chandel et al., 2014). PGF is a function of solar irradiance which is site-specific. Hence, PGF varies from site to site (Ikoiwak et al., 2021).
The PGF values for Multan, Lahore, Sargodha, and Rawalpindi are calculated as 5.54, 5.09, 5.62, and 4.39 respectively using solar irradiance values given in Table 3.
The energy required from the PV system is calculated by multiplying the peak energy demand of the concerned facility in kWh/day times the safety factor of 1.3 (Owolabi et al., 2019; Chandel et al., 2014; Ikoiwak et al., 2021). The safety factor compensates for the energy losses associated with the PV system by incrementing the installed PV system capacity by 30 %.
Where:
Watt peak capacity of PV modules is used to determine the number of PV modules required to meet the energy demand of each SME. The ratio of
Where,
CS6X-310P-MaxPower modules were considered for all four project sites. Each module has a rated peak power output of 310 W and average panel efficiency as high as 16.16 %. The ability of this module to sustain extreme weather conditions, no light-triggered degradation, and high efficiency even at elevated temperatures make it an ideal choice for selected locations. The electrical characteristics of the polycrystalline CS6X-310P-MaxPower PV module are summarized in Table 4 (CanadianSolar, 2022b).

TABLE 4. Electrical characteristics of CS6X-310P-MaxPower PV module.
Finally, the ratio of total watt peak rating to the rated maximum power output of the selected PV panel gives the number of PV modules required to meet the energy demand.
Where,
Inverter Loading Ratio (ILR), also known as Optimum Sizing Ratio (OSR), is used by PV system designers as an optimization approach for solar inverter sizing. ILR is the quotient of installed DC power capacity of PV array to AC power output rating of the inverter (Zidane et al., 2021).Where,
The United States “Energy Information Administration” (EIA) suggests the ILR value for an individual PV system to be somewhere between 1.13 and 1.30 (Marcy, 2021; Aurora, 2021). PV system design with an ILR value greater than unity indicates an undersized inverter. An undersized inverter is prone to a phenomenon called inverter clipping at times when DC power from an oversized PV array exceeds the inverter’s output power limit causing power loss (Aurora, 2021). However, to ensure the efficient and safe operation of the PV system general principle is to select ILR unity (Ikoiwak et al., 2021). Therefore, considering the ILR value equal to unity in Eq. 5, the inverter power ratings for marble processing, commercial textile embroidery, rock salt products, and plastic products manufacturing SMEs are calculated as 15.5 kW, 53.63 kW, 41.54 kW, and 40.3 kW respectively.
CSI-T400GL01-E inverter series is considered for all four locations due to its high degree of compatibility with selected PV modules in terms of technical specifications. The selected PV module has a 1000 Vdc rated maximum system voltage, exactly equal to the inverter’s rated maximum input voltage. The selected inverters have a frequency range of 50/60 Hz and rated maximum power outputs of 12 kW, 15 kW, and 20 kW. In marble processing SME inverter operation is centralized whereas, in commercial textile embroidery, rock salt products, and plastic products manufacturing SMEs inverters function in string configuration. However, the selection of standard-sized inverter makes the actual ILR values slightly deviate from unity but still fall between a minimum of 1.01 to a maximum of 1.04, a safe range as recommended by IEA (Marcy, 2021). The technical specification data of CSI-T400GL01-E inverter are provided in Table 5 (Canadian Solar, 2022a).
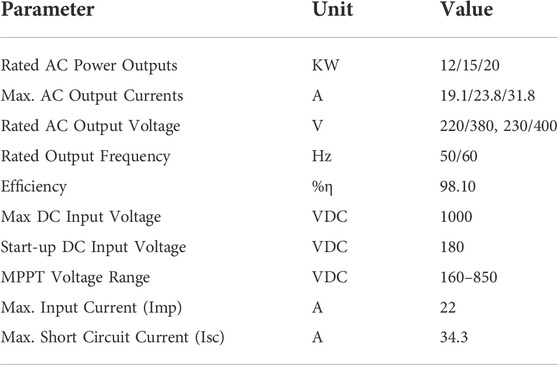
TABLE 5. Technical specification of CSI-T400GL01-E inverter series.
The peak energy demand of each SME is taken as reference to calculate optimal Ampere-hour (Ah) capacity of battery system using the below equation (Owolabi et al., 2019).
Where, D represents the days of autonomy and is taken as 0.25 to provide up to 6 hours backup during power outages.
The RETScreen on-grid photovoltaic energy model is briefly described in this section. The model has fewer input data requirements and speeds up the calculations by maintaining an acceptable accuracy level.
The PV array is normally characterized by its efficiency
Where
Where,
Where NOCT is nominal operating cell temperature and
The energy delivered by the PV array is attenuated by power conditioning losses
Whereas the overall efficiency of the array
The energy available to the grid is what is generated by the PV array, attenuated by inverter losses and load Retscreen International Clean Energy Decision Support Centre (Canada), 2005):
Where,
Where,
The net electricity generated by a PV system over a year is referred to as the yield factor or specific yield (Imam and Al-Turki, 2020).
It is used to compare the operational performance of different technologies and helps estimate their financial worth.
The ratio of the actual annual energy yield of a PV plant to the energy it would produce when operating at nominal capacity over 1 year (Imam and Al-Turki, 2020).
The capacity factor of a solar PV power plant is primarily influenced by three key variables: inverter size, tracking ability, and resource quality (Mayes, 2022). The inverter size and tracking ability are design parameters that can be optimized to have higher energy yield however, resource quality is site specific and varies from site to site. Capacity factor shows the likelihood of a facility to operate at nominal capacity and therefore helps energy experts to assess the reliability of power plants. Power plants with higher capacity factor tend to have higher annual energy yield and lower per unit energy cost. Thus, capacity factor has great physical importance in power system planning, operation, and economics.
The net present value (NPV) of a project is the measure of net future cash flows discounted at the present value of the discount rate (Retscreen International Clean Energy Decision Support Centre (Canada), 2005).
Where
The NPV is a decisive financial metric that assesses whether a project is a financially sound investment or not. Generally, a project with any positive value of NPV is regarded as financially viable.
The discount rate that makes the project’s NPV to be zero is called the internal rate of return (IRR). The following formula is used to compute the IRR (Retscreen International Clean Energy Decision Support Centre (Canada), 2005):
Where
IRR infers the profitability of a project and therefore plays an important role to assess the economic viability of a project. The value of IRR is obtained by solving Eq. 17.
The simple payback period is the time in years it takes for the cash flow (excluding loan payments) to match the entire investment (which is the sum of debt and equity) (Retscreen International Clean Energy Decision Support Centre (Canada), 2005):
Where C is the net initial project cost, IG is the incentive and grants,
The levelized cost of electricity, also known as energy production cost, is the per-unit cost of electricity required to have zero NPV (Ikoiwak et al., 2021).
Where
In this section, a comparative techno-economic analysis of PV projects at four facility sites is presented followed by the sensitivity analysis of the facility site with least potential. Moreover, the GHG mitigation potential of each project site is discussed in detail.
The modeling of proposed PV projects at four selected locations was done considering fixed solar tracking mode. The choice of fixed solar tracking mode was made based on its simplicity, and low initial and O&M costs. It is required to enter miscellaneous losses associated with the PV module and inverter in the energy section of the RETScreen software to get more realistic simulation results. These miscellaneous losses include module mismatch losses, wiring losses, losses due to the presence of snow or dirt on the module surface, etc. (Khalid and Junaidi, 2013). Whereas losses that arise due to operating temperature are calculated by software using the temperature coefficient of selected PV module. The array and inverter miscellaneous losses of 12 % and 3 % respectively were considered in this study. The technical parameters as listed in Table 6 were used as input variables in the energy modeling of PV projects.
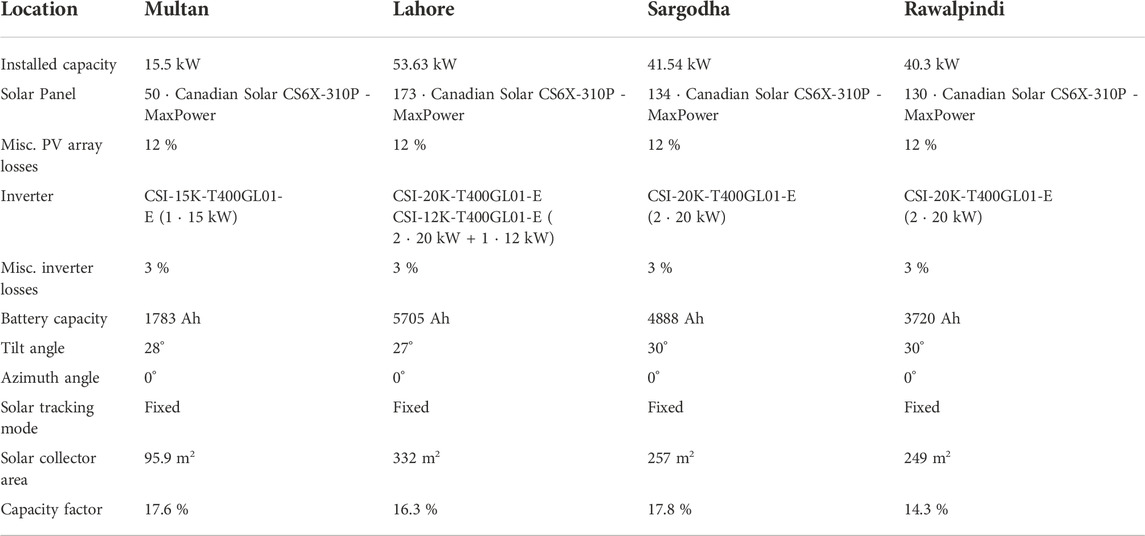
TABLE 6. Technical input variables used in the PV system modeling.
Simulation results revealed maximum annual energy yields of 23.90 MWh, 76.60 MWh, 64.9 MWh, and 50.50 MWh when solar PV arrays at Multan, Lahore, Sargodha, and Rawalpindi were sloped at 28°, 27°, 30°, and 30° respectively. However, Figure 11 shows the daily load profile and solar energy generation forecast for 25 June 2022, to evaluate the compatibility of the proposed PV design to meet the daily energy needs of each representative SME. The daily averaged solar energy production of PV projects in Multan, Lahore, Sargodha, and Rawalpindi was forecasted as high as 64.24 kWh, 223.14 kWh, 181.15 kWh, and 188.38 kWh. However, the daily energy demand (load) of marble processing, textile embroidery, rock salt products, and plastic manufacturing SMEs was recorded to be 60.14 kWh, 216.53 kWh, 108.64 kWh, and 124.31 kWh respectively. During solar productive hours, the proposed PV configurations enabled self-consumption of 49.24 kWh load in marble processing, 142.70 kWh load in textile embroidery, 80.46 kWh load in rock salt processing, and 98.91 kWh load in plastic products manufacturing SMEs, achieving self-consumption indices of 81.87 %, 65.90 %, 74.06 %, and 79.56 % and yielding a surplus of 15 kWh, 80.44 kWh, 100.69 kWh, and 89.47 kWh respectively.
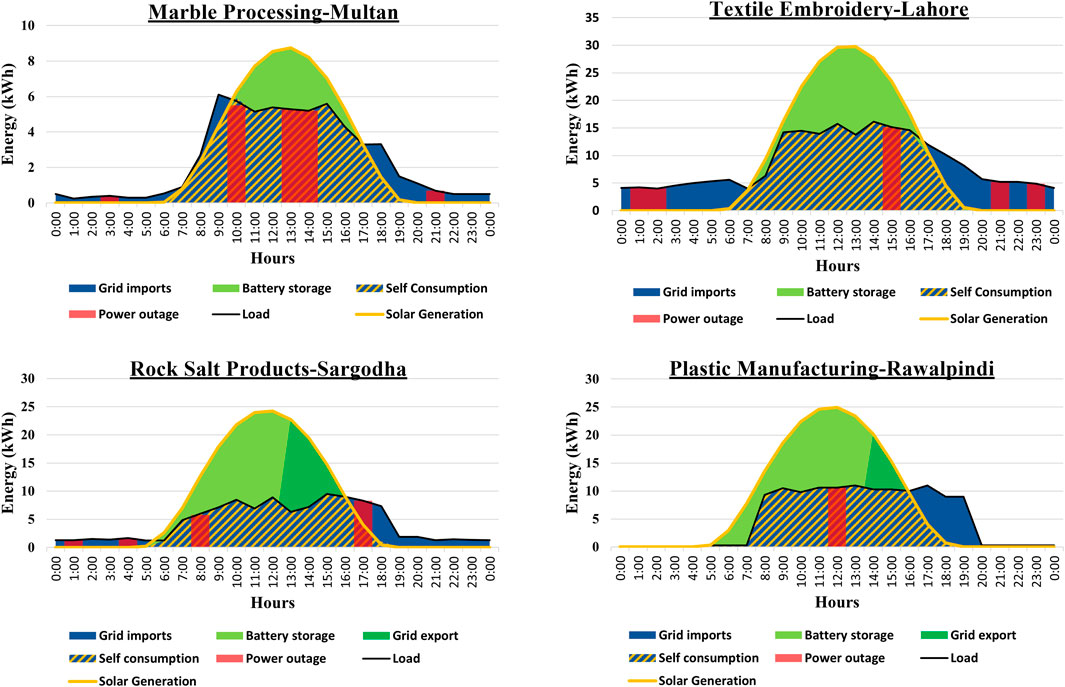
FIGURE 11. Typical daily solar generation and load curves of representative SMEs.
To avoid curtailment of surplus energy, surplus energy was supplied to recharge the battery storage system to be used as a backup for grid power outages during undersupply or non-productive solar hours. However, in case the batteries are fully charged the excess energy from PV arrays flows upstream into the grid, as apparent in the case of rock salt and plastic products manufacturing SMEs with grid export of 43.46 kWh and 14.4 kWh respectively. The SME owners get credits for grid energy exports that can be used to offset the cost of grid energy imports for unproductive solar hours. Also, the proposed PV designs were good enough to avoid the halting of industry operations due to periodic grid power outages as highlighted in red for each SME in Figure 11. The detailed technical analysis corroborates that all four PV setups have sufficient potential to curb the dire impacts of prevailing energy crises and therefore ensure the smooth and reliable functioning of SMEs.
The parameters listed in Table 7 were used as input variables in the financial modeling of PV projects. The values of input financial parameters such as average annual inflation rate, debt term, and debt interest rate were chosen keeping in view the current economic trends and financing schemes of local banks. Whereas standard values as suggested by the software were considered for the discount rate and electricity export escalation rate. Financial modeling of PV projects also requires initial capital cost and O&M cost. The initial cost is the total capital expense required to enable the proposed facility to start generating revenue. However, O&M cost is required to cover the cleaning expenditures of PV modules, inverter replacement cost, and any possible contingency. The initial capital cost of 1000 USD/kW (Akbar et al., 2020), annual O&M cost of 10.0 USD/kW (Ikram et al., 2021), inflation rate of 10 % (Asad et al., 2022), electricity export rate of 0.09 USD/kWh (Ahmed et al., 2021), debt ratio of 50 % (Khalid and Junaidi, 2013), debt interest rate of 9.75 % (Mehmood et al., 2022), discount rate of 9% (Khalid and Junaidi, 2013), electricity export and fuel cost escalation rate of 2% (Rauf et al., 2022), project life of 25 years (Rauf et al., 2022), and debt term of 10 years (Khalid and Junaidi, 2013) were used in the energy model based on the studies and quotations from PV system installers in the local market. Using defined input economic parameters, annual lifecycle savings, benefit-cost ratio, NPV, IRR, SPBP, LCOE, etc. were calculated by running a financial analysis model as shown in Table 8.
TABLE 7. Input variables considered in financial modeling.
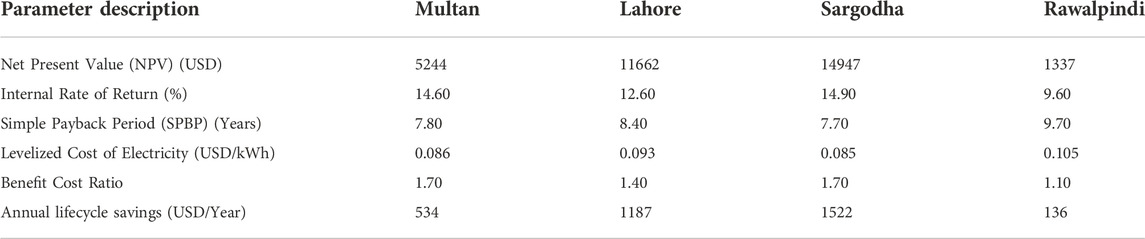
TABLE 8. Financial output parameters of the proposed PV projects.
NPV, IRR, LCOE, and SPBP are key indicators used to assess the economic viability of a grid-connected PV system (Ahmed et al., 2021), (Owolabi et al., 2019). Figure 12 shows the trend of these financial output indicators for all four selected facility locations. Figure 12 depicts that the proposed PV system in Sargodha has the highest NPV of 14947 USD followed by Lahore and Multan with NPV of 11662 USD and 5244 USD respectively. Whereas the PV project in Rawalpindi has the least NPV of 1337 USD. According to (Khalid and Junaidi, 2013), (Owolabi et al., 2019) a project with any positive value of NPV is regarded as financially acceptable. As noted in Figure 12 Sargodha tends to have an uppermost IRR value of 14.9 %. Likewise, the IRR value for the PV project in Multan is 14.6 % followed by Lahore and Rawalpindi with 12.6 % and 9.6 % respectively. Normally, a project is believed to be economically feasible if its IRR is higher than the discount rate (Sreenath et al., 2021), (Owolabi et al., 2019), (Khalid and Junaidi, 2013). All four sites with IRR values higher than the threshold of a 9 % discount rate affirm the profitability of the project investment.
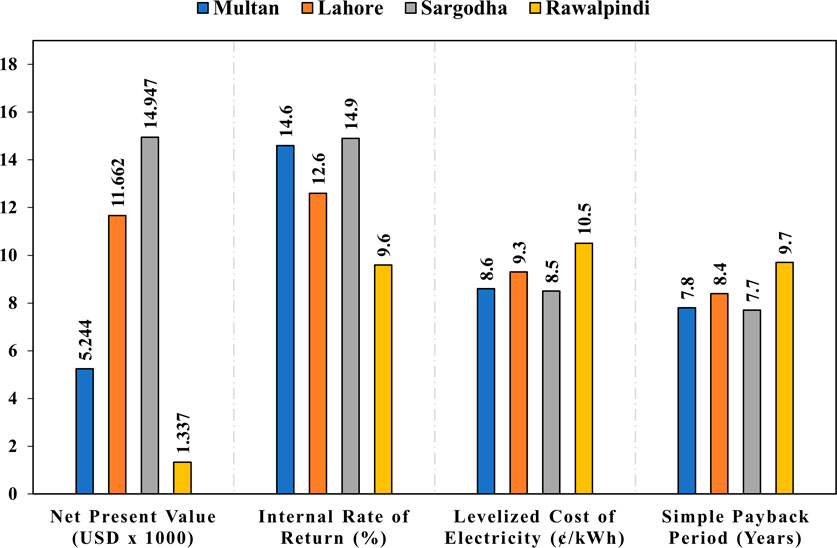
FIGURE 12. Comparison of PV projects based on financial output variables.
Also, Figure 12 sets forth the comparison of LCOE of PV projects under study. The benchmark electricity cost used in this research is equal to the pretax utility industrial tariff of 12.0 ¢/kWh (National Electric Power Regulatory Authority (NEPRA), 2021b). The proposed PV system in Sargodha has the least LCOE value of 8.5 ¢/kWh compared to Multan and Lahore with LCOE values equal to 8.6 ¢/kWh and 9.3 ¢/kWh respectively. Rawalpindi however has the highest LCOE value of 10.5 ¢/kWh.
SPBP is an important indicator as it gives investors insight into the probability of an investment (Ahmed et al., 2021). The debt term proposed for all sites was 10 years Figure 12 illustrates the SPBP of all four PV projects for chosen SME locations. The SPBP varies between a minimum of 7.7 years for Sargodha to a maximum of 9.7 years for Rawalpindi. Whereas Multan has 7.8 years followed by Lahore with 8.4 years of payback time. Also, Figure 13 shows the cumulative cash flows and therefore net profit generated by each project location after recovering capital investment at the end of project life. Profit generated by a project is the function of installed PV project capacity in kW, the climate of facility location, and kWh generated by the PV system. This is because the PV project in Lahore with a maximum installed capacity of 53.63 kW accumulated 97147 USD. Whereas Multan with the comparatively lowest installed PV capacity of 15.50 kW generated 33266 USD.
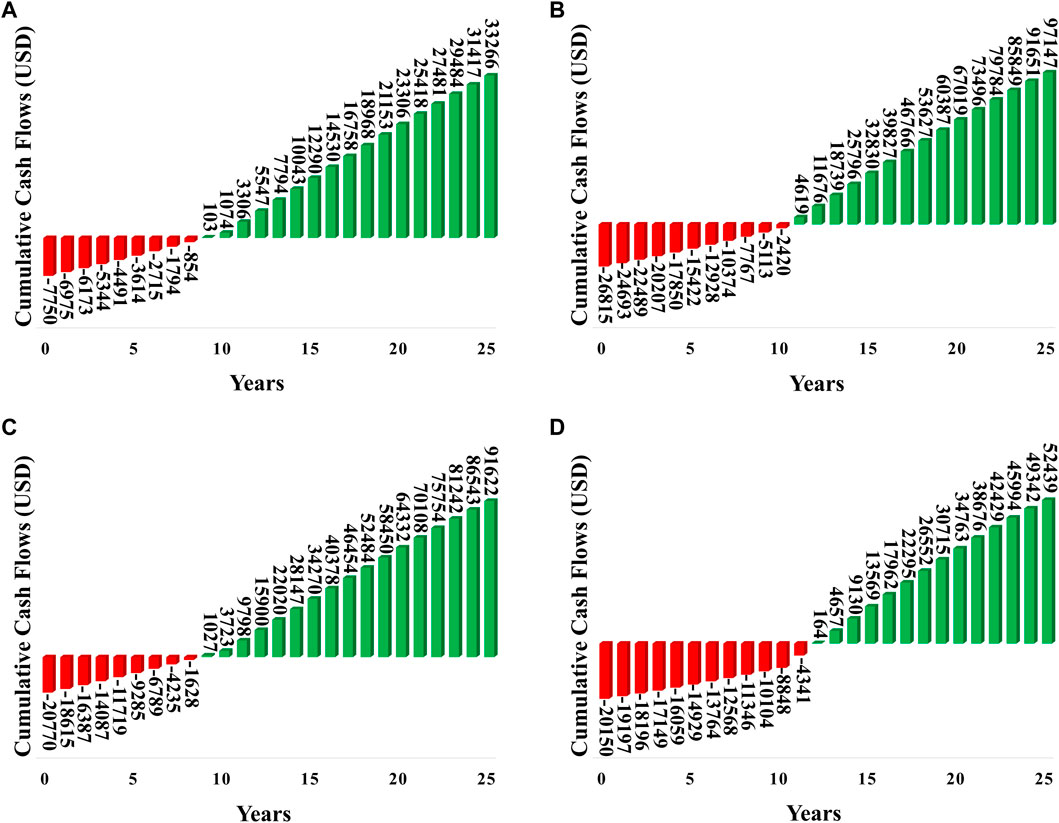
FIGURE 13. Cumulative cash flow for PV projects (A) Multan. (B) Lahore. (C) Sargodha. (D) Rawalpindi.
Financial feasibility analysis reveals that all four sites are economically viable as none of the PV designs violated the set criteria of NPV, IRR, LCOE, and SPBP. Sargodha turns out to be the most economical and financially viable site for having the highest IRR and least values of LCOE and SPBP in comparison to other sites. Rawalpindi site however narrowly fulfills the feasibility criteria with the highest LCOE of 10.5 ¢/kWh and therefore, may become vulnerable to slight variations in input financial parameters. Therefore, to estimate the level of its vulnerability it must be subjected to sensitivity analysis.
Sensitivity analysis determines the degree of uncertainty associated with financial indicators by evaluating a set of technical and financial input variables for a predefined sensitivity range. The sensitivity model provides the user with an option to perform sensitivity analysis for desired financial viability indicators. Two key input variables are chosen then the sensitivity model generates a table illustrating how simultaneous variation in these input variables affects the selected indicator of financial viability. Only the solar PV system at Rawalpindi was considered for sensitivity analysis as technical viability analysis predicted comparatively least potential for this site among others when it comes to annual energy yield.
Also, the indicators of financial viability were found to have values close to the threshold of acceptability making this project susceptible to slight variations in input financial parameters. The NPV of the solar PV project at Rawalpindi was considered the main financial viability indicator and was subjected to sensitivity analysis by varying debt interest rate against annual energy yield by ±25 % for case1 and O&M cost against initial costs, over the same sensitivity range for case 2 as shown in Table 9.
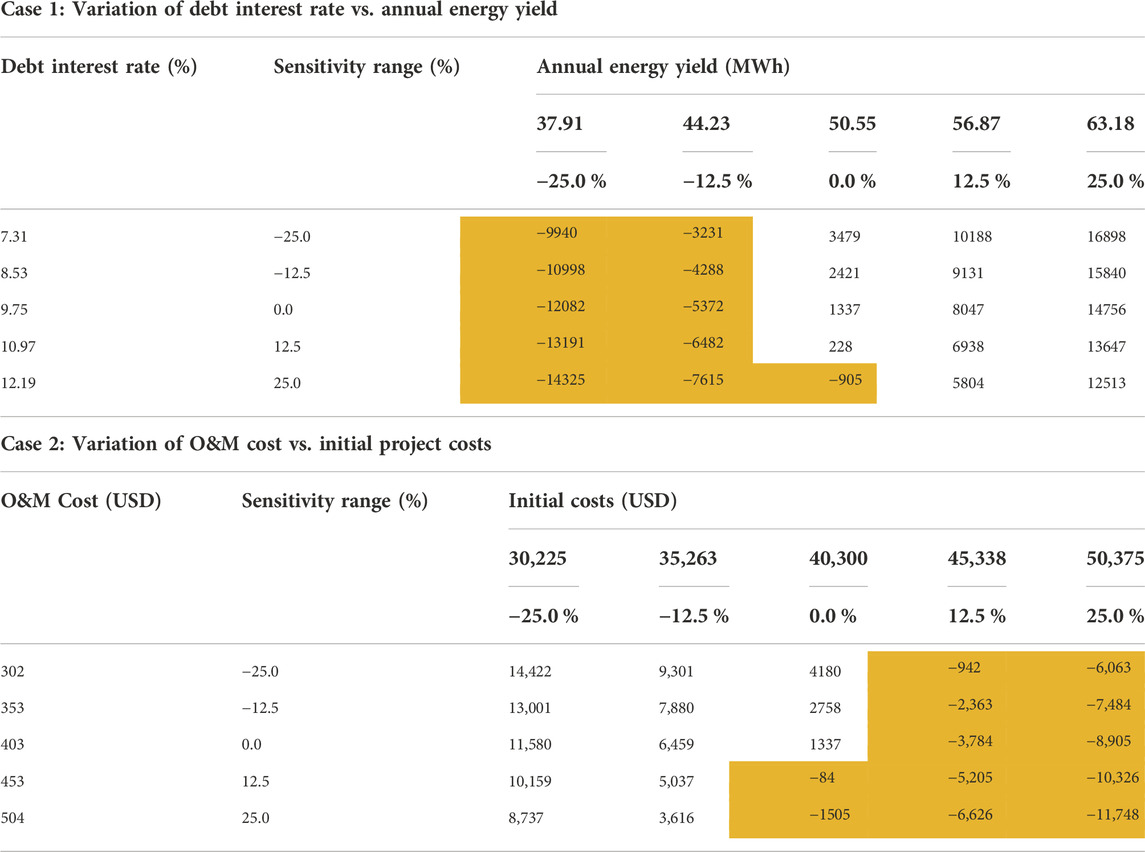
TABLE 9. Sensitivity analysis results for NPV of solar PV project in Rawalpindi.
In the first scenario, the sensitivity model calculates 50.55 MWh annual energy yield but with ±25 % variation, it will be 63.18 MWh and 37.91 MWh respectively. Whereas the actual rate of interest on debt is 9.75 % but with a ±25 % deviation it will be 12.19 % and 7.31 % respectively. Sensitivity analysis was performed to recalculate NPV for multiple combinations of debt interest rate and annual energy yield over a defined ±25 % sensitivity range. The threshold of NPV was chosen zero in sensitivity analysis therefore recomputed values of NPV below this threshold were highlighted with orange color indicating infeasibility of the project for corresponding combinations of input parameters e.g. if annual energy yield attenuates by 25 % from the actual value of 50.55 MWh to 37.91 MWh then even a 25 % reduction of debt interest rate from 9.75 % to 7.31 % will not be sufficient to make the project financially profitable as it will give NPV of -9940 USD. Conversely if annual energy yield swells up to 25 % from the actual value of 50.55 MWh to 63.18 MWh, then even a 25 % increase in debt interest rate from 9.75 % to 12.19 % will not render the project in loss, as it will yield NPV of 12514 USD which is much higher than the threshold of zero. This reflects that NPV is way more sensitive to annual energy yield rather than the debt interest rate.
In the second case, again sensitivity analysis was performed but this time considering O&M cost against the initial costs of the project. Careful analysis of recalculated NPV values reveals that a slight synchronal increment of initial and O&M costs will make this project financially infeasible. The project will be financially viable and sustainable if both the initial and O&M costs stay intact or decrease simultaneously. Also, the general trend of recalculated NPV values shows that the initial project cost is dominant financial viability indicator, as a 12.5% increase in initial cost from 43,300 USD to 45,338 USD makes the project a potential investment loss and even a 25 % reduction in the O&M cost from 403 USD to 302 USD fails to make this project financially viable. Hence, the results of sensitivity analysis confirmed that the PV project designed for the plastic product manufacturing enterprise in Rawalpindi has poor resilience against slight variations in financial input indicators and technical output parameters therefore, investment in this project may turn out to be a potential financial loss.
RETScreen emission analysis worksheet was used to estimate the potential of each proposed facility to contribute toward the mitigation of GHG emissions. The emission worksheet offers three levels of GHG emission analysis however, this research considers level 2 emission analysis. Level 2 analysis allows the user to manually enter the energy mix values to define the base case electricity system. Also, it is required to enter transmission and distribution (T&D) losses in the emission worksheet to model the base case as well as proposed case systems. GHG emission factor as calculated by emission model of 0.474 t
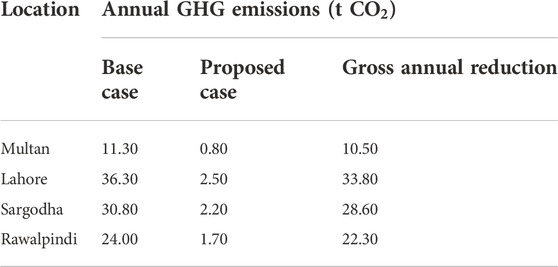
TABLE 10. GHG emission reduction potential of proposed PV projects at selected facility locations.
The solar PV project in Lahore was found to have the highest GHG emission reduction of 33.8 t
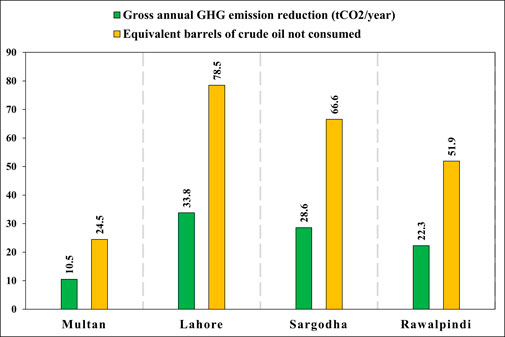
FIGURE 14. Gross annual GHG emission mitigation and equivalent barrels of crude oil not consumed.
To validate simulation results, the performance comparison of all four PV projects was made with solar PV plants installed at different locations as shown in Table 11. The comparative analysis revealed that the specific yield, energy production cost (LCOE), and SPBP of these PV plants closely matched with performance parameters of proposed PV projects which manifests the authenticity of PV system modeling and obtained simulation results.
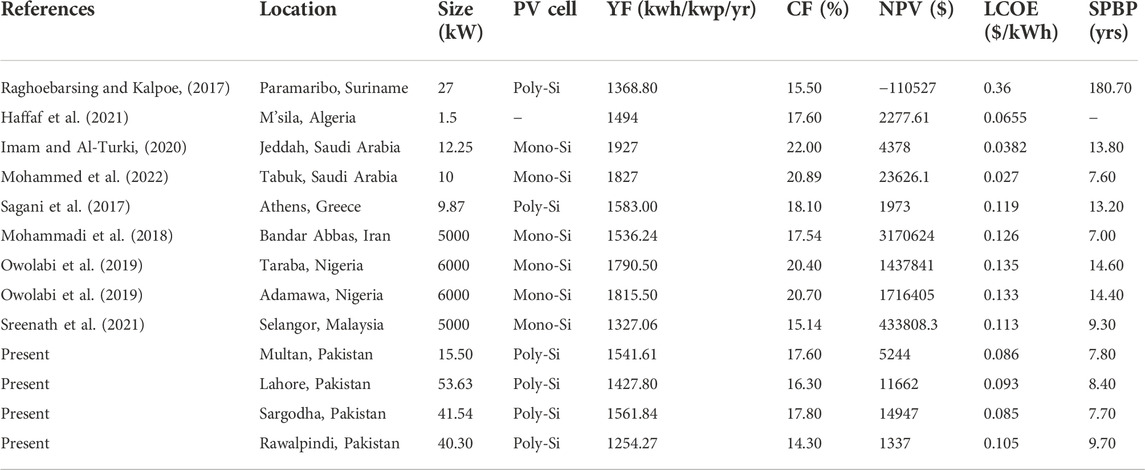
TABLE 11. Performance comparison of grid-connected solar PV plants in different countries.
The findings of the techno-economic feasibility assessment are quite satisfactory and indicate that regions of central and southern Punjab have tremendous solar potential. In the year 2020–21 net industrial energy consumption of Punjab was reported to be 20446.21 GWh/year which is 26.84 % of net provincial energy needs (National Electric Power Regulatory Authority (NEPRA), 2021a). Applying the same research methodology to the whole industrial sector of Punjab suggests 13469 MW of installed solar PV capacity to meet this much energy demand and will mitigate 90,17,581 t
The techno-economic feasibility of installing grid-connected solar photovoltaic power plants in chosen SME sectors of Punjab was evaluated in this study. Making use of actual energy consumption data, grid-tied solar PV system was designed for each representative SME. Subsequently, the techno-economic viability assessment was performed for all four PV projects to calculate annual energy yield, GHG mitigation potential, SPBP, and net profit accumulated at the end of project life, etc. All four facility sites were found to be technically and economically viable for solar PV installation however, Rawalpindi with NPV of 1337 USD showed up least potential compared to Multan, Lahore, and Sargodha with NPV of 5244 USD, 11662 USD, and 14947 USD respectively. Therefore, the PV project in Rawalpindi was subjected to sensitivity analysis to assess its degree of vulnerability against variations in different input parameters. Sensitivity results revealed that the PV project in Rawalpindi was more sensitive to annual energy yield and initial cost compared to interest rate and O&M cost respectively. Also, the results of sensitivity analysis confirmed that reduced initial project cost and an increased annual energy yield significantly mitigate the susceptibility of PV projects against variations in other input parameters. Lastly, the performance indices of each PV design were compared with performance parameters of grid-tied solar PV plants installed at different locations in the world to validate the authenticity of simulation results. Extending the same design methodology to the whole industrial sector of Punjab predicted an installed PV capacity of 13469 MW to meet 20446.21 GWh/year of industrial energy demand and consequently 90,17,581 t
The original contributions presented in the study are included in the article/supplementary material, further inquiries can be directed to the corresponding author.
AA, NU, and SK contributed to conception and design of the study and funded the project. AK and KJ supervised the work. MA performed the statistical analysis. MA wrote the first draft of the manuscript. MA, AA, NU, KJ, AK, wrote sections of the manuscript. All authors contributed to manuscript revision, read, and approved the submitted version.
This research work was performed at National University of Sciences and Technology (NUST), Islamabad, Pakistan and Funded in parts by NUST and Taif University Researchers Supporting Project number (TURSP-2020/121), Taif University, Taif, Saudi Arabia.
Authors from NUST acknowledge the funding support from National University of Sciences and Technology, Islamabad, Pakistan. The authors from Taif University Saudi Arabia, acknowledge the funding of researchers for Supporting Project number (TURSP-2020/121), Taif University, Taif, Saudi Arabia.
The authors declare that the research was conducted in the absence of any commercial or financial relationships that could be construed as a potential conflict of interest.
All claims expressed in this article are solely those of the authors and do not necessarily represent those of their affiliated organizations, or those of the publisher, the editors and the reviewers. Any product that may be evaluated in this article, or claim that may be made by its manufacturer, is not guaranteed or endorsed by the publisher.
Abas, N., Rauf, S., Saleem, M. S., Irfan, M., and Hameed, S. A. (2022). Techno-economic feasibility analysis of 100 MW solar photovoltaic power plant in Pakistan. Technol. Econ. Smart Grids Sustain. Energy 7 (1), 16. doi:10.1007/s40866-022-00139-w
Ahmad, A., Saqib, M. A., Rahman Kashif, S. A., Javed, M. Y., Hameed, A., and Khan, M. U. (2016). Impact of wide-spread use of uninterruptible power supplies on Pakistan’s power system. Energy Policy 98, 629–636. doi:10.1016/j.enpol.2016.09.039
Ahmed, N., Naveed Khan, A., Aslam, A., Imran, K., Sajid, M. B., et al. (2021). Techno-economic potential assessment of mega scale grid-connected PV power plant in five climate zones of Pakistan. Energy Convers. Manag. 237, 1140972021. doi:10.1016/j.enconman.2021.114097
Akbar, R., Bhatti, S. O., Khalil, W. A., Gul, S., and Sajid, M. B. (2020). “Design of an 87 kW photovoltaic system for a university building to support LEED certification,” in 1st International Conference on High Performance Energy Efficient Buildings and Homes (HPEEBH) (Lahore, Pakistan). Available at: http://conferences.uet.edu.pk/hpeebh/2018/.
Ali, S., Bilal, H., Ahmad, A., and Hussain, J. (2020). Major barriers to manufacturing SMEs growth and survival: Evidence from emerging economy Pakistan. Rev. Econ. Dev. Stud. 6 (4), 845–856. doi:10.47067/reads.v6i4.284
Arshad, M. Z., Khan, W. A., Arshad, M. A., Ali, M., Shahdan, A. N., and Ishak, W. Z. A. (2020). Importance and challenges of SMEs: A case of Pakistani SMEs. J. Res. Lepid. 51 (1), 701–707. doi:10.36872/lepi/v51i1/301064
Arshad, N., and Ali, U. (2017). An analysis of the effects of residential uninterpretable power supply systems on Pakistan’s power sector. Energy sustain. Dev. 36, 16–21. doi:10.1016/j.esd.2016.09.004
Arto, I., Capellán-Pérez, I., Lago, R., Bueno, G., and Bermejo, R. (2016). The energy requirements of a developed world. Energy sustain. Dev. 33, 1–13. doi:10.1016/j.esd.2016.04.001
Asad, M., Mahmood, F. I., Baffo, I., Mauro, A., and Petrillo, A. (2022). The cost benefit analysis of commercial 100 MW solar PV: The plant quaid-e-azam solar power pvt ltd. Sustainability 14 (5), 2895. doi:10.3390/su14052895
Aurora, (2021). How to choose right size solar power inverter. aurorasolar.com. Available at: https://www.aurorasolar.com/blog/choosing-the-right-size-inverter-for-your-solar-design-a-primer-on-inverter-clipping/ (accessed Sep. 25, 2021).
Ayadi, O., Al-Assad, R., and Al Asfar, J. (2018). Techno-economic assessment of a grid connected photovoltaic system for the University of Jordan. Sustain. Cities Soc. 39, 93–98. doi:10.1016/j.scs.2018.02.011
Babar, A. H. K., Ali, Y., and Khan, A. U. (2021). Moving toward green mobility: Overview and analysis of electric vehicle selection, Pakistan a case in point. Environ. Dev. Sustain. 23 (7), 10994–11011. doi:10.1007/s10668-020-01101-5
Bila, M., Opathella, C., and Venkatesh, B. (2016). Grid connected performance of a household lithium-ion battery energy storage system. J. Energy Storage 6, 178–185. doi:10.1016/j.est.2016.04.001
Bukar, A. L., Modu, B., Gwoma, Z. M., Mustapha, M., Buji, A. B., Lawan, M. B., et al. (2017). Economic assessment of a pv/diesel/battery hybrid energy system for a non-electrified remote village in Nigeria. Eur. J. Eng. Technol. Res. 2 (1), 21–31. doi:10.24018/ejeng.2017.2.1.252
Bukar, A. L., Tan, C. W., Lau, K. Y., and Dahiru, A. T. (2020). Optimal planning of hybrid photovoltaic/battery/diesel generator in ship power system. Int. J. Power Electron. Drive Syst. 11 (3), 1527. doi:10.11591/ijpeds.v11.i3.pp1527-1535
Bukhari Institute of Public Policy (BIPP) (2021). Cost of loadshedding to small-scale industry. sjbipp.org Available at: http://www.sjbipp.org/publications/PR/projectreport/PR-30-16.pdf (accessed Aug. 28, 2021).
Canadian Solar (2022a). Three phase string inverter 12-20 KW. www.canadiansolar.com https://bit.ly/3BW0gJQ. (accessed Jan. 28, 2022).
CanadianSolar (2022b). Canadian solar max power CS6X- 310P datasheet. Available at: https://bit.ly/3oXvZmu (accessed Jan. 28, 2022).
Chandel, M., Agrawal, G. D., Mathur, S., and Mathur, A. (2014). Techno-economic analysis of solar photovoltaic power plant for garment zone of Jaipur city. Case Stud. Therm. Eng. 2, 1–7. doi:10.1016/j.csite.2013.10.002
El-Shimy, M. (2009). Viability analysis of PV power plants in Egypt. Renew. Energy 34 (10), 2187–2196. doi:10.1016/j.renene.2009.01.010
Evans, D. L. (1981). Simplified method for predicting photovoltaic array output. Sol. Energy 27 (6), 555–560. doi:10.1016/0038-092X(81)90051-7
Haffaf, A., Lakdja, F., Ould Abdeslam, D., and Meziane, R. (2021). Solar energy for air conditioning of an office building in a case study: Techno-economic feasibility assessment. Renew. Energy Focus 39, 148–162. doi:10.1016/j.ref.2021.09.002
Ikoiwak, E. A., Big-aloba, A., and Wofuru, I. (2021). Design and simulation of an on-grid photovoltaic system. Int. J. Eng. Innov. Res. 3 (1), 20–28. doi:10.47933/ijeir.758978
Ikram, H., Javed, A., Mehmood, M., Shah, M., Ali, M., and Waqas, A. (2021). Techno-economic evaluation of a solar PV integrated refrigeration system for a cold storage facility. Sustain. Energy Technol. Assessments 44, 101063. doi:10.1016/j.seta.2021.101063
Imam, A. A., and Al-Turki, Y. A., (2020). Techno-economic feasibility assessment of grid-connected PV systems for residential buildings in Saudi arabia—a case study. Sustainability 12 (1), 262. doi:10.3390/su12010262
Isa, N. M., Bukar, A. L., Wei, T. C., and Marwanto, A. (2019). Optimal sizing of hybrid fuel cell and PV employing hybrid PSO-ga.” in IEEE Conference on Energy Conversion, Yogyakarta, Indonesia, 16–17 October 2019 (CENCON), 159–164. doi:10.1109/CENCON47160.2019.8974742
Kebede, K. Y. (2015). Viability study of grid-connected solar PV system in Ethiopia. Sustain. Energy Technol. Assessments 10, 63–70. doi:10.1016/j.seta.2015.02.003
Khalid, A., and Junaidi, H. (2013). Study of economic viability of photovoltaic electric power for Quetta--Pakistan. Renew. energy 50, 253–258. doi:10.1016/j.renene.2012.06.040
Khan, S., Rashid, M., Husain, M. A., Rahim, A., and Shah, S. U. (2020). Potential & current status of solar energy in Pakistan policy, planning & strategy. Plan. Strategy 07, 98–108. doi:10.34259/ijew.20.70298108
Malik, S., Qasim, M., Saeed, H., Chang, Y., and Taghizadeh-Hesary, F. (2020). Energy security in Pakistan: Perspectives and policy implications from a quantitative analysis. Energy Policy 144, 111552. doi:10.1016/j.enpol.2020.111552
Marcy, C. (2021). Solar plants typically install more panel capacity relative to their inverter capacity. Available at: https://www.eia.gov/todayinenergy/detail.php/id=35372 (accessed Sep. 25, 2021).
Mayes, N. (2022). Southwestern states have better solar resources and higher solar PV capacity factors. Available at: https://www.eia.gov/todayinenergy/detail.php/id=39832 (accessed Sep. 17, 2022).
Mehmood, F., Umar, M., Dominguez, C., and Kazmi, H. (2022). The role of residential distributed energy resources in Pakistan’s energy transition. Energy Policy 167, 113054. doi:10.1016/j.enpol.2022.113054
Mohammadi, K., Naderi, M., and Saghafifar, M. (2018). Economic feasibility of developing grid-connected photovoltaic plants in the southern coast of Iran. Energy 156, 17–31. doi:10.1016/j.energy.2018.05.065
Mohammed, A., Ghaithan, A., Al-Hanbali, A., Attia, A. M., Saleh, H., and Alsawafy, O. (2022). Performance evaluation and feasibility analysis of 10 kWp PV system for residential buildings in Saudi Arabia. Sustain. Energy Technol. Assessments 51, 101920. doi:10.1016/j.seta.2021.101920
National Electric Power Regulatory Authority (Nepra), (2021). Consumer-end applicable tariff. Available at: https://nepra.org.pk/consumer affairs/Electricity Bill.php (accessed Dec. 24, 2021).
National Electric Power Regulatory Authority (Nepra), (2022). Indicative generation capacity expansion plan. Available at: https://nepra.org.pk/Admission Notices/2021/06 June/IGCEP 2021.pdf (accessed Feb 19, 2022).
National Electric Power Regulatory Authority (Nepra) (2021). State of industry reports. Available at: https://nepra.org.pk/publications/State of Industry Reports/State of Industry Report 2021.pdf (accessed Nov 22, 2021).
Nawaz, S. M. N., and Alvi, S. (2018). Energy security for socio-economic and environmental sustainability in Pakistan. Heliyon 4 (10), e00854. doi:10.1016/j.heliyon.2018.e00854
Nkuriyingoma, O., Özdemir, E., and Sezen, S. (2022). Techno-economic analysis of a PV system with a battery energy storage system for small households: A case study in Rwanda. Front. Energy Res. 10, 57564. doi:10.3389/fenrg.2022.957564
Obeng, M., Gyamfi, S., Derkyi, N. S., Kabo-bah, A. T., and Peprah, F. (2020). Technical and economic feasibility of a 50 MW grid-connected solar PV at UENR Nsoatre Campus. J. Clean. Prod. 247, 1191592020. doi:10.1016/j.jclepro.2019.119159
Owolabi, A. B., Nsafon, B. E. K., Roh, J. W., Suh, D., and Huh, J.-S. (2019). Validating the techno-economic and environmental sustainability of solar PV technology in Nigeria using RETScreen Experts to assess its viability. Sustain. Energy Technol. Assessments 36, 100542. doi:10.1016/j.seta.2019.100542
Qazi, U., Iqbal, S., Zaheer, H., and Tauseef Ur, R. (2020). Prepaid metering: A way forward for sustainable power sector in Pakistan. Energy Strategy Rev. 31, 1005462020. doi:10.1016/j.esr.2020.100546
Quick Stats (2021). Punjab portal, Available at: https://www.punjab.gov.pk/punjab_quick_stats (accessed Sep 04, 2021).
Raghoebarsing, A., and Kalpoe, A. (2017). Performance and economic analysis of a 27 kW grid-connected photovoltaic system in Suriname. IET Renew. Power Gener. 11 (12), 1545–1554. doi:10.1049/iet-rpg.2017.0204
Rauf, A., Shakir, S., Ncube, A., Abd-ur-Rehman, H. M., Janjua, A. K., Khanum, S., et al. (2022). Prospects towards sustainability: A comparative study to evaluate the environmental performance of brick making kilns in Pakistan. Environ. Impact Assess. Rev. 94, 106746. doi:10.1016/j.eiar.2022.106746
Retscreen International Clean Energy Decision Support Centre (Canada) (2005). Clean energy project analysis, RETScreen engineering cases textbook. 3rd ed. Canada: CANMET Energy Technology Centre.
Sagani, A., Mihelis, J., and Dedoussis, V. (2017). Techno-economic analysis and life-cycle environmental impacts of small-scale building-integrated PV systems in Greece. Energy Build. 139, 277–290. doi:10.1016/j.enbuild.2017.01.022
Small and Medium Enterprises Development Authority (SMEDA) (2022). Commercial embroidery unit. smeda.org. Available at: https://bit.ly/3QRckzV (accessed Jun 15, 2021).
Small and Medium Enterprises Development Authority (SMEDA) (2021). Industry support program. smeda.org. Available at: https://smeda.org/index.php?option=com_content&view=article&id=16&Itemid=118 (accessed Mar 15, 2021).
Small and Medium Enterprises Development Authority (SMEDA) (2021). Marble tiles manufacturing unit. smeda.org. Available at: https://bit.ly/3qL2tBe (accessed Dec 19, 2021).
Small and Medium Enterprises Development Authority (SMEDA) (2022). Plastic products manufacturing. Rawalpindi: smeda.org. Available at: https://bit.ly/3BS0bqt. (accessed Jun 19, 2022).
Small and Medium Enterprises Development Authority (SMEDA) (2022). Rock salt. Sargodha: smeda.org. Available at: https://bit.ly/3S6rmDi. (accessed March 19, 2022)
Sreenath, S., Sudhakar, K., and Yusop, A. F. (2021). 7E analysis of a conceptual utility-scale land-based solar photovoltaic power plant. Energy 219, 119610. doi:10.1016/j.energy.2020.119610
Taner, T. (2019). A flow channel with nafion membrane material design of PEM fuel cell. J. Therm. Eng. 5 (5), 456–468. doi:10.18186/thermal.624085
Taner, T. (2015). Energy and exergy analyze of PEM fuel cell: A case study of modeling and simulations. Energy 5 (3), 284–294. doi:10.1016/j.energy.2017.10.102
Taner, T. (2018). Energy and exergy analyze of PEM fuel cell: A case study of modeling and simulations. Energy 143, 284–294. doi:10.1016/j.energy.2017.10.102
Taner, T., Naqvi, S. A. H., and Ozkaymak, M. (2019). Techno-economic analysis of a more efficient hydrogen generation system prototype: A case study of PEM electrolyzer with Cr-C coated SS304 bipolar plates. Fuel Cells 19 (1), 19–26. doi:10.1002/fuce.201700225
Taner, T. (2015). Optimisation processes of energy efficiency for a drying plant: A case of study for Turkey. Appl. Therm. Eng. 80, 247–260. doi:10.1016/j.applthermaleng.2015.01.076
Taner, T., and Sivrioglu, M. (2017). A techno-economic & cost analysis of a turbine power plant: A case study for sugar plant. Renew. Sustain. Energy Rev. 78, 722–730. doi:10.1016/j.rser.2017.04.104
Taner, T., and Sivrioglu, M. (2015). Energy–exergy analysis and optimisation of a model sugar factory in Turkey. Energy 93, 641–654. doi:10.1016/j.energy.2015.09.007
Taner, T., Sivrioğlu, M., Topal, H., Dalkılıç, A. S., and Wongwises, S. (2018). A model of energy management analysis, case study of a sugar factory in Turkey. Sādhanā 43 (3), 42. doi:10.1007/s12046-018-0793-2
Taner, T. (2017). The micro-scale modeling by experimental study in PEM fuel cell. J. Therm. Eng. 3 (6), 1515–1526. doi:10.18186/journal-of-thermal-engineering.331755
THE WORLD BANK (2022). Access to electricity (% of population). Pakistan. Available at: https://data.worldbank.org/indicator/EG.ELC.ACCS.ZS?end=2019&locations=PK&start=2019&view=bar. (accessed March 19, 2022)
WORLD ENERGY COUNCIL, 2022, “Energy trilemma index,” Available at: https://trilemma.worldenergy.org/reports/main/2021/World Energy Trilemma.Index.2021.pdf (accessed Feb. 20, 2022).
Yasmeen, H., Wang, Y., Zameer, H., and Solangi, Y. A. (2019). Does oil price volatility influence real sector growth? Empirical evidence from Pakistan. Energy Rep. 5, 688–703. doi:10.1016/j.egyr.2019.06.006
Zidane, T. E. K., Zali, S. M., Adzman, M. R., Tajuddin, M. F. N., and Durusu, A. (2021). PV array and inverter optimum sizing for grid-connected photovoltaic power plants using optimization design. J. Phys. Conf. Ser. 1878 (1), 012015. doi:10.1088/1742-6596/1878/1/012015
Zubi, G., Dufo-López, R., Pardo, N., and Pasaoglu, G. (2016). Concept development and techno-economic assessment for a solar home system using lithium-ion battery for developing regions to provide electricity for lighting and electronic devices. Energy Convers. Manag. 122, 439–448. doi:10.1016/j.enconman.2016.05.075
λp Miscellaneous PV array losses
D Days of autonomy
IG Incentive and grants
n Specific year
N Project life
r Discount rate
S Area occupied by the PV array
SME Small and medium enterprise
UPS Uninterruptible power supply
USD United States Dollar
NTDC National Transmission and Dispatch Company
NEPRA National Electric Power Regulatory Authority
NASA National Aeronautics and Space Administration
NOCT Nominal operating cell temperature
PGF Panel generation factor
ILR Inverter loading ratio
tCO2 Tons of carbon dioxide
PV Photovoltaic
O&M Operation and maintenance cost
EIA Energy information administration
T&D Transmission and distribution
YF Yield factor
CF Capacity factor
NPV Net present value
IRR Internal rate of return
SPBP Simple payback period
LCOE Levelized cost of electricity
GDP Gross domestic product
GHG Greenhouse gas
Ah Ampere-hour
BC Battery Capacity
DoD Depth of discharge
toe Tons of oil equivalent
Keywords: small and medium enterprise (SME), greenhouse gas (CH4), techno-economic analysis, solar photovoltaic, grid-connected PV system
Citation: Ahmad M, Khattak A, Kashif Janjua A, Alahmadi AA, Salman Khan M and Ullah N (2022) Techno-economic feasibility analyses of grid- connected solar photovoltaic power plants for small scale industries of Punjab, Pakistan. Front. Energy Res. 10:1028310. doi: 10.3389/fenrg.2022.1028310
Received: 25 August 2022; Accepted: 28 September 2022;
Published: 14 November 2022.
Edited by:
Chee Wei Tan, University of Technology Malaysia, MalaysiaReviewed by:
Tolga Taner, Aksaray University, TurkeyCopyright © 2022 Ahmad, Khattak, Kashif Janjua, Alahmadi, Salman Khan and Ullah. This is an open-access article distributed under the terms of the Creative Commons Attribution License (CC BY). The use, distribution or reproduction in other forums is permitted, provided the original author(s) and the copyright owner(s) are credited and that the original publication in this journal is cited, in accordance with accepted academic practice. No use, distribution or reproduction is permitted which does not comply with these terms.
*Correspondence: Abraiz Khattak, YWJyYWl6QHVzcGNhc2UubnVzdC5lZHUucGs=
Disclaimer: All claims expressed in this article are solely those of the authors and do not necessarily represent those of their affiliated organizations, or those of the publisher, the editors and the reviewers. Any product that may be evaluated in this article or claim that may be made by its manufacturer is not guaranteed or endorsed by the publisher.
Research integrity at Frontiers
Learn more about the work of our research integrity team to safeguard the quality of each article we publish.