 Yundai Xu1
 Sheng Xiang
94% of researchers rate our articles as excellent or good
Learn more about the work of our research integrity team to safeguard the quality of each article we publish.
Find out more
ORIGINAL RESEARCH article
Front. Energy Res., 06 January 2023
Sec. Smart Grids
Volume 10 - 2022 | https://doi.org/10.3389/fenrg.2022.1024282
This article is part of the Research TopicData-Driven Situational Awareness and Decision Making for Smart Grid OperationView all 17 articles
The active distribution network (ADN) shows great potential for use in network restoration services, given its ability to actively control the network topology, distributed generation (DG) outputs, and demand response (DR) resources. However, its utility may be limited due to the geographical dispersion of DG and DR resources when applied to natural disasters such as windstorms, earthquakes, and floods. In addition, the increasing use of renewable energy creates fluctuations and uncertainties, hindering ADNs from realizing reliable energy scheduling during disasters. Mobile energy storage system (MESS) fleets can be used to economically provide flexible emergency power supply for network restoration services. MESSs can also hedge against load and DG output forecast risks. This article proposes a novel coordinated network reconfiguration and MESS fleets dispatching model considering the uncertainty in DG output and load forecasts to increase the resilience of the ADN after disasters. The MESS traveling strategy is modeled by an extended transit delay model. Then, a novel deterministic network restoration model incorporating the MESS, stationary energy storage system, DG, DR, and network reconfiguration is proposed and programmed using mixed-integer linear programming. Then, an ellipsoidal uncertainty set is employed to describe the uncertainty of load and DG output forecasts, and a robust network restoration model is proposed based on the deterministic one. The proposed deterministic and robust network restoration models are verified on a 59-bus rural distribution system in China.
Recently, extreme weather disasters have posed unprecedented challenges to power grids, especially distribution networks. For example, in the event of a bus failure owing to an earthquake, the distribution network cannot restore the network without load shedding. Therefore, the demand for flexible and resilient distribution network technology is rising to prevent blackouts and irreparable economic and social impacts.
Compared to traditional distribution networks, active distribution networks (ADNs) are able to achieve higher reliability and resilience via advanced active distribution network management (ADNM) schemes (Kabirifar et al., 2019). In an ADN, faults can be actively isolated via transforming the status of the switches and network topology (Chen et al., 2016). Furthermore, with the interconnection of high-penetration distribution generation (DG), the ADN can temporarily recover the power supply of essential blackout areas (Han et al., 2019).
Recently, several studies have been conducted to improve network resilience. Salimi et al. (2020) introduced the information gap decision theory to assist distribution system operators (DNO) when extreme events occur. Esfahani et al. (2020) presented a resilience-oriented operation scheduling model for ADN against windstorms. Gholami et al. (2016) utilized a microgrid (MG) to mitigate the load shedding of contingencies, and the dynamic network reconfiguration showed great potential for load recovery. Many studies have highlighted the use of energy storage for restoring loads. Energy storage can provide stable and critical power when a disaster occurs. However, stationary energy storage in the literature relies on the integrity of the power grid, which may be unreliable when extreme events occur.
Mobile energy storage system (MESS) fleets provide a flexible and inexpensive option in terms of mobility and flexibility (Wang et al., 2022). The MESS is a utility-scale storage bank (e.g., lithium-ion batteries) that is fully controlled by the utility. When a severe fault occurs, the DNO can schedule MESSs to move between different positions for service restoration (Abdeltawab and Mohamed, 2017). Compared with aggregated electric vehicles (EVs) owned by residents or third parties, the MESS is more reliable and more accessible to schedule, which is critical for network restoration. Kim and Dvorkin (2019) proposed an investment model that includes a joint allocation and operation strategy for an MESS with microgrids. Huang et al. (2020) used an MESS to mitigate voltage violations. Prabawa and Choi (2020) provided a multiagent framework for coordinating switches, distributed generators, and static/mobile energy storage systems for network restoration. Mirzaei et al. (2020) employed MESSs in a railway system. Dabbaghjamanesh et al. (2021) considered the idea of MESSs for coastal distribution grids and used mobile marine microgrids to maximize the distribution grid resiliency. Abdeltawab and Mohamed (2017) proposed a day-ahead energy management system (EMS) for the MESS, which aims to minimize the cost of importing electricity from the grid. Jiang et al. (2021) proposed a two-step optimal allocation model to obtain the optimal allocation (location and size) of a stationary energy storage system (SESS) and an MESS to improve network resilience.
Nevertheless, the uncertainty that comes from the real world sets tremendous obstacles to restoration tasks (Peng et al., 2020). In the real world, fluctuating DG outputs, time-varying load demands, and estimation errors of loads are the three significant sources of uncertainty in ADN restoration. Regarding the corresponding uncertainty risks, poor restoration performance may result in uncertain conditions when using a deterministic model, even leading to failures under some restoration strategies because of the violation of security constraints. Sekhavatmanesh and Cherkaoui (2020) proposed a new formulation for the reconfiguration problem with a limited number of reconfiguration steps according to DG start-up requirements. Yao et al. (2020) proposed a rolling optimization framework of MESS to fulfill service restoration with both uncertainties from the traffic system and load forecasting. Liu et al. (2021) considered the uncertain temporal-spatial distribution of traffic flows, along with traffic congestion and its impacts, in MESS scheduling. However, the study by Yao et al. (2020) and Liu et al. (2021) did not consider the uncertainty of the DG output, thus, did not provide a robust and reliable restoration scheme.
In this context, this study aims to bridge the gap in the coordination of MESSs, DG outputs, microgrids, and ADNM strategies (i.e., network reconfiguration, SVC adjustment, and demand response), considering the uncertainty from both the DG output and load demand forecast. The operation of MESSs, DGs, and distribution networks is formulated as a two-stage robust optimization problem, where the uncertainties of the load demands and DG outputs are depicted using ellipsoidal uncertainty sets. In the first stage, the vehicle scheduling problem of MESSs is modeled and optimized to harness the flexibility and mobility of the MESSs. Meanwhile, the network configuration is activated to isolate the faults and determine the scale of each microgrid. In the second stage, the actual charging/discharging behaviors of the MESSs and stationary ESSs, the output of the DGs, and responsible load demands are adjusted in accordance with the realized uncertain factors. The major contributions of this study are summarized as follows:
1) A novel network restoration model, which coordinates MESSs, SESSs, network restoration, DG dispatch, and demand response (DR) resources in blackout areas, is proposed to recover the power supply.
2) Furthermore, a robust variant of the proposed coordinated network restoration model is developed. In this robust model, the uncertainty of load and DG output forecast is considered.
The rest of this article is organized as follows: Section 2 introduces the traveling model of MESS fleets; Section 3 presents the formulation of the deterministic and robust network restoration problem, both of them consider DG, DR, SESS, and network reconfiguration; Section 4 displays the case study results from a real 59-bus distribution network system located in Jiangsu, China; at last, the conclusions are presented in Section 5.
Compared with the traditional SESS, which can restore loads only at fixed places, the MESS can travel among MGs to transport energy after major blackouts. See Figure 1 for an example. However, the operation of the MESS is limited by the traffic condition, state of charge (SOC) of the energy storage system carried by the MESS, and travel time between the MG. A detailed traffic and MESS model should be developed to better facilitate the mobility of the MESS. This section introduces the transit delay model (TDM) to briefly represent MESS travel, including the traffic distance matrix and traveling time matrix. Second, the MESS traveling model was laid out, including the parking and traveling states and charging and discharging models.
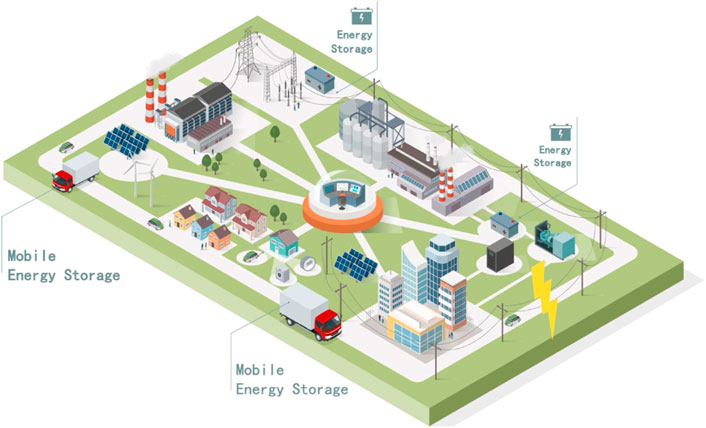
FIGURE 1. Schematic of the post-event network restoration scheme with the MESS.
Because MESSs deliver electrical energy through transportation systems, the traffic model is crucial to the MESS-based restoration service. Here, the transit delay model, which describes the commute time between two stations, is employed to formulate the traveling time.
For a set of nodes
The traveling time τij is also critical to MESS scheduling. The traffic time consists of three parts: commute time
where the function round () rounds the object toward the nearest integer; Vavg denotes the average truck speed; and tins denotes the MESS installation time. Although the MESS operates in plug-and-play mode, connecting the MESS to the grid at the node takes a finite time. Ts denotes the sample time in minutes.
The MESS carries energy storage to travel from where energy is sufficient to where electricity is urgently needed. Because the MESS works on both transportation and power systems, the geographical position and energy should be carefully modeled.
The initial and final state of the MESS is formulated as follows:
where zm,i,t is a binary variable that indicates the position of the MESS in each time period. If the MESS m is at node i at time t, zm,i,t equals one; otherwise, zm,i,t equals zero;
One MESS truck can only be deployed at one node i at time t; that is,
Several logical constraints should be satisfied when the MESS travels in the distribution network.
Eq. 7 defines the binary start and stop state indicators
The battery carried by truck follows similar operation constraints as SESSs, but only charges/discharges when the truck stops at parking lots.
where
Constraint (Eq. 12) denotes the operational logic of the MESS, which means that the MESS is not permitted to charge or discharge when moving. Furthermore, (Eq. 12) limits the maximum charging and discharging powers of the MESS. Eq. 13 summarizes the total MESS power output at node i at time t. Eq. 14 denotes the reactive power output of MESS. In this study, the maximum power factor of MESS is set to 0.9. Eq. 15 sets the primary SOC of the energy storage. Eq. 16 defines the SOC of MESS at time t. Eq. 17 restrains the maximum and minimum SOC to obviate over-charging and over-discharging.
Eq. 13 contains a product term of a binary variable and a continuous variable, which is nonlinear and computationally expensive. Thus, Eq. 13 is linearized using the “Big-M” method, as follows:
where Eqs 18, 19 are the linear variants of Eq. 13.
Compared with existing articles, our model considers the reactive power output of MESS, which provides vital voltage support for the network. It also limits the parking times of the MESS, improving the utilization of energy storage.
The post-event recovery of ADN with MESS intends to achieve an optimal recovery scheme, including network reconfiguration decisions, SESS operation strategy, SVC dispatch, DG control, DR resources dispatch, and the most crucial coordination scheme with the MESS.
When catastrophic failure or significant disturbances occur, ADN can automatically divide the isolated islands so that more loads will be restored to the power supply under the action of high-penetration DG and the cutting-edge ADNM system. Therefore, this section presents the coordinated network restoration model, including distributed SESS, DR resources, SVC, and microgrid, the concrete mathematical expressions are as follows.
To cover as much important load as possible, the restoration model takes the sum of the forecasted power of each bus as the objective function and maximizes it.
In the network restoration progress, the renewable energy-based DG can be used to support active power temporally. In this model, it is natural to assume that all DGs are operated in maximum power point tracking mode to supply more renewable energy. Furthermore, we assume that all DGs are equipped with low-voltage ride-through devices to maintain the power supply in the restoration progress. Because the inverter is connected to the photovoltaic panel, it is supposed that the reactive power output can be continuously adjusted within the set scope. In line with the photovoltaic grid-connected standard, the variation scope of the power factor is set as [−0.95, 0.95] (Wang et al., 2016).
Constraints in Eqs 21, 22 present the active power and reactive power output limits of each DG at time t. The constraint in Eq. 23 denotes the capacity of each DG system.
Eq. 23 is a quadratic constraint, which will increase the calculation time. In order to solve the sub-problem, this article uses a cyclic linearization method to linearize the constraint (Eq. 23). In the cyclic linearization method, two square constraints are employed to approximate the quadratic constraint, see Figure 2. In Figure 2, the blue circle represents the value of

FIGURE 2. Linearization of the circular constraint.
As a flexible reactive power supply in ADN, SVC can adjust swiftly according to the reactive power requirement in the process of restoration, which plays the role of reactive power support.
where
The SESS provides local support to the load demand in faulty areas. The SESS has multiple functions. First, it is the energy supply unit of the important load of the microgrid. Second, it can smooth the fluctuation of DG output and transmit high-quality power to loads.
The constraint in Eq. 26 is the mutually exclusive constraint of ESS, indicating that ESS cannot charge and discharge simultaneously. Eqs 27, 28 are the upper and lower bounds of charge and discharge of SESS. Eq. 29 sets the primary SOC of the SESS. Eq. 30 defines the SOC at time t. Eq. 31 restrains the maximum and minimum SOC.
In this article, the DistFlow equation is used to model the radial grid, and the specific model is as follows:
where
In Eqs 32, 33,
Furthermore, to consider the network reconfiguration and bus failure in the recovery, we use the Big-M method to build a variation of Eqs 35–37.
Eqs 38, 39 are the active and reactive power flow equations, respectively, where bj is the 0–1 variable, indicating whether connected with the grid, and M denotes a large constant. Eq. 40 uses the linearized DistFlow formulation to display the bus voltage drop, cij is the 0–1 variable, which represents the status of the line ij.
The line capacity and bus voltage constraints are considered to make the microgrid and ADN operate normally after restoration.
Eqs 41, 42 constrain the line capacity and bus voltage, respectively. The quadratic form in Eq. 41 can also be approximated using the circular linearization method as follows:
DR can change load demand through a series of incentive measures, which are widely used in ADN. When the power grid is attacked, DR can alleviate the power supply pressure to a certain extent. To display the role of DR in the restoration plan, this article presents an interruptible load modeling scheme, which is the most typical and effective.
where
The abovementioned model should be convenient for coordination and protection based on effectively reducing the short-circuit current. Hence, ADN needs to meet a series of topology constraints during operation. This study uses a virtual network (Lavorato et al., 2012; Ding et al., 2017) to formulate the reconfiguration model, and the radial topology constraint can be equally replaced by the connectivity constraint and the branch number constraint.
In the linearized DistFlow model, a virtual network with the same topology as ADN is added to represent the connectivity constraint. Among them, the power source nodes are regarded as “source” nodes, and the load nodes are considered as “sink” nodes. In this study, we assume that both buses and power lines can be attacked. Therefore, we are supposed to verify whether the bus is in the restored grid.
where
Eqs 50, 51 make sure that the “sink” nodes must connect to at least one “source” node. Eq. 52 connects the fictitious network and the real distribution network.
The branch number constraints are shown in Eqs 55–58, where
The proposed restoration model can control the connections of each bus. In addition, we define variable bi to show whether bus i is powered by the microgrid. It can also obtain the optimal number of microgrids through the value of the variable nMG.
By comparing Eqs 2–22 and Eqs 24–31 and Eq. 38, the deterministic grid reconfiguration model in this study is a mixed-integer linear programming model.
A qualified network restoration scheme should handle the uncertainty of DG output and load forecast. Thus, we introduce a predefined ellipsoidal uncertainty set to describe uncertainty.
The load demand and DG output forecast value can be represented by a combination of its mean value and forecast error as follows:
where
The following ellipsoidal uncertainty set describes the boundary of the forecast error as follows:
where
In this study, we assumed the system error of the forecasted load and forecasted DG output is zero and is subject to multivariate normal distributions. Therefore, the uncertainty budget can be determined by the chi-square distribution using the relation
where
The ellipsoidal uncertainty can be normalized to a sphere by defining
In this section, the original deterministic network restoration model in Section 3.1 is reformatted to a robust optimization model to consider the uncertainty in the network restoration problem.
The robust optimization model can be understood using the “max–min” framework. In the outer layer, the uncertainty is fixed, aiming to maximize the total load in the “worst” scenario. In the inner layer, the uncertainty parameters are regarded as variables, and the aim is to find the “worst” scenario against the outer layer and minimize the total restored loads. The objective function under the “max–min” framework is as follows:
The constraint should also be modified to accommodate the robust optimization model. First, the load demand and DG output in constraints Eq. 23 and Eqs 40, 41 are modified using Eqs 61, 62.
Taking the ellipsoidal uncertainty set into the account, Eqs 68–70 can be further transformed into a set of second-order cone robust counterparts as follows:
The robust coordinated network restoration model, represented by Eqs 2–22, Eqs 27–33, Eqs 71–73, and Eqs 44–58), is formulated using mixed-integer second-order cone programming (MISOCP). However, both the proposed deterministic and robust network restoration models contain numerous binary variables, resulting in high computational costs. Most commercial optimization solvers, such as CPLEX, can solve the proposed model at only a small scale. For practical use, a faster algorithm is required to solve the proposed model.
The proposed models were tested on a 59-bus rural distribution system in Jiangsu, China. The structure of the 59-bus rural distribution system is shown in Figure 3. There are five PV locations in the testing system, each with a 1.5 MW capacity. Two 300 kVar SVCs were set at Nodes 18 and 42. Two ESS are located at bus 16 and bus 38, with one MWh capacity and 0.5 MW maximum charging and discharging power, and 0.9 charging/discharging efficiency. The total load demand of the system is 3.85 MW and 0.97 MVar. There are three types of loads: residential, industrial, and commercial loads. The location of each load is shown in Figure 3. The flexible load, which actively reacts to the DNO, is located at buses four, 16, 22, and 30. Their load curves are consistent with the load on the bus. The maximum scheduling frequency is set to two, and the maximum hour for load scheduling is set to 20 min each time. Referring to the Chinese standard, an example is analyzed with 5 min as an interval and the total restoration time is 2 h. The voltage amplitude of the substation bus is set to 10.5 kV, the base power of the distribution system is set to 50 MW, the base power of the SESS is set to 1 MW, and the voltage scope of all nodes is set to [0.93, 1.07] p. u. In this article, the load is divided into residential, commercial and industrial loads. In the restoration period, the curves of load and forecasted PV output are shown in Figure 4. The covariance of the forecast error is assumed to be one, and there is no correlation between time and space.
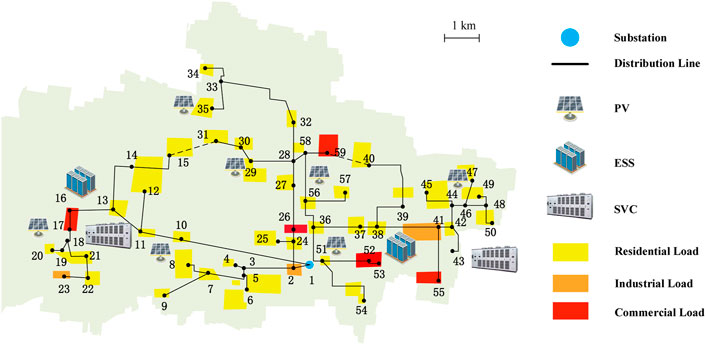
FIGURE 3. Testing the proposed model on the 59-bus rural distribution network.

FIGURE 4. Forecasted load and PV output curves.
The distance between each bus is shown in Figure 5. The maximum distance in Figure 5 is between bus 20 and bus 50, approximately 10,500 m, while the mean distance is approximately 4,110 m. Assume the traveling speed of the MESS truck is 60 km/h (1,000 m/min), the maximum traveling time should be 10 min, and the mean traveling speed should be 4.1 min, accordingly. The MESS installation time is set to 3 min, and the sample time Ts is set to 5 min to consist of the time slot of the load and DG curves.
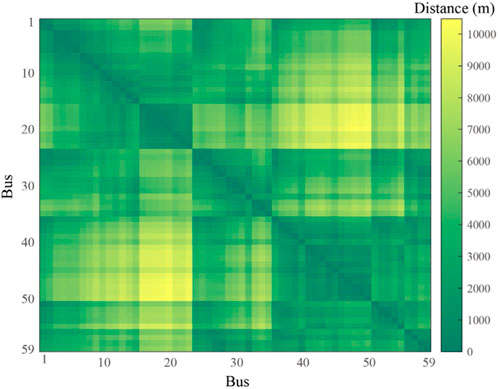
FIGURE 5. Distance matrix of the 59 buses.
In the following text, we assume that two faults occur between buses 2 and 24, and between buses 1 and 10. The deterministic and robust models were tested successively to demonstrate their performances.
We shall first look at the simulation results without considering the uncertainty of DG outputs, that is, the deterministic dispatching model is used to help network restoration. Specifically, the deterministic dispatching model with and without MESS is compared to show the effectiveness of MESS in improving network reliability.
Case A is a benchmark in which no MESS is connected to ADN. In this case, only the ADNM schemes were employed, and two SESS located at buses 16 and 38 were used to help with network restoration.
Figure 6 illustrates the network operation status in Case A. In Figure 6, the black dashed line denotes the microgrids divided by the network reconfiguration scheme and the red dashed line denotes the disconnected lines. As shown in Figure 6, the entire network was divided into two microgrids, while only 45 buses and 43 lines were connected to the grid.

FIGURE 6. Island partition result of Case A.
Figure 7 illustrates the restored load, PV output, and SOC of the SESS in Case A. As shown in Figure 7, the total restored load was 29.031 MWh, and the PV output energy was 21.227 MWh. Based on the SOC curve in Figure 6, the SESS was not fully used in network restoration. In particular, SESS1, located on bus 16, received 1 hour of charging from the PV. Meanwhile, SESS2, located at bus 38, was frequently charging and discharging to maintain a regional energy balance. The proposed model thus can be used for network restoration even if the ADNM scheme is implemented.
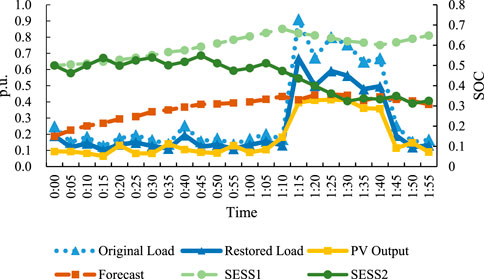
FIGURE 7. Restored load and PV output in Case A.
In Case B, the MESS was employed in the AND. The MESS had a capacity of 0.5 MWh and a 0.5 MW power limit. The initial allocation of the MESS is at bus one. The initial SOC of the MESS was set to 0.8.
Figure 8 illustrates the network operation status of Case B. Unlike the result in Case A, the integrity of the distribution network was preserved, and no microgrid was divided from the original network. In Case B, 47 buses and 46 lines were connected to the grid.
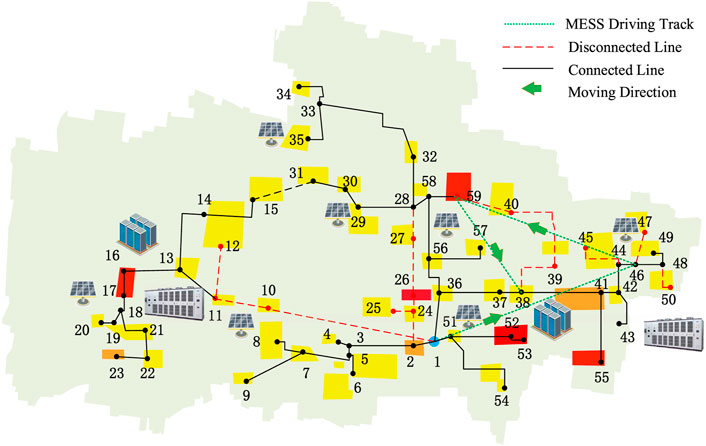
FIGURE 8. Island partition and MESS allocation result of Case B.
Figure 9 illustrates the restored load, PV output, and SOC of the SESS in Case B. As shown in Figure 9, the total restored load was 30.39 MWh, and the PV output energy was 20.221 MWh. It is easy to find that with the assistance of MESS, the restored load in the ADN has been significantly improved. Figure 9 shows the SOC curve of the MESS. Combined with Figures 8, 10, we can see that the MESS travels among nodes one, 46, 59, and 38 at the 1st, 2nd, 16th, and 24th time periods.
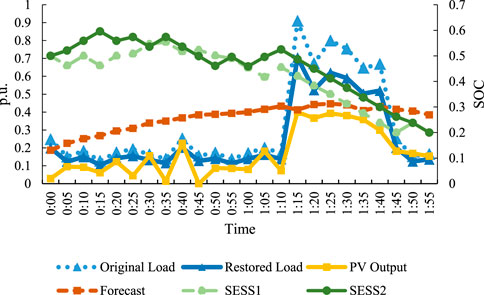
FIGURE 9. Restored load, PV output, and SOC of the SESS in Case B.
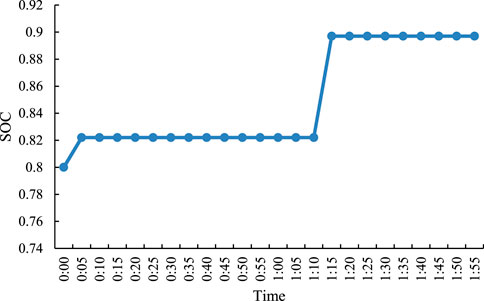
FIGURE 10. SOC result of the MESS in Case B.
Based on the abovementioned analysis, the cooperative work of MESS and network reconfiguration can greatly improve the fault recovery of the distribution network. However, problems such as the uncertainty of PV in actual scenarios inevitably lead to a certain degree of error in the analysis of the entire system. Therefore, the introduction of uncertainty analysis transforms the problem into a robust optimization problem.
First, we consider the case of an uncertainty budget of 10 percent (denoted as RO10), in which the system provides a lower degree of consideration for possible uncertainties. The island partition and the MESS moving track are shown in Figure 11. The restored load, PV output, and SOC of the SESS, as shown in Figure 12. Figure 13 shows the SOC of MESS.
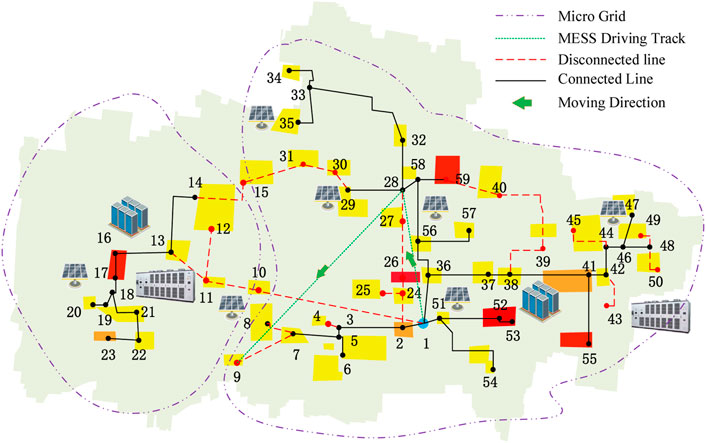
FIGURE 11. Island partition and MESS allocation result of RO10.
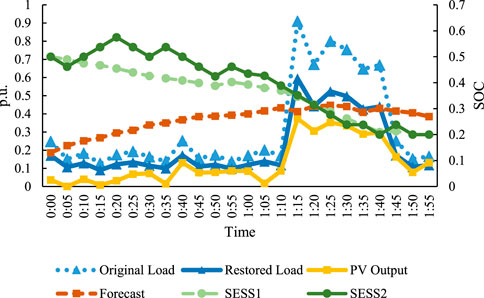
FIGURE 12. Restored load, PV output, and SOC of the SESS in RO10.
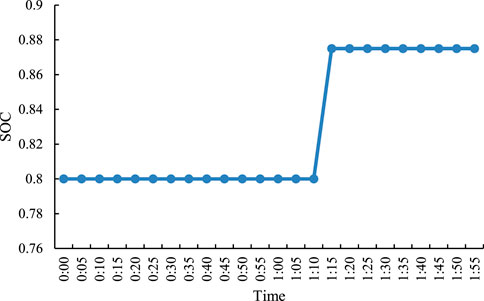
FIGURE 13. SOC result of the MESS in RO10.
In RO10, the network is divided into two parts: 40 nodes and 38 lines in the system are connected to the microgrid. As shown in Figure 12, the total restored load was 25.891 MWh, and the PV output energy was 15.780 MWh. Figure 13 shows the SOC curve of the MESS. Combined with Figures 11, 12, we can see that the MESS travels among nodes 1, 28, and 9 at the 1st, 16th, and 24th time periods.
Compare with the above figs, we can see that the restored load and PV outputs have a significant drop if the uncertainty is considered. Compared with the deterministic model result in Case B, the number of unconnected nodes and unconnected lines also declines greatly. The charging and discharging of MESS were also slightly gentler than those in Case B.
As we can see in RO10, a slight uncertainty can dramatically change the network restoration results. If the uncertainty budget of the system is further increased to 90% (denoted as RO90), a more conservative restoration result can be obtained. The network status at RO90 is shown in Figure 14; the load, PV, and SOC curves are shown in Figure 15.

FIGURE 14. Island partition and MESS allocation result of RO90.
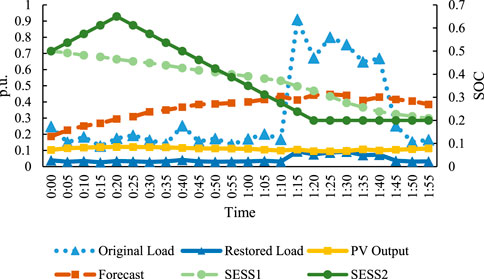
FIGURE 15. Restored load, PV output, and SOC of the SESS in RO90.
It can be seen from Figure 14 that the network is divided into two microgrids; only nine nodes and seven lines of the whole system are connected to the network. Only 5.420 MWh load and 2.00 MWh PV were restored in RO90, even if the SESS is fully used. This is because the PV output is heavily limited under the most conservative condition.
However, considering the uncertainty of the random output of renewable energy also decreases the load-restoration rate. From the results of the robust optimization model, it is not difficult to find that with an increase in the uncertainty budget, the conservatism of the calculation results will also increase, and the system must sacrifice the economy and part of the load to deal with possible extremely bad conditions. During the actual operation of the distribution network, decision makers can choose different uncertainty budgets according to the actual needs of the system.
All algorithms were executed on an HP Z840 workstation with Intel(R) Xeon(R) E5-2650v4 CPUs running at 2.20 GHz and 16 GB RAM. The proposed models were programmed and solved using the general algebraic modeling system (GAMS) software and the commercial solver CPLEX 20.1. The CPU times for the proposed models are presented in Figure 16.
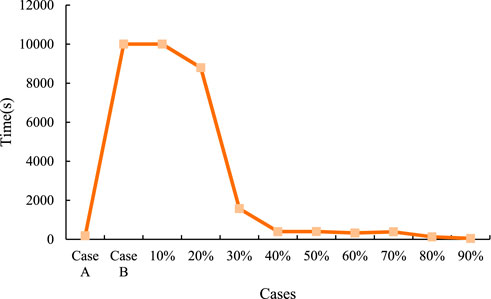
FIGURE 16. Computational time for each case.
As shown in Figure 16, the deterministic model without MESS (Case A) exhibits the best computational performance. When MESS was considered (Case B), the computational time increased significantly. This is because the MESS model contains a large number of binary variables, which require much more time to tackle. The uncertainty set in the robust model reduces the feasible region, which results in a significant reduction in computational time. Furthermore, the computational time generally decreases with an increase in the conservative levels. For a post-event dispatch, the 30% conservative level is recommended to reach a balance between computational burden and robustness.
This article proposed an MESS and ADNM coordinate dispatching model to optimize the restoration load after disasters. The ability of the MESS to move between different locations was exploited to enhance power grid resilience after natural disasters. The proposed optimization is a robust MISOCP employing binary recourse decisions, which account for the relocation of the MESS under DG and load forecast uncertainty. Results of numerical experiments reveal that the coordination of the MESS and ADNM can facilitate network restoration after natural disasters. (Chen et al., 2016).
The datasets presented in this study can be found in online repositories. The names of the repository/repositories and accession number(s) can be found in the article/supplementary material.
YX: analysis and writing. MZ: conceptualization and review. HW: methodology, software, review, and editing. SX: methodology, analysis, and writing. YY: supervision, review, and editing.
Author MZ was employed by the State Grid Shanghai Pudong Electric Power Supply Company.
The remaining authors declare that the research was conducted in the absence of any commercial or financial relationships that could be construed as a potential conflict of interest.
All claims expressed in this article are solely those of the authors and do not necessarily represent those of their affiliated organizations, or those of the publisher, the editors, and the reviewers. Any product that may be evaluated in this article, or claim that may be made by its manufacturer, is not guaranteed or endorsed by the publisher.
Abdeltawab, H. H., and Mohamed, Y. A. I. (2017). Mobile energy storage scheduling and operation in active distribution systems. IEEE Trans. Ind. Electron. 64 (9), 6828–6840. doi:10.1109/TIE.2017.2682779
Chen, X., Wu, W., and Zhang, B. (2016). Robust restoration method for active distribution networks. IEEE Trans. Power Syst. 31 (5), 4005–4015. doi:10.1109/TPWRS.2015.2503426
Dabbaghjamanesh, M., Senemmar, S., and Zhang, J. (2021). Resilient distribution networks considering mobile marine microgrids: A synergistic network approach. IEEE Trans. Ind. Inf. 17 (8), 5742–5750. doi:10.1109/TII.2020.2999326
Ding, T., Lin, Y., Li, G., and Bie, Z. (2017). A new model for resilient distribution systems by microgrids formation. IEEE Trans. Power Syst. 32 (5), 4145–4147. doi:10.1109/TPWRS.2017.2650779
Esfahani, M., Amjady, N., Bagheri, B., and Hatziargyriou, N. D. (2020). Robust resiliency-oriented operation of active distribution networks considering windstorms. IEEE Trans. Power Syst. 35 (5), 3481–3493. doi:10.1109/TPWRS.2020.2977405
Gholami, A., Shekari, T., Aminifar, F., and Shahidehpour, M. (2016). Microgrid scheduling with uncertainty: The quest for resilience. IEEE Trans. Smart Grid 7 (6), 2849–2858. doi:10.1109/TSG.2016.2598802
Han, C., Song, S., Yoo, Y., Lee, J., Jang, G., and Yoon, M. (2019). Optimal operation of soft-open points for high penetrated distributed generations on distribution networks. 2019 10th Int. Conf. Power Electron. ECCE Asia (ICPE 2019 - ECCE Asia), Busan, Korea, May 2019, 806–812. doi:10.23919/ICPE2019-ECCEAsia42246.2019.8796910
Huang, D., Chen, B., Huang, T., Fang, X., Zhang, H., and Cao, J. (2020). Open capacity enhancement model of medium voltage distribution network with mobile energy storage system. IEEE Access 8, 205061–205070. doi:10.1109/ACCESS.2020.3026417
Jiang, X., Chen, J., Zhang, W., Wu, Q., Zhang, Y., and Liu, J. (2021). Two-step optimal allocation of stationary and mobile energy storage systems in resilient distribution networks. J. Mod. Power Syst. Clean Energy 9 (4), 788–799. doi:10.35833/MPCE.2020.000910
Kabirifar, M., Fotuhi-Firuzabad, M., Moeini-Aghtaie, M., and Pourghaderia, N. (2019). Joint distributed generation and active distribution network expansion planning considering active management of network. 2019 27th Iran. Conf. Electr. Eng. (ICEE), Yazd, Iran, May 2019, 702–708. doi:10.1109/IranianCEE.2019.8786665
Kim, J., and Dvorkin, Y. (2019). Enhancing distribution system resilience with mobile energy storage and microgrids. IEEE Trans. Smart Grid 10 (5), 4996–5006. doi:10.1109/TSG.2018.2872521
Lavorato, M., Franco, J. F., Rider, M. J., and Romero, R. (2012). Imposing radiality constraints in distribution system optimization problems. IEEE Trans. Power Syst. 27 (1), 172–180. doi:10.1109/tpwrs.2011.2161349
Liu, X., Soh, C. B., Zhao, T., and Wang, P. (2021). Stochastic scheduling of mobile energy storage in coupled distribution and transportation networks for conversion capacity enhancement. IEEE Trans. Smart Grid 12 (1), 117–130. doi:10.1109/TSG.2020.3015338
Mirzaei, M. A., Hemmati, M., Zare, K., Mohammadi-Ivatloo, B., Abapour, M., Marzband, M., et al. (2020). Two-stage robust-stochastic electricity market clearing considering mobile energy storage in rail transportation. IEEE Access 8, 121780–121794. doi:10.1109/ACCESS.2020.3005294
Peng, H., Wei, N., Li, S., Wang, X., Li, H., and Hu, Y. (2020)., Continuous power flow for hybrid AC/DC microgrid considering uncertainty of intermittent DG output. IET.Conf. Proc., 16th IET Int. Conf. AC D.C. Power Transm, ACDC. London, England: Institution of Engineering and Technology (IET) 2020 (1), 251–258. July 2-3, 2020. doi:10.1049/icp.2020.0108
Prabawa, P., and Choi, D. (2020). Multi-agent framework for service restoration in distribution systems with distributed generators and static/mobile energy storage systems. IEEE Access 8, 51736–51752. doi:10.1109/ACCESS.2020.2980544
Salimi, M., Nasr, M. A., Hosseinian, S. H., Gharehpetian, G. B., and Shahidehpour, M. (2020). Information gap decision theory-based active distribution system planning for resilience enhancement. IEEE Trans. Smart Grid 11 (5), 4390–4402. doi:10.1109/TSG.2020.2992642
Sekhavatmanesh, H., and Cherkaoui, R. (2020). A multi-step reconfiguration model for active distribution network restoration integrating DG start-up sequences. IEEE Trans. Sustain. Energy 11 (4), 2879–2888. doi:10.1109/TSTE.2020.2980890
Wang, S., Chen, S., Ge, L., and Wu, L. (2016). Distributed generation hosting capacity evaluation for distribution systems considering the robust optimal operation of OLTC and SVC. IEEE Trans. Sustain. Energy 7 (3), 1111–1123. doi:10.1109/TSTE.2016.2529627
Wang, W., Xiong, X., He, Y., Hu, J., and Chen, H. (2022). Scheduling of separable mobile energy storage systems with mobile generators and fuel tankers to boost distribution system resilience. IEEE Trans. Smart Grid 13 (1), 443–457. doi:10.1109/TSG.2021.3114303
Yao, S., Wang, P., Liu, X., Zhang, H., and Zhao, T. (2020). Rolling optimization of mobile energy storage fleets for resilient service restoration. IEEE Trans. Smart Grid 11 (2), 1030–1043. doi:10.1109/TSG.2019.2930012
M A large constant in the Big-M method
Keywords: active distribution network, mobile energy storage system, network restoration, resilience, robust optimization
Citation: Xu Y, Zhao M, Wu H, Xiang S and Yuan Y (2023) Coordination of network reconfiguration and mobile energy storage system fleets to facilitate active distribution network restoration under forecast uncertainty. Front. Energy Res. 10:1024282. doi: 10.3389/fenrg.2022.1024282
Received: 21 August 2022; Accepted: 24 October 2022;
Published: 06 January 2023.
Edited by:
Yuchen Zhang, University of New South Wales, AustraliaReviewed by:
Yongxi Zhang, Changsha University of Science and Technology, ChinaCopyright © 2023 Xu, Zhao, Wu, Xiang and Yuan. This is an open-access article distributed under the terms of the Creative Commons Attribution License (CC BY). The use, distribution or reproduction in other forums is permitted, provided the original author(s) and the copyright owner(s) are credited and that the original publication in this journal is cited, in accordance with accepted academic practice. No use, distribution or reproduction is permitted which does not comply with these terms.
*Correspondence: Han Wu, d3VoYW5AaGh1LmVkdS5jbg==
Disclaimer: All claims expressed in this article are solely those of the authors and do not necessarily represent those of their affiliated organizations, or those of the publisher, the editors and the reviewers. Any product that may be evaluated in this article or claim that may be made by its manufacturer is not guaranteed or endorsed by the publisher.
Research integrity at Frontiers
Learn more about the work of our research integrity team to safeguard the quality of each article we publish.