 Min LV1
 Yushuang ZHU
- 1Gas Production Plant, Yanchang Oilfield Oil and Gas Exploration Company, Yan’an, China
- 2State Key Laboratory of Continental Dynamics/Department of Geology, Northwest University, Xi’an, China
Reasonable production allocation of tight sandstone gas reservoirs is an important basis for efficient development of wells. Combining multiple mathematical models, the modified flowing material balance equation was established considering the variation of viscosity and compressibility, and a reasonable production allocation process was developed. The results show that: ① The flow material balance method ignores the change of compressibility, viscosity and deviation coefficient in the calculation. Compared with the results calculated by the material balance method, the results of the flow material balance method are smaller. ② A modified flowing material balance method is established, verified by the production of 670 wells in the study area during stable period. Compared with the open flow rate method, the error of dynamic reserve allocation method is smaller, with an error of 0.07%. ③ When dynamic reserves are used to allocate production, the initial decline rate of wells is reduced by 74.65% on average, the production on stable period increases by 21.28%, and the time increases by 1.79%. This study provides support for dynamic reserve calculation and reasonable production allocation of gas wells in the study area, and has important guiding significance for the formulation of reasonable development plan and economic and efficient development of tight sandstone gas reservoirs.
Introduction
Tight sandstone gas reservoir has poor properties, small porosity, low permeability, strong heterogeneity and complex seepage mechanism, showing strong stress sensitivity during development (Wei et al., 2008; Sun et al., 2018). Reasonable system of well is an important factor affecting economic limit production and ultimate recovery of gas field (Mousavi et al., 2020; Sun et al., 2021). Different from oil reservoir, gas wells are generally depleted (Xu et al., 2019a). In the production process, it is usually necessary to consider multiple influencing factors for reasonable production allocation to maximize the use of reservoir energy, control the pressure drop rate, and ultimately increase the production (Mach et al., 1979; Lu et al., 2019).
Combining geological conditions and binomial productivity equation, R.V.Simth divides gas well production allocation into: OFR (open flow rate method), fixed bottom-hole pressure, and fixed daily production (R.V.Smith, 1989). The OFR is also the most commonly used method at present (Xu et al., 2019b). It generally reflects the seepage characteristics of the formation near the wellbore in the early stage of production (Figure 1). The gas well production is generally 1/5 to 1/3 of the OFR. However, the field production shows that the OFR does not reflect the matrix productivity of the far-well zone, and it is very unreliable as a production allocation method for unconventional tight sandstone gas reservoirs (Xu et al., 2017). Gilbert proposed a nodal analysis method based on the wellbore flow model (Gilbert, 1954). Greene (1989); Hagoort (1992) considered the wellbore transport capacity on the basis of the Gilbert model, respectively, and obtained a reasonable matching relationship between the wellbore flow and gas production. However, the method is complex and still not the most reasonable allocation.

FIGURE 1. Seepage of fractured zone near wellbore in horizontal well.
Based on the MB (material balance method), this study uses the mathematical statistics method to calculate the production of 700 wells during the stable period from the perspective of gas well productivity, describe the relationship between dynamic reserves and production, and establish a simple “reserves-production” allocation model.
Setting
Ordos basin is a large sedimentary basin with multi-cycle evolution and multi-sedimentary types and it is about 25 × 104km2 (Li et al., 2014; He et al., 2021a). The internal structure of the basin is relatively simple, without secondary structure, and the tertiary structure is dominated by nasal uplift (Huang et al., 2020; Kazemi and Ghaedi, 2020). As shown in Figure 2, the study area is located in the southeast of the Yishan slope, where multi-layered rocks are developed, and regional capping layers are widely distributed, which is favorable for the formation and enrichment of gas reservoirs (He et al., 2021b).

FIGURE 2. Location of Yan’an gas field in ordos basin.
Based on the 670 test data, the gas wells are divided into three types according to the classification standard of OFR (Table.1): type I (OFR>10.0 × 10⁴ m3/d), types Ⅱ (4.0–10.0 × 10⁴ m3/d) and type Ⅲ (OFR <4.0 × 10⁴ m3/d).
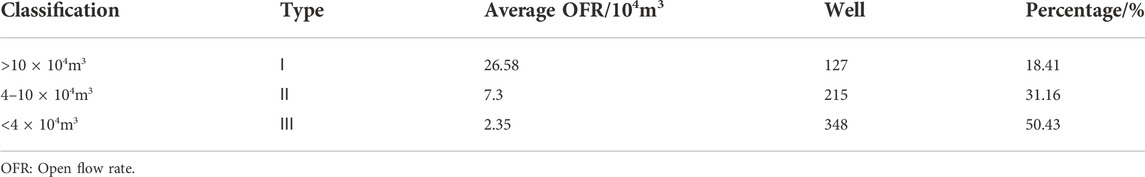
TABLE 1. Classification results of gas wells in study area.
Materials method
At present, the methods for calculating the dynamic reserves of gas wells mainly include MB (material balance method), PAM (production accumulation method) and ETM (elastic two-phase method) (Yu et al., 1996; Zhu, 2009). Since the MB is simple with less data in the calculation, the utilization rate is high.
When there is no bottom hole pressure, the dynamic reserves cannot be gotten with MB (Wu and Li, 2011; Han et al., 2020). In order to solve this problem, Mattar analyzed the flow law based on the perspective of seepage mechanics, and proposed the FMB (flow material balance method). He proposed that the decline of bottom hole pressure and formation pressure was equal for closed gas reservoirs in the same time when the seepage entered the quasi-steady stage. Therefore, the bottom hole pressure and wellhead casing pressure can be used to replace formation pressure in the process of calculating dynamic reserves by MB (Abivin et al., 2008; Abusahmin et al., 2017).
Modified flow material balance method
For a circular closed radial flow reservoir, the seepage law of the quasi-steady stage (Wei et al., 2008):
where,
In the FMB established by Mattar, it is assumed that the pressure has no effect on the properties (viscosity and compressibility) of natural gas (Qiang et al., 2007):
When the reservoir reaches a quasi-steady stage, the data points showing a linear trend are fitted with the Pwf/Zwf and Gn obtained in production and then draw a parallel line through the Pi/Zi. The intercept of the parallel line on the Gn is the dynamic reserves Gi (Figure 3).
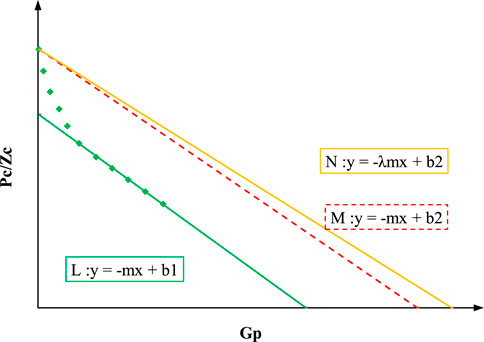
FIGURE 3. Determination of dynamic reserves by modified FMB method.
Based on the natural gas composition in the study area (Table 2), the variation of gas properties with pressure is obtained by mathematical simulation. The results show that the viscosity increases with the pressure (Figure 4), the compressibility decreases with the pressure (Figure 5), and the product of the two decreases with the pressure (Figure 6).
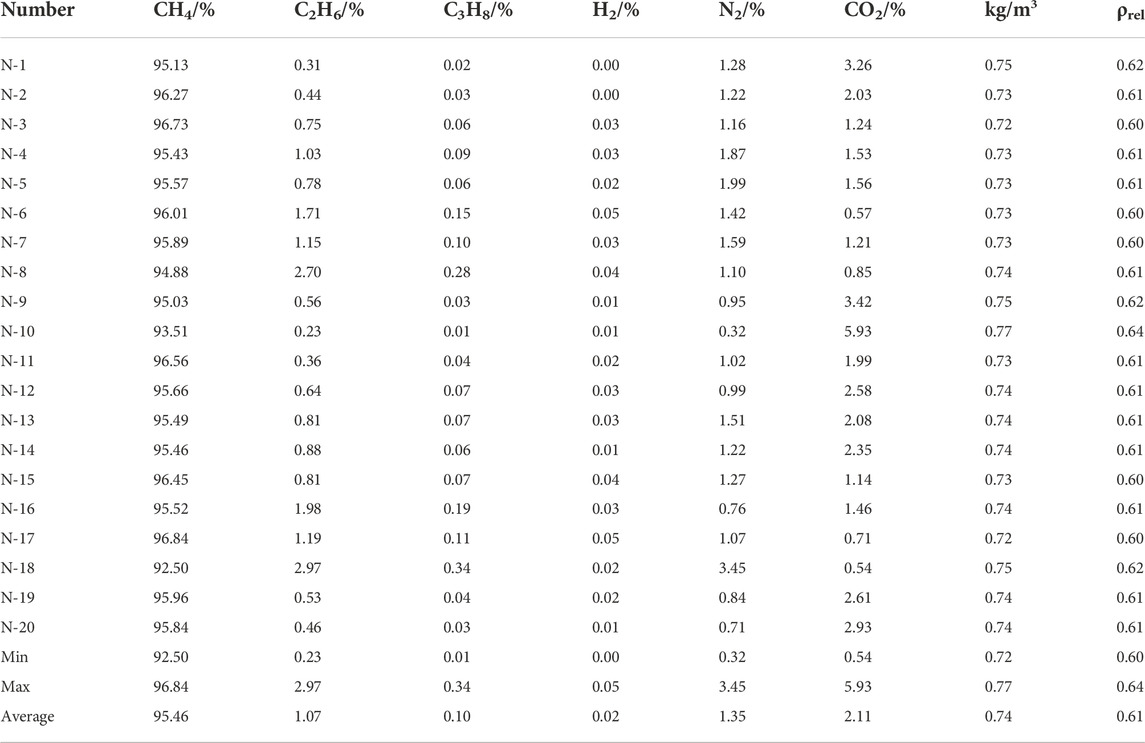
TABLE 2. Natural gas component analysis data of 20 samples.
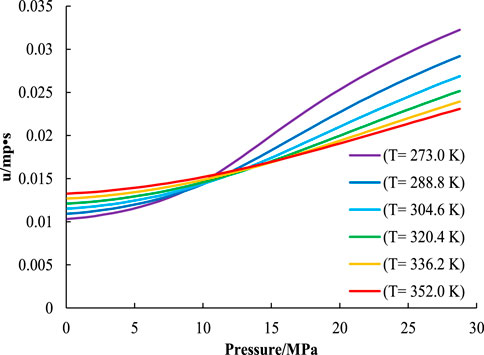
FIGURE 4. Relationship between pressure and viscosity.
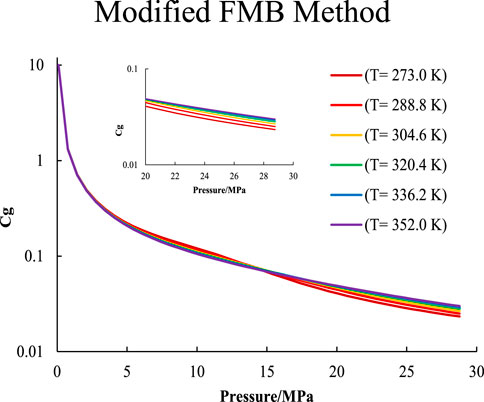
FIGURE 5. Relationship between pressure and compression coefficient.
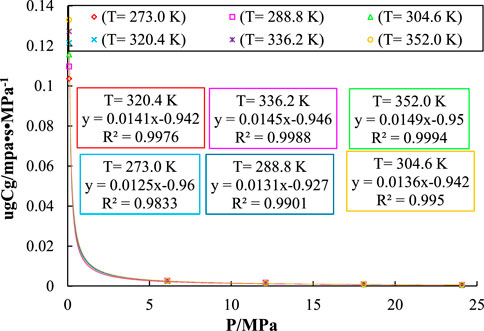
FIGURE 6. Relationship between pressure and μgcg.
Based on the derivation, it is proved that the compressibility and viscosity change with pressure; therefore, there is an error in the calculation of dynamic reserves with the FMB.
The slope of the Pwf/Zw—Gp is greater than that of the
It is assumed that Pwf-pss and
Production allocation method
1) Conventional method
Tight sandstone reservoir with small porosity and low permeability needs SRV (stimulated reservoir volume) to get industrial exploitation (Guo et al., 2018). The volume fracturing will form a complex fracture network near the wellbore, leading to a dual pore medium and the seepage law will change (Jian et al., 2008). The relationship between OFR and daily production in stable period of 670 wells (Figure 7) show that the ratio gradually decreases with the OFR (Figure 8).
2) Dynamic reserves

FIGURE 7. Relationship between OFR and production during stable period.

FIGURE 8. Relationship between distribution coefficient and OFR.
Due to the simple operation of the OFR method, it is often used as a production allocation method in the field. However, the OFR obtained in the early stage of production only represents the seepage law of fluid in the fracture zone or high-permeability area near the wellbore. For tight sandstone reservoirs, this production allocation method has limitations, often resulting in high production allocation and rapid decline in gas well production.
The dynamic reserves are one of the important factors that reflect the stable productivity (Zhou et al., 2022). In this study, the mathematical relationship between gas production and OFR is fitted to establish the calculation method of dynamic reserves of tight sandstone gas reservoirs, and a set of fast and operable ‘one curve, two chart’ reasonable production allocation method is formed. As shown in Figure 9: the conventional method is used to allocate production to the gas well in the early stage (A); after a period of production, the dynamic reserves of single well (B) are obtained. Finally, the (C) chart is used for reasonable production allocation.
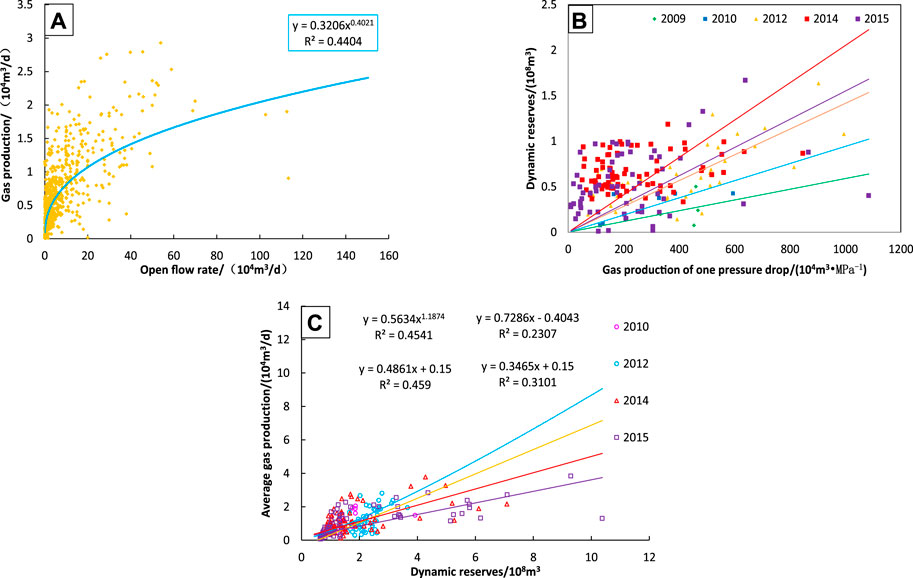
FIGURE 9. Dynamic reserve allocation method.
Result
According to the established dynamic reserve allocation method, the gas wells in the study area are allocated. Firstly, the dynamic reserves of 670 wells are analyzed and allocated, and the results are compared with the OFR method. The error between the calculated results and the daily production during stable production period is analyzed (Figure 10). Compared with the results of the OFR method with the average error of 1.13%, the calculation error of the new method with the average of 0.07% is smaller.
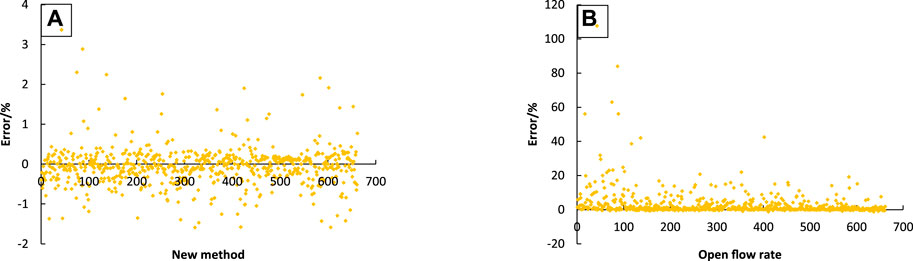
FIGURE 10. Comparison of layout method and openflow capacity distribution.
Discussion
Type-Ⅰ
Type I wells have the highest initial production, lowest pressure drop, long stable production time, and good production stability under low pressure. Well S1 is a typical type I with an OFR of 35.27 × 10⁴ m3/m. It has been in production since October 2014. From the production curve (Figure 11), it can be seen that the average monthly production is 44 × 104 m3/m, the water production is at a low level, the average monthly production is 0.2 m3/m, and the water-gas ratio is maintained at 0.01 (m3/104 m3) in the early stage (October 2014 to June 2015). In the second stage (July 2015 to March 2017), the casing pressure, the oil pressure and the monthly gas production decreased rapidly. The gas production was maintained at a low level, and the water production was higher, with casing pressure maintained at about 8.2 MPa and oil pressure maintained at about 6.3 MPa in the third stage (May 2017∼; April 2020).
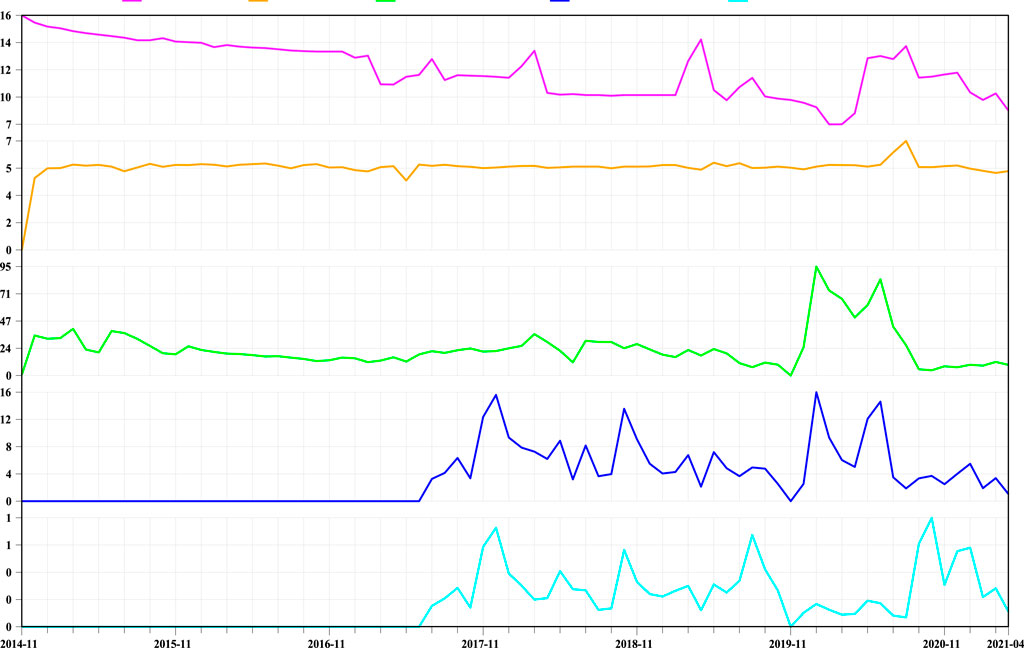
FIGURE 11. Production curve of well S1.
The Pc/Zc ∼ Gp curve (Figure 12) is drawn by production data, and the points showing a straight line trend are linearly fitted. The slope of the line is -0.0032, and it is used as a straight line through the Pi/Zi. The intercept in the horizontal coordinate is 0.558 × 10⁸ m3, which is the dynamic reserve of S1 well determined by the FMB.
−λ is −0.91, and take −λm as the slope and draw a straight line through the Pi/Zi. The intercept on the abscissa is 0.616 × 10⁸ m3, which is the dynamic reserve of well-S1 determined by modified FMB.

FIGURE 12. Dynamic reserves of S1.
Dynamic reserve is used to allocate well production (Figure 13). The abandoned production was set to 1000 m3/d and the decline prediction equation was used to simulate the production. As of April 2037, the cumulative production was 4972.38 × 104 m3/d, and the monthly decline rate was 0.02%.
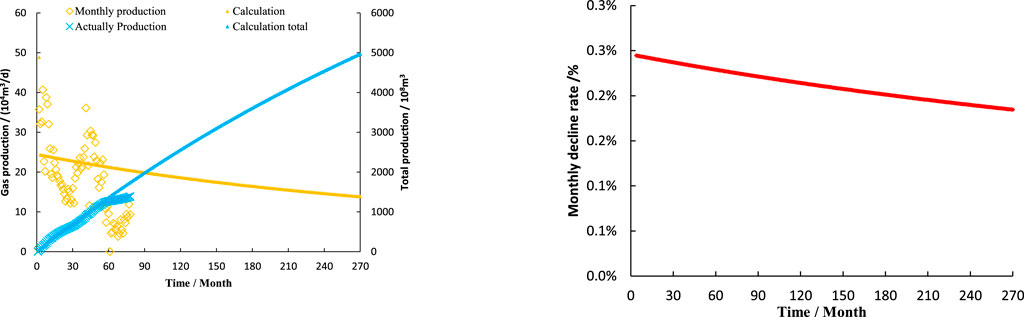
FIGURE 13. Forecast production of type-Ⅰ wells.
Type-Ⅱ
S5 is a typical type Ⅱ well with the OFR of 6.23 × 10⁴ m3/d. The original formation pressure is 20.91 MPa and the production is allocated according to 1.6 × 10⁴ m3/d at the beginning of the production (Figure 14). Due to the large pressure fluctuation in the test, the gas production is difficult to stabilize. After adjusting the working system, the gas production is gradually reduced to 20 × 104 m3/m, and the water production is 0.1–0.3 m3/m. When the gas production was reduced to 10 × 104 m3/m, the casing pressure decreased from 22 to 11.02 MPa, while the tubing pressure was basically stable. As of April 2021, the cumulative gas production was 941.73 × 10⁴ m3.
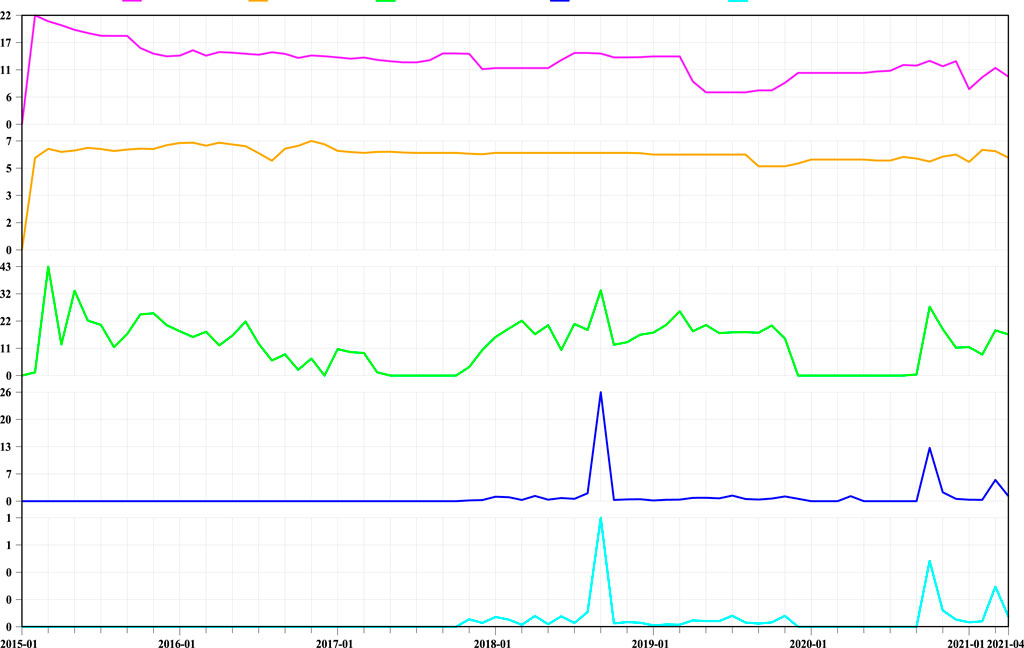
FIGURE 14. Production curve of well S2.
The Pc/Zc ∼ Gp curve is drawn by production data, and the points showing a straight line trend are linearly fitted (Figure 15). The slope of the line is −0.011, and it is used as a straight line through the Pi/Zi. The intercept in the horizontal coordinate is 0.216 × 10⁸ m3, which is the dynamic reserve of S2 determined by the FMB.
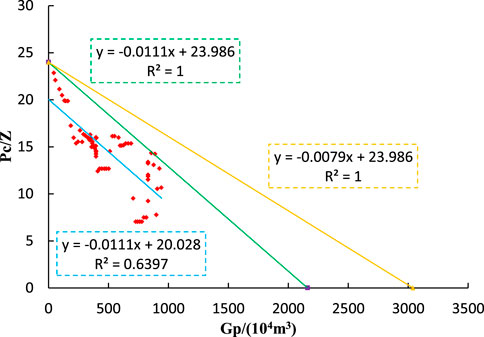
FIGURE 15. Dynamic reserves of S2.
−λ is −0.711, and take −λm as the slope and draw a straight line through the Pi/Zi. The intercept on the abscissa is 0.304 × 10⁸ m3, which is the dynamic reserves of S2 determined by modified FMB.
The dynamic reserve is used to allocate gas well production (Figure 16). The abandoned production was set by 1000 m3/d and the decline prediction equation was used to simulate the future production of gas wells. As of April 2037, the cumulative production was 1935.2 × 104 m3/d, and the monthly decline rate was 0.05%.
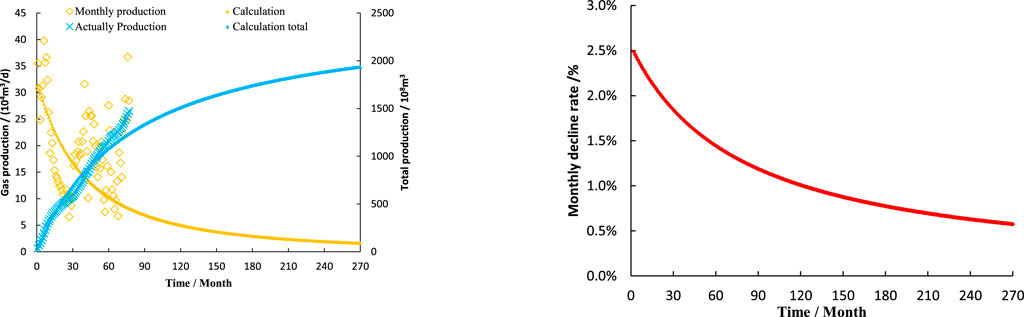
FIGURE 16. Forecast production of type-Ⅱ wells.
Type Ⅲ
S3 is a typical class Ⅲ well in this area, with an OFR of 7.3 × 10⁴ m3/d. It has been in production since December 2014. It can be seen from the production curve (Figure 17) that the average monthly production was 30 × 104 m3/m in the early stage (December 2014 to March 2015), the water production was at a low level with the average monthly production of 0.12 m3/m. During the second stage (April 2015 to January 2017), the casing pressure decreased rapidly and the monthly gas production remained unchanged. In the third stage of production (February 2017 to April 2021), the gas production decreased rapidly, and the water production increased rapidly. The casing pressure remained at about 7.9 MPa. Up to now, the cumulative gas production of S3 is 1462.51 × 104 m3/m.

FIGURE 17. Production curve of well S3.
The Pc/Zc ∼ Gp curve (Figure 18) is drawn by production data, and the points showing a straight line trend are linearly fitted. The slope of the line is −0.0045, and it is used as a straight line through the Pi/Zi. The intercept in the horizontal coordinate is 0.337 × 10⁸ m3, which is the dynamic reserve of S3 determined by the FMB.

FIGURE 18. Dynamic reserves of S3.
−λ is -0.95, and take −λm as the slope and draw a straight line through the Pi/Zi. The intercept on the abscissa is 0.355 × 10⁸ m3, which is the dynamic reserve of well S3 determined by modified FMB.
The dynamic reserve is used to rationally allocate gas wells (Figure 19). The abandoned production was set to 1000 m3/d, and the decline prediction equation was used to simulate the future production. As of February 2025, the cumulative production was 1027.35 × 104 m3/d, and the monthly decline rate was 0.06%.
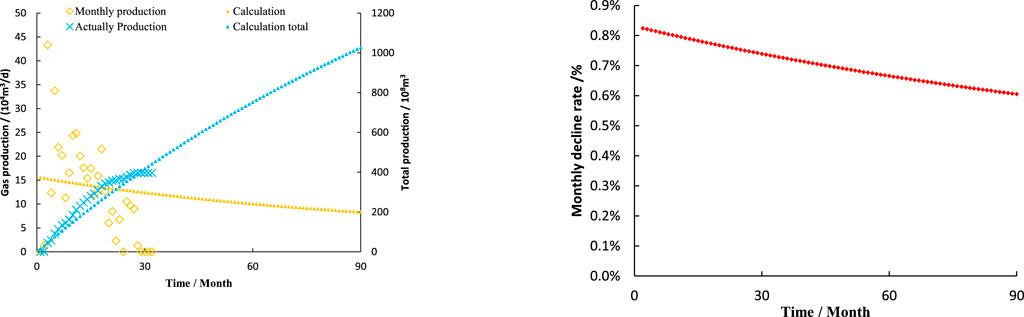
FIGURE 19. Forecast production of type-Ⅲ wells.
Conclusion
1) Based on the experimental result of natural gas, the modified FMB and the new allocation method are established. The new model is verified by the production data of 300 gas wells.
2) The viscosity of natural gas increases rapidly with the pressure, the compressibility decreases rapidly with the pressure. The product of the two decreases with pressure. Then there is an error in FMB for calculating the dynamic reserves of tight reservoir.
3) Considering the changes of viscosity, compressibility with pressure, a modified FMB is established, and the calculation method and calculation steps are given.
4) The dynamic reserves allocation method was established, and it was verified in combination with 300 wells. Compared with conventional method, the new method are closer to the production in the stable production period, with an average error of 0.07%.
Data availability statement
The datasets used and analysed during the current study available from the corresponding author on reasonable request.
Author contributions
YL and KL performed the experiments. ML and HC wrote the main manuscript. YZ advised the students and corrected the manuscript. All authors reviewed the manuscript.
Funding
This study was supported by the National Major Project (2017ZX05008-004-004-001). The results of these authors are all funded by the Yanchang Oil and Gas Exploration Company.
Acknowledgments
The authors would like to thank the editors and reviewers for their valuable suggestions for this paper.
Conflict of interest
ML, HC, YL, and KL were employed by the Yanchang Oil and Gas Exploration Company.
The remaining author declares that the research was conducted in the absence of any commercial or financial relationships that could be construed as a potential conflict of interest.
The authors declare that this study received funding from Yanchang Oil and Gas Exploration Company. The funder had the following involvement in the study: data collection and analysis of the manuscript.
Publisher’s note
All claims expressed in this article are solely those of the authors and do not necessarily represent those of their affiliated organizations, or those of the publisher, the editors and the reviewers. Any product that may be evaluated in this article, or claim that may be made by its manufacturer, is not guaranteed or endorsed by the publisher.
References
Abivin, P., Henaut, I., Argillier, J. F., and Moan, M. (2008). Viscosity behavior of foamy oil: Experimental study and modeling. Petroleum Sci. Technol. 26 (13), 1545–1558. doi:10.1080/10916460701208850
Abusahmin, B. S., Karri, R. R., and Maini, B. B. (2017). Influence of fluid and operating parameters on the recovery factors and gas oil ratio in high viscous reservoirs under foamy solution gas drive. Fuel 197, 497–517. doi:10.1016/j.fuel.2017.02.037
Gilbert, W. E. (1954). Flowing and gas-lift well performance. Drilling & Production Practice, API, 126–157.
Greene, W. R., 1989. Analyzing the flowing performance of oil wells: Denver unit CO2 flood, SPE Annual Technical Conference and Exhibition.
Guo, S., Lyu, X., and Zhang, Y. (2018). Relationship between tight sandstone reservoir formation and hydrocarbon charging: A case study of a jurassic reservoir in the eastern kuqa depression, tarim basin, NW China. J. Nat. Gas Sci. Eng. 52, 304–316. doi:10.1016/j.jngse.2018.01.031
Han, G. F., Liu, M., and Li, Q. (2020). Flowing material balance method with adsorbed phase volumes for unconventional gas reservoirs. Energy Explor. Exploitation 38 (2), 519–532. doi:10.1177/0144598719880293
He, J., Guo, X., Cui, H., Lei, K., Lei, Y., Zhou, L., et al. (2021a). Modification of the calculation method for dynamic reserves in tight sandstone gas reservoirs. Acs Omega 6 (44), 29955–29964. doi:10.1021/acsomega.1c04473
He, J., Liu, X., Zhu, X., Jiang, T., He, H., Zhou, L., et al. (2021b). Experimental study on the two-phase seepage law of tight sandstone reservoirs in Ordos Basin. J. Energy Eng. 147 (6). doi:10.1061/(asce)ey.1943-7897.0000797
Huang, S. J., Zhu, Y. R., Ding, J. W., Li, X. M., and Xue, Y. C. (2020). A semi-analytical model for predicting inflow profile of long horizontal wells in super-heavy foamy oil reservoir. J. Petroleum Sci. Eng. 195, 107952. doi:10.1016/j.petrol.2020.107952
Jian, Y., Yili, K., Qiangui, L. I., and Hao, Z. (2008). Characters of micro-structure and percolation in tight sandstone gas reservoirs. Adv. Mech. 38 (2), 229–236.
Kazemi, N., and Ghaedi, M. (2020). Production data analysis of gas reservoirs with edge aquifer drive: A semi-analytical approach. J. Nat. Gas Sci. Eng. 80, 103382. doi:10.1016/j.jngse.2020.103382
Li, G., Ren, W. X., Meng, Y. F., Wang, C. L., and Wei, N. (2014). Micro-flow kinetics research on water invasion in tight sandstone reservoirs. J. Nat. Gas Sci. Eng. 20, 184–191. doi:10.1016/j.jngse.2014.06.024
Lu, J., Zhou, B. T., Rahman, M. M., and He, X. M. (2019). New solution to the pressure transient equation in a two-layer reservoir with crossflow. J. Comput. Appl. Math. 362, 680–693. doi:10.1016/j.cam.2018.05.065
Mach, J., Proano, E., and Brown, K. E. (1979). A nodal approach for applying system analysis to the flowing and artificial lift oil or gas well. Engineering, 114764460.
Mousavi, S. M. R., Jafari, S., Schaffie, M., and Norouzi-Apourvari, S. (2020). Experimental study and modeling permeability damage in porous media due to asphaltene deposition. J. Petroleum Sci. Eng. 193, 107396. doi:10.1016/j.petrol.2020.107396
Qiang, F. Y., Guang, L. L., and Company, G. (2007). The research on the well productivity identification in low pressure and tight gas reservoir. Nat. Gas. Ind.
Sun, Z., Liu, H. H., Han, Y. H., Basri, M. A., and Mesdour, R. (2021). The optimum pressure drawdown for production from a shale gas reservoir: A numerical study with a coupled geomechanics and reservoir model. J. Nat. Gas Sci. Eng. 88, 103848. doi:10.1016/j.jngse.2021.103848
Sun, Z., Shi, J., Wang, K., Miao, Y., Zhang, T., Feng, D., et al. (2018). The gas-water two phase flow behavior in low-permeability CBM reservoirs with multiple mechanisms coupling. J. Nat. Gas Sci. Eng. 52, 82–93. S1875510018300416. doi:10.1016/j.jngse.2018.01.027
Wei, L. I., Shi-Quan, Y. U., and Zheng, L. K. (2008). New method to determine the deliverability equation factor of tri-item equation for low permeability fracturing gas wells. Petroleum Geol. Oilfield Dev. Daqing.
Wu, G. Y., and Li, J., Rational production proration of gas wells in unconsolidated sandstone gas reservoir, 2nd International Conference on Frontiers of Manufacturing and Design Science (ICFMD 2011), Taiwan, TAIWAN, 2011. pp. 1249-+.
Xu, J., Wu, K., Yang, S., Cao, J., and Chen, Z. Nanoscale free gas transport in shale rocks: A hard-sphere based model, SPE Unconventional Resources Conference. Calgary, Alberta, Canada, February 2017. doi:10.2118/185022-MS
Xu, J. Z., Chen, Z., Wu, K., Li, R., Liu, X., and Zhan, J. (2019a). On the flow regime model for fast estimation of tight sandstone gas apparent permeability in high-pressure reservoirs. Energy Sources Part A Recovery Util. Environ. Eff., 1–12. doi:10.1080/15567036.2019.1687625
Xu, J. Z., Wu, K., Li, R., Li, Z., Li, J., Xu, Q., et al. (2019b). Nanoscale pore size distribution effects on gas production from fractal shale rocks. Fractals 27 (8), 1950142. doi:10.1142/s0218348x19501421
Yu, X., Lei, S., Liangtian, S., and Shilun, L. (1996). A new method for predicting the law of unsteady flow through porous medium on gas condensate well. A New Method Predict. Law Unsteady Flow Through Porous Medium Gas Condens. Well.
Zhou, Y., Zhang, G., and Liu, J. (2022). Modeling method to characterize the pore structure of fractured tight reservoirs. Appl. Sci. (Basel). 12 (4), 2078. doi:10.3390/app12042078
Keywords: reasonable production allocation, flow material balance method, dynamic reserves, tight sandstone gas reservoirs, ordos basin
Citation: LV M, CUI H, LEI Y, Lei K and ZHU Y (2023) Study on reasonable production allocation method of tight sandstone gas reservoir—A case of XX block in ordos basin. Front. Energy Res. 10:1021989. doi: 10.3389/fenrg.2022.1021989
Received: 19 August 2022; Accepted: 21 September 2022;
Published: 10 January 2023.
Edited by:
Sen Wang, China University of Petroleum, ChinaReviewed by:
Zhiming Chen, China University of Petroleum, ChinaJinze Xu, University of Calgary, Canada
Copyright © 2023 LV, CUI, LEI, Lei and ZHU. This is an open-access article distributed under the terms of the Creative Commons Attribution License (CC BY). The use, distribution or reproduction in other forums is permitted, provided the original author(s) and the copyright owner(s) are credited and that the original publication in this journal is cited, in accordance with accepted academic practice. No use, distribution or reproduction is permitted which does not comply with these terms.
*Correspondence: Yushuang ZHU, cGV0cm9sZXVtX2dhc0AxNjMuY29t