 Guanhong Chen
 Dong Liu
- Department of Electrical Engineering, Shanghai Jiao Tong University, Shanghai, China
With a tremendous number of renewable energy sources (RES) integrated into the distribution system, the inherent uncertainty of RES power generation brings about significant challenges in distribution and power balance within the distribution system. This article proposes an adaptive robust economic dispatch (ARED) model and a real-time control strategy for distribution systems as countermeasures, which make full use of the adjustable capabilities of controllable inverter air-conditioner (IAC) clusters. Firstly, the concept of the adjustable capacity curve (ACC) is developed to accurately quantify the adjustable capacity of an IAC cluster. Afterward, a two-stage adaptive robust optimization is formulated for ARED, which comprehensively takes the adjustable capacity of the IAC cluster and the uncertainty of RES into consideration. Meanwhile, the solution methodology of ARED is also designed based on the column and constraint generation (C&CG) algorithm, where the master problem is quadratic programming with quadratic constraints (QCQP), and the max-min sub-problem is reformulated to a mixed integer linear programming (MILP) form by taking advantage of linear duality theory and big-M method. Finally, a novel real-time decentralized control strategy for IAC clusters is also proposed for purpose of hedging against stochastic RES power fluctuation after every round of ARED decisions. The results of the case study validate the effectiveness of ARED model and real-time control strategy under different uncertainty scenarios of RES power generation.
1 Introduction
In recent years, in order to suppress fossil energy depletion and extreme climate change, innovative technologies and applications of energy and power in industry are going through a highly active period (Dai et al., 2017). Clean and low-carbon energyutilization technologies have attracted broad attention from all countries, emphasizing the dominant position of renewable energy sources (RES) in future power system (Lu et al., 2017).
However, with the growing proportion of RES engaging in distribution system operation, significant challenges are brought about to distribution system operators (DSOs). On the one hand, during the power dispatching stage, traditional prediction value-based deterministic economic dispatch may suffer from suboptimality (Li et al., 2015) due to the inevitable prediction errors for RES power generation. Therefore, an uncertainty-based economic dispatch model is required, aiming to determine a relatively cost-efficient reference point for all dispatchable units. Stochastic optimization (SO) (Chen et al., 2018; Ye et al., 2018; Roldán et al., 2019; Shuai et al., 2019), chance-constrained programming (Zhou et al., 2018; Yang et al., 2021) and robust optimization (RO) (Gao et al., 2018; Liu et al., 2018; Chen et al., 2021) are three leading paradigms adopted widely in previous studies (Ning and You, 2018). Among these paradigms, SO is mainly formulated based on finite typical scenarios and corresponding discrete probability distribution after scenario generation and reduction. In the work of Ye et al. (2018), authors propose an optimal dispatch method for a power system with high penetration of wind power. Typical scenarios are generated by assuming the prediction error obeys the Gaussian probability density function. In the work of Chen et al. (2018), a generative adversarial network based data-driven approach is adopted to generate typical scenarios of RES power generation. A SO-based optimization model usually contains a relatively large number of constraints, and the applicability of the solution depends on the accuracy of the probability distribution. Distinct from SO, the two-stage adaptive RO does not require accurate probability distribution of uncertainty variables, thus is more practicable for systems with limited knowledge of stochastic RES characteristics (Zhang et al., 2019). Liu et al. (2018) develop a two-stage RO model to minimize the operation cost of the microgrid, in which uncertainties of RES and load are modeled by box constraints. In the study of Chen et al. (2021), a robust dynamic economic dispatching model of integrated transmission and distribution system is established, in which uncertainty set is decided according to conditional value-at-risk rather than manually assigned. Gao et al. (2018) explore the coordinated energy management among distribution systems and networked microgrids, in which a tractable typical budget set is adopted. To improve the conservativeness of RO’s solution, in these works, different uncertainty sets with adjustable uncertainty budgets are employed, such as polyhedron uncertainty set (Gao et al., 2018; Liu et al., 2018; Chen et al., 2021), ellipsoid uncertainty set (Roldán et al., 2019). In addition, drawing advantages of both RO and SO, distributionally robust optimization (DRO) also attracts growing attention in recent years, which builds an ambiguity set of uncertainty variables based on statistical moments information and optimizes the system’s expected cost under the worst distribution. In the work of Ruan et al. (2019), the ambiguity set is developed by 1-norm and ∞-norm constraints of the distance between stochastic probability distribution and historical statistical distribution. Zhou et al. (2018) develop a distributionally robust dispatch model considering generalized moments uncertainty of wind power and equivalently transform it to deterministic quadratically constrained quadratic programming (QCQP) problem.
On the other hand, during the real-time operation stage, actual RES power generation deviates from the predicted value with stochastic amplitude and high variation frequency, which may lead to fierce fluctuation of exchange power between the distribution system and transmission system. Due to this reason, more ancillary resources are required for the transmission system to ensure real-time power balance (Kalantar-Neyestanaki et al., 2020). However, under severe operation scenarios such as a contingency state, the regulatable capacity of the transmission system may become extremely limited to meet the requirements, which greatly stimulates the need for ancillary resources from the distribution system side (Tan et al., 2020). To release the power balance burden of the transmission system, demand-side controllable load clusters have been considered to be important regulatory resources with great potential. Among different types of controllable loads, a thermostatically controllable load such as heat pumps and inverter air-conditioners (IAC) are the most characteristic types, due to their large scale, low cost, and fast response speed (Yao and Zhang, 2018). In the work of Wei et al. (2016), a hierarchical and distributed control strategy of heat pumps is proposed to balance the fluctuations caused by RES, in which each pump’s target power is determined by solving the optimal setting temperature. Ding et al. (2021) also propose a game-theoretic demand side management strategy, which is capable of guiding users to make optimal power consumption schedules and smooth the tie-line power of microgrids simultaneously. Hui et al. (2019) propose equivalent modeling of IAC to provide frequency regulation service and verify the aggregation of IACs can be controlled in a similar way to traditional generators. Based on networked information interaction between each IAC aggregator, Jiang and Wei (2018) presents adistributed cooperation model and optimal control strategy for an IAC cluster and the power grid to avoid the occurrence of a new load peak. Based on a transactive control framework, Yao and Zhang (2018) propose a decentralized control strategy of the IAC cluster to provide peak shaving service, and furtherly explore the coordination of heterogeneous thermostatically controlled loads to provide real-time ancillary services in their follow-up study (Yao and Zhang, 2020).
Actually, the power-adjustable capability of thermostatic load and user’s comfort experience is highly related to its temperature state, hence very sensitive to power adjustment instructions of both economic dispatch stage and real-time control stage. In most of the previous studies of economic dispatch, controllable loads are scheduled like normal generators according to their power-adjustable capacity, without exploring the effect on users’ comfort experience and variation of adjustable capability. In addition, the issues of how to reduce communication costs and protect users’ private information should also be subtly considered when aggregating large-scale controllable loads. To address these issues, this paper first develops the concept of an adjustable capacity curve, which is capable of quantifying the exact adjustable capacity of each IAC cluster within a certain time period. Then, for the power dispatch stage, we propose an adaptive robust economic dispatch (ARED) model to achieve cost-efficient dispatching of all generation units by taking IAC clusters’ adjustable capability and RES uncertainty into consideration. Afterward, for the real-time operation stage, a real-time control strategy is designed, where IAC clusters function as ancillary resources to hedge against the actual power fluctuation of RES based on decentralized control. Variation of power exchange between the transmission system and distribution system is effectively eliminated. The main contributions of this paper are summarized by the following aspects:
1) Sophisticated IAC model is first proposed in this paper, which not only contains common operation constraints in existing works (Yao and Zhang, 2018; Hui et al., 2019) but also takes the nonlinear relationship of IAC’s compressor operation frequency and IAC’s electrical/cooling power into consideration. More accurate quantification of IAC’s power adjustable capacity and tractable decentralized control can be realized based on this model.
2) A two-stage adaptive robust optimization model is formulated for ARED in this paper by drawing the advantages of RO, where the uncertainty of RES is addressed by adjustable box constraints rather than by discrete scenarios in the work of Ye et al. (2018). ARED model also considers the IAC cluster as a dispatchable unit whose adjustable capability is dynamically updated along with real-time control processes of the IAC cluster. In addition, different from most literature such as Chen et al. (2021); Gao et al. (2018) where upward and downward power adjustment are modeled by two independent positive-define variables, we propose an equivalent formation by only one variable, which can simplify the expressions of objective function and constraints.
3) A decentralized real-time control strategy capable of aggregating and cooperatively controlling IACs is proposed for the purpose of compensating power deviation caused by stochastic RES power fluctuation. IAC clusters’ power adjustable capacity can be quantified and updated rapidly during real-time control, which also functions as a constraints boundary in ARED model. Most of the computation is conducted locally, and less remote communication cost is required compared with the work of Wei et al. (2016); Ding et al. (2021). Privacy protection of IACs’ parameters and users’ preference information can also be guaranteed under the designed strategy.
The remaining content of this paper is organized as follows. Section 2 introduces the model of IAC and the quantification method of the IAC cluster’s adjustable capability. In Section 3, a two-stage adaptive robust optimization model for ARED considering IAC adjustable capacity is formulated and a C&CG algorithm-based solution methodology of ARED is elaborated as well. In Section 4, the real-time control strategy of the IAC cluster is proposed to hedge against RES power fluctuation during the real-time operation stage of the distribution system. In Section 5, a case study is explored to verify the effectiveness of ARED model and real-time control strategy of the IAC cluster. Section 6 concludes this paper.
2 Inverter air-conditioner modeling and adjustable capability quantification
2.1 IAC model
For a room equipped with an IAC, the first-order equivalent thermal parameter (ETP) dynamic model of room temperature Ta in continuous form can be expressed by (1):
In (1), ca and ρa stand for heat capacity and density of air; Aroom and Vroom stand for area and volume of the room; Uoa is heat transfer coefficient of the room; ξ is the number of air exchange times per hour; Tout is outdoor ambient temperature; qac is cooling power of IAC. For specific sampling and control period τ, the discrete-time formulation of (1) is derived and applied in this paper, where we introduce equivalent heat dissipation coefficient
For one IAC, the consumed electrical power pac and produced cooling power qac are actually adjusted by operation frequency fac of IAC compressor. However, the relationship between pac, qac and frequency fac are usually nonlinear, which means the adjustment sensitivity ∂pac/∂fac, ∂qac/∂fac are diverse at different operation frequency point. In this paper, we adopt piecewise linearization technology to approximate the original nonlinear functions, as shown in Figure 1. Suppose the operation frequency fac is segmented into N intervals according to (N+1) segmentation points (f1, … , fN+1), and so are pac and qac. Then, the slope vectors
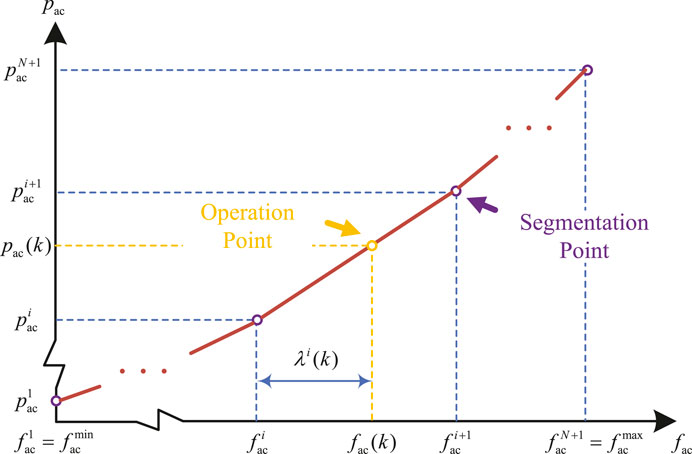
FIGURE 1. Piecewise linearization of nonlinear pac—fac function.
In (3)-(7), binary vector
2.2 Adjustable capability of one IAC
For each room equipped with an IAC, suppose there always exists an acceptable room temperature range [Tmin, Tmax] and a most satisfactory temperature Tfit according to user’s personal preference. So, electrical power pac of IAC can be regulated within a certain range without violating the user’s comfort limitations, which provides substantial flexible power adjustment capability to the distribution system after aggregating.
To evaluate the power adjustment capability of one IAC and an IACs cluster, we firstly introduce a piecewise linear mapping
Thus, the mapping result
Then, we define a monotonically decreasing function pac = dac(s) termed adjustment capability curve (ACC) of one IAC according to user’s preference information, which is illustrated in Figure 2. The horizontal axis represents the target “unsatisfactory degree” s (k + 1) after current round of control, and vertical axis represents the electrical power pac required to transfer s(k) to s (k + 1). Intuitively, image of ACC is uniquely determined according to 4 characteristic points (F, A, B, C) and 2 horizontal power boundary values
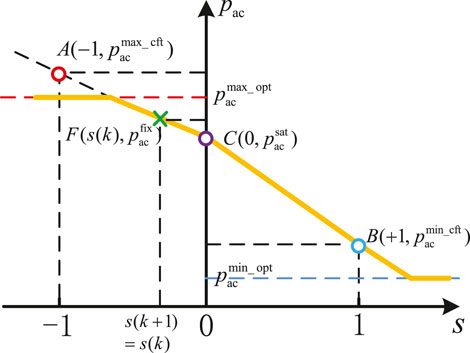
FIGURE 2. Adjustment capability curve (ACC) of one IAC.
To obtain adjustable capacity of one IAC, firstly we should calculate corresponding characteristic cooling power values
Then, by referring to aforementioned segmentation of IAC power and operation frequency, binary vector ω(k) and continuous auxiliary vector λ(k) can be determined according to current cooling power qac(k) via constraints (3)–(7). Afterward, characteristic power
Finally, adjustable electrical power
2.3 Adjustable capability of IAC cluster
During system-level dynamic economic dispatching and real-time control processes, the IAC cluster is the basic unit participating in power balance. So, an IAC cluster is working like a virtual power plant (VPP) to some extent, which is ought to provide its power-adjustable capacity and current operation power to DSO.
To achieve this goal, in this paper, we require all IACs belonging to the same cluster to follow a unified control signal s∗(k + 1). The advantages are twofold: (1) Unified “unsatisfactory degree” ensures fairness of different users’ comfort experience without violating their personal preference, because s∗(k + 1) ∈ [ − 1, 1]; (2) This requirement is sufficiently simple and tractable, which brings great convenience to decision-making process even if the number of IACs in one cluster is very large. Once the requirement is satisfied, the adjustment capability of the IAC cluster can be easily computed by simply aggregating (adding up) each IAC’s ACC as an equivalent ACC of the IAC cluster:
So, (17) indicates that pcluster is also a monotonically decreasing piecewise linear function concerning cluster’s unified control signal s. Suppose
where
3 Adaptive robust economic dispatch optimization and solution methodology
Due to the lack of uncertainty modeling of RES, under some extreme operation scenarios, the decision results of a traditional deterministic economic dispatching model based on predicted values may lead to high adjustment costs during real-time power balance. To remedy this defect, in this section, we propose a two-stage adaptive robust economic dispatch optimization model ARED in (19), which takes both uncertainty of RES and adjustable capability of IAC clusters into consideration:
The object function of ARED is composed of two parts: normal-state operation cost Qf (first stage decision) and re-dispatch cost Qs under worst operation scenario (second stage decision). The decision variables of these two stages are defined by yf, ys respectively, and u denotes uncertainty variables, which is modeled within an adjustable uncertainty set.
3.1 First stage decision
3.1.1 Decision variables definition
In the first stage decision, the decision variables are:
where V stands for the set of all busbars, ξ stands for the set of all distribution lines, and G represents the set of all power generation units (generators and wind plants); Decision variable v is the square of busbar voltage, {pij; qij; lij} stands for active power, reactive power and square of current magnitude of directed distribution line (i, j), and pg is active power generation of power generation unit.
3.1.2 Objective function
The object of the first stage decision is to minimize power generation cost and wind curtailment punishment according to predicted power generation of wind plants
where c2, c1, c0 are coefficient of generator’s quadratic generation cost function; ρcr is punishment coefficient of wind curtailment; W is the set of wind plants, which is a subset of G.
3.1.3 Constraints
For ∀j ∈ V, constraints (22) (23) stand for nodal active power and reactive power balance equations respectively; For ∀(i, j) ∈ ξ, we specially use second-order cone relaxation (SOCR) inequality (25) to substitute original quadratic equation
3.2 Second stage decision
3.2.1 Decision variables definition
In the second stage decision, to ensure power balance, re-dispatch of all generation units, controllable load clusters (i.e., IAC clusters in this paper), wind power curtailment, and load shedding are deployed according to actual RES power generation during real-time operation. This stage is regarded as a “corrective stage” based on the first stage decision results. The decision variables are listed in (29), where we use superscript Δ to indicate the variation of the corresponding decision variable, which can be positive or negative. In addition, two non-negative variables
3.2.2 Objective function
The object function is to minimize the total cost of corrective actions under the worst uncertainty scenario u ∈ U, where U is the adjustable uncertainty set. CL stands for the set of all controllable IAC clusters. Coefficient {ρad, ρcr, ρd, ρls} represents power adjustment cost of generation units, curtailment cost of wind plants, power adjustment cost of controllable IAC clusters and load shedding cost of normal loads.
3.2.3 Constraints
In these constraints, {pg, qg, pij, qij, lij,v} are derived by the solutions of first stage decision model, and should be considered as constant known values during second stage decision. Constraints (31)–(36) basically inherit first stage constraints (22)–(28), but are presented in form of incremental expressions. (34) is derived through deploying first-order Taylor expansion on original constraints
Different from the model formulation in previous work (Gao et al., 2018), the model in this paper not only requires fewer decision variables but also eliminates integer variables indicating upward or downward power adjustment states, which contributes to the simplification of ARED solution.
3.3 C&CG algorithm based ARED solution method
In our two-stage ARED optimization problem, the first stage decision is a QCQP problem due to SOCR of branch power flow equations. The second stage decision is a max-min problem, which can be regarded as a linear programming problem (LP) concerning decision variable ys for given yf and uncertainty scenario u. Considering the problem structure of ARED, we draw experience from column and constraints generation (C&CG) algorithm (Zeng and Zhao, 2013) to solve it, which iteratively solves the master problem (MP) and sub-problem (SP) to approximate the optimal solution. The compact form of MP and SP are:
In MP, yf ∈ Ωf stands for feasible region of yf generated by constraints (22)–(28); The first three constraints are gradually appended to MP after solving SP during each iteration, and k is current iteration times. In SP,
To solve max-min problem SP, we firstly reformulate it to a single max-problem by deriving the dual problem of inner min-problem, which is named by DSP1:
where π, μ are Lagrange multiplicators corresponding to inequality and equality constraints in (41). Notice that bilinear terms
where Λwg = diag (Δwg), μwg is the multiplicator related with equality constraint (45) synthetized from equations in (35) and 38 by eliminating intermediate variable
According to the work of Shao et al. (2017), max-min RO always derives its optimal solution at one vertex of the uncertainty set, so u can be regarded as a binary vector without loss of optimality. Considering this, we can furtherly eliminate bilinear terms in (43) by introducing auxiliary variable z+ = θ+ ◦ μwg, z− = θ− ◦ μwg and applying big-M method:
where M is a big constant, ◦ stands for the Schur-Hadamard product of two matrices sharing the same size. Finally, DSP1 can be exactly linearized to an equivalent mixed integer linear programming (MILP) problem DSP2, which can be directly solved by commercial solvers:
To sum up, we use pseudo code to demonstrate the detailed solution process of ARED based on the C&CG algorithm.
4 Real-time control for compensation of res power fluctuation
The actual power generation of RES is revealed during real-time operation, which is very likely to deviate from the predicted value due to RES power fluctuation. Hence, DSO distributes the power deviation to each generation unit and IAC cluster according to a proportion of their adjustable capacity. However, unlike distributed generators, the IAC cluster is unable to constantly generate and regulate a certain amount of power by itself, and it can only provide power adjustment by affecting the user’s comfort experience (namely, by changing room temperature). Therefore, in this section, we propose a novel control strategy for IAC clusters to achieve power adjustment for compensation of RES power fluctuation without violating IAC users’ comfort preferences.
4.1 Real-time control of IAC cluster
Suppose one IAC cluster’s target power adjustment is
Next, according to IAC cluster’s ACC, the unified control target s∗(k + 1) can be determined by:
where
Finally, each IAC local controller conduct autonomous control of IAC to follow the target signal s∗(k + 1). Thus, this process can be carried out in a decentralized style. It is noteworthy that during local IAC control, to ensure accuracy and exactness of control, the sampling and control period is usually chosen to be smaller than that of determining the target signal. Therefore, a local model predictive control (MPC) optimization is developed to model and optimize the local process of tracking s∗(k + 1) with discrete time micro step τ = τmpc:
where Nmpc is the number of micro steps when applying MPC, which is also termed “prediction horizon” in some existed literature;
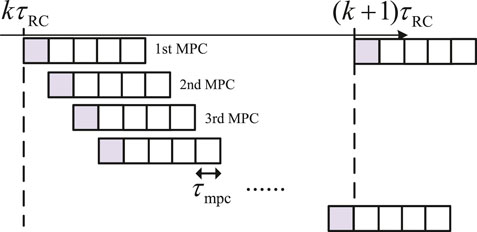
FIGURE 3. Local rolling MPC of IAC controller.
4.2 Overall processes of ARED and real-time control
Now, we integrate ARED and real-time control together. The entire processes of conducting ARED and real-time control of IAC clusters are illustrated in Figure 4. The processes colored green, gray, and yellow are carried out by local IAC controllers, IAC load aggregators, and DSO respectively.
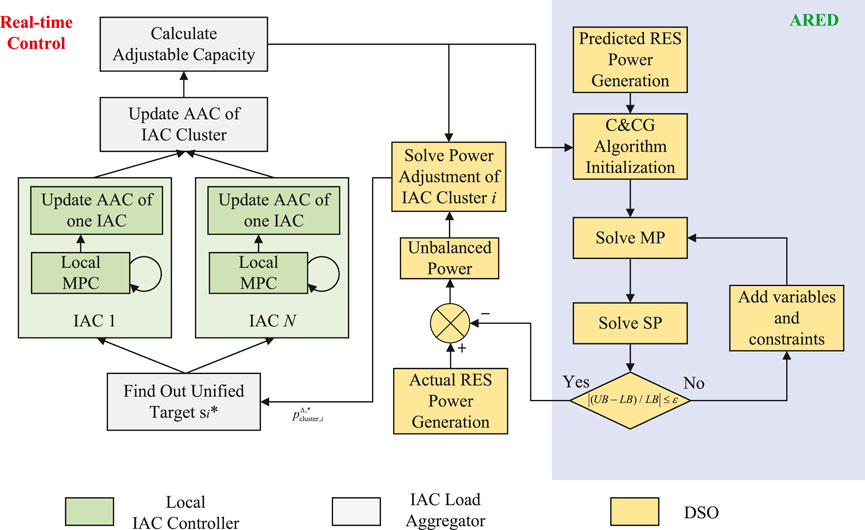
FIGURE 4. Schematic of ARED and real-time control processes.
Firstly, each IAC aggregator computes the ACC of the IAC cluster and uploads its adjustable capacity to DSO every τARED = 5 min, which determines the lower and upper bound of load power adjustment in constraint (37). Based on IAC cluster adjustable capacity and predicted power generation of RES, DSO solves ARED optimization model and determines the optimal setting point for each power generation unit, which minimizes the total operation cost under the worst uncertainty scenario.
Afterward, real-time control processes are executed with a time cycle of τRC = 1 min to ensure the minute-level power balance of the distribution system against RES power fluctuation. Concretely speaking, IAC aggregator determine its target “unsatisfactory degree” signal s∗ according to (49), and broadcast s∗ to its downstream IACs.
Finally, to track the target power indicated by s∗, each IAC will then execute rolling MPC locally and autonomously, which is conducted every τmpc = 15 s with coefficient ΛT set to zero matrix and Λp set to identity matrix. Therefore, to minimize cost function of MPC model (50), pac is forced to approach target value
5 Study case
5.1 Case description
A modified IEEE 33-busbar distribution network is adopted in this paper, the topology of which is shown in Figure 5. Two distributed generators and two wind plants are added to busbars 9, 19, 24, 27, and four IAC clusters with 15, 15, 30, and 15 IACs individually are also integrated into busbars 7, 8, 25, and 30. In this study case, wind plants account for 50% of the total installed capacity of the explored distribution system, and can undertake 43% of the total load at maximum power generation.
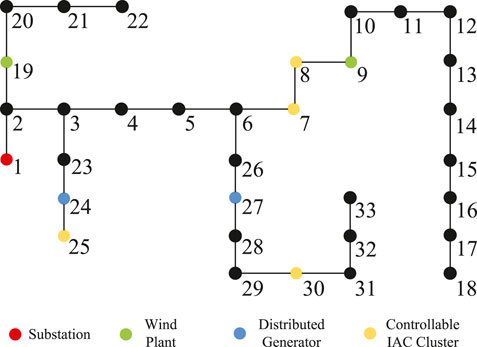
FIGURE 5. Case study: a modified IEEE 33-busbar system.
For the first stage decision of ARED, parameters of all dispatchable power generation units are listed in Table 1. For second stage decision of ARED, cost coefficients of wind curtailment and load shedding {ρcr, ρls} are set to 40, 60$/MW respectively. Power adjustment cost coefficient ρad of the transmission system is set to 45$/MW, and that of distributed generators is set to 35$/MW. IAC clusters in this paper are assumed to participate in power adjustment by incentive contracts, and the contract price (i.e., cost coefficient ρd) is set to 35$/MW.
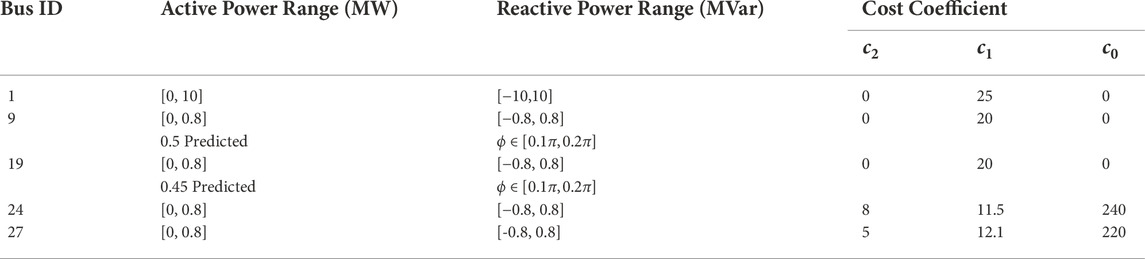
TABLE 1. Parameters of power generation units.
The parameters of IAC are inherited from the literature [18], and for each room equipped with IAC, the initial room temperature, initial IAC compressor operation frequency, and ambient temperature are randomly generated according to distributions in Table 2 where N, U stands for Gaussian distribution and uniform distribution. We also simplify each room’s structure to be a cuboid with length 12.5m, width 8m, and height 2.5 m.
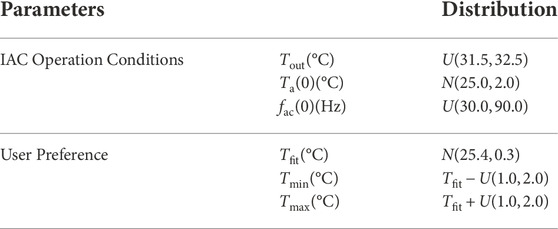
TABLE 2. Random initialization of iac operation condition and user preference parameters.
5.2 Anaysis of ARED results
5.2.1 Results of ARED
Without losing generality, we firstly demonstrate ARED results with uncertainty budget set to Δwg,j = 0.2 MW, which are listed in Table 3. For the results of the first stage decision, the operation power of wind plants at busbar 9 and 19 are scheduled to the same values as the predicted ones, which maximize the use of wind power. The second stage decision reveals the worst uncertainty scenario: the power generation of wind plants 9 and 19 simultaneously deviate -0.2 MW from predicted values, which causes an 0.4 MW power deficiency in total. To compensate for this deviation, distributed generators 24 and 27 increase their power generation by 0.274 and 0.055 MW, and controllable IAC clusters at busbar 7, 8, 25, and 30 decrease their power demand by 0.066 MW in total as well, which undertakes 16.5% of required power adjustment capacity. Meanwhile, the 0 MW power adjustment of the substation indicates that uncertain power fluctuation of RES is completely compensated within the distribution system itself, which stabilized power exchange between the distribution system and transmission system.
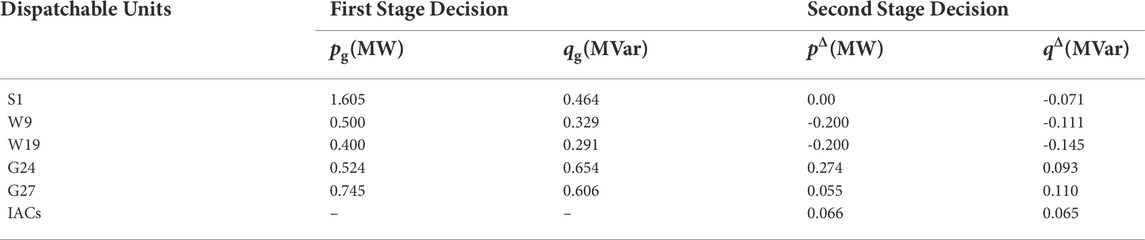
TABLE 3. Results of ared’s first and second stage decision.
5.2.2 Comparison of ARED and traditional ED
In traditional ED, only the first stage decision is carried out to minimize total operation cost under predicted RES power generation, which is a deterministic optimization problem. As shown in Table 4. The cost of the first stage decision ($536.82/h) is lower than that of ARED ($538.14/h). However, under the worst uncertainty scenario, ED’s cost of corrective regulation in the second stage ($16.78/h) is contrarily higher than ARED ($13.84/h), which simultaneously causes a higher total cost ($553.60/h). The results also demonstrate the mechanism of ARED: by deviating the solution of the first stage decision from that of a deterministic model (which actually causes a suboptimal solution of the first stage), a smaller cost of the second stage under the worst operation scenario can be achieved, which leads to a lower total cost as well.

TABLE 4. Per-hour cost comparison of ed and ared.
5.2.3 Influence of uncertainty budget
By adjusting uncertainty budget Δwg,j from 0 to 0.3 MW (interval 0.05 MW), ARED with different uncertainty budget are also solved to derive different robust optimal solutions under distinct conservative level. The results are shown in Table 5.
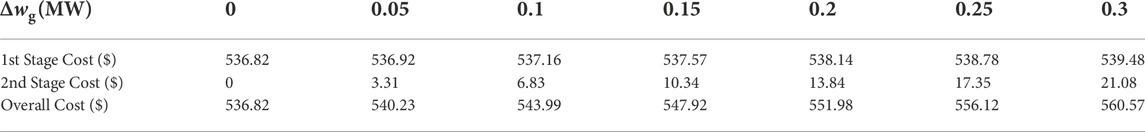
TABLE 5. Cost under different uncertainty magnitude.
When Δwg,j = 0, two-stage ARED model becomes a deterministic one with optimal first stage cost and 0 s stage cost. It is noteworthy that the optimal solution of the deterministic ARED model must be a feasible solution to other general ARED models with nonzero. Therefore, the optimal values of the objective function of other general ARED models are sure to be no less than that of the deterministic ARED model. Additionally, with the increase in the uncertainty budget, the cost of both two stages tends to increase simultaneously. This indicates that the more conservative the ARED model is, the less cost-effectiveness the results will be. So, the tradeoff between cost-effectiveness and robustness of ARED should be considered in practical situations by selecting an appropriate uncertainty budget.
5.3 Analysis of real-time control results
During real-time control, the deviation between RES actual and predicted power are distributed to dispatchable units for power compensation. Within these units, the IAC cluster is the most distinct because it works more like energy storage that is incapable of constantly generating and regulating a certain amount of power by itself. Hence, in this part, we focus on making an analysis of real-time control of IAC clusters.
5.3.1 Compensation of wind power fluctuation
Figure 6 demonstrates the power compensation effect of controllable IAC cluster at busbar 25 under the aforementioned control strategy. The yellow dotted line illustrates the fluctuation of the actual power of RES, which is sampled every 4 micro steps (τRC = 1 min), and indicates the latest power adjustment IAC cluster should undertake. By applying our control strategy, the target power of the IAC cluster is correspondingly calculated according to (48), as shown by the blue dotted line. Then, IACs execute autonomous and local MPC control to track a unified target “unsatisfactory degree” signal translated from target power according to (49). The actual power response of IACs is shown by red line, which is updated every micro step (τmpc = 15 s). It is clearly shown that the actual power of the IAC cluster perfectly follows the target power. Once the target power is updated, the actual power will start to vary towards the target value.
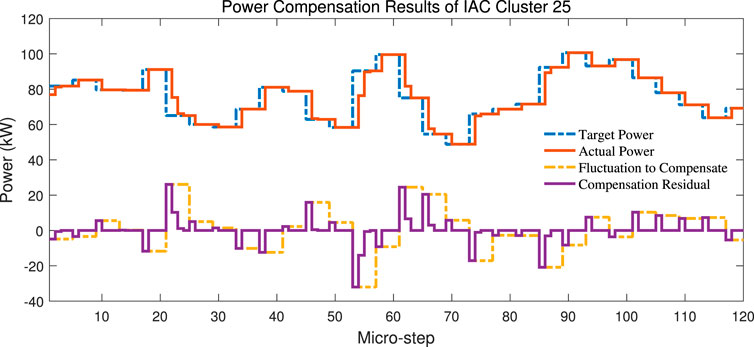
FIGURE 6. Compensation of wind power fluctuation.
For a more intuitive presentation, we define the residual between target power and actual power by “compensation residual”, which is presented by the purple line. The residual signal actually indicates the “unrealized” power adjustment to be undertaken by the transmission system. It can be found that the residual is a nonzero value at the beginning 1 micro-step of each τRC control interval (4 micro steps) due to updating of target power, but is gradually eliminated during the sequential 3 micro steps. This means power compensation can be fully achieved within the distribution system, and no more ancillary power adjustment is required in the transmission system.
5.3.2 Evolution of room temperature
The scaled adjustable capability of the IAC cluster is based on each IAC’s minor contribution of power adjustment, which changes the temperature of a room. Figure 7 demonstrates room temperature evolution of the 30 controllable IACs at busbar 25. In Figure 7A, we can find that initial values of room temperature are scattered in a wide range due to our random initialization. But these temperature values gradually converge to a narrow range after around 20 micro-steps and evolve following a similar tendency. This is the effect of adopting a unified target signal s∗, as shown in Figure 7C. It can be found that the “unsatisfied degree” of each room gradually converges to the same value. Thus, high similarity can be observed concerning the evolution of different rooms’ target temperature and actual temperature.
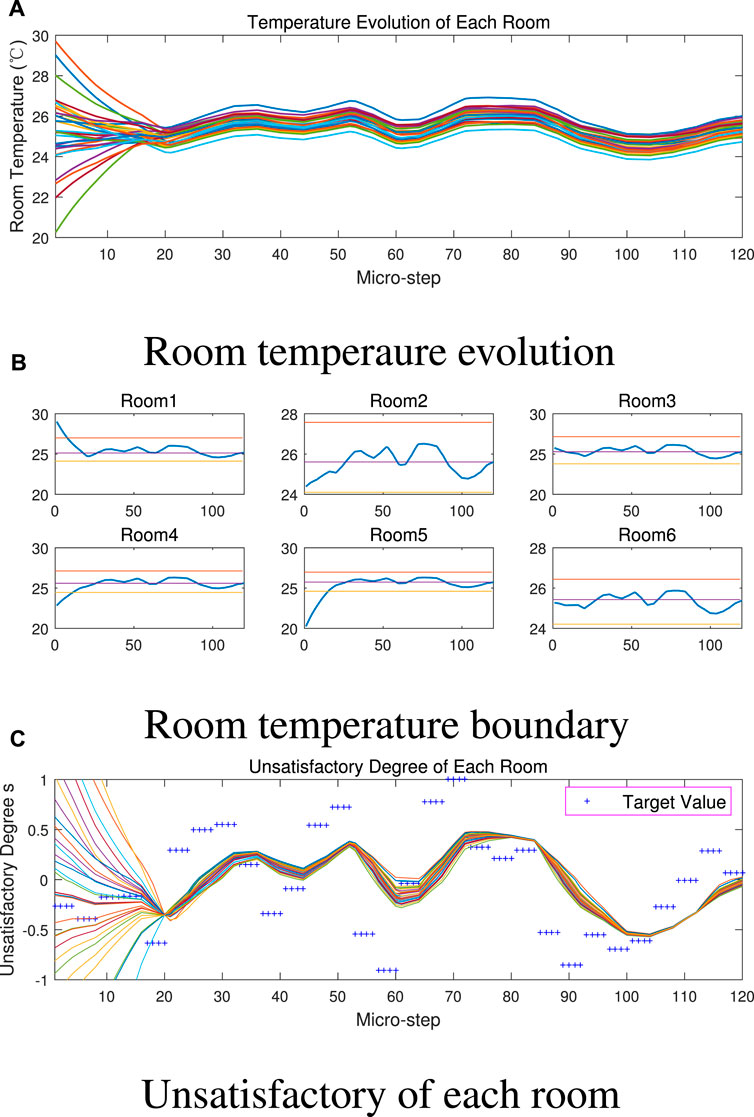
FIGURE 7. Evoluton of (A), (B) room temperature and (C) unsatisfactory degree.
As real-time control proceeds, the room temperature is still within the range determined by each user’s preference. For ease of explanation, we randomly choose 6 rooms and plot their individual temperature curve together with preference temperature levels in Figure 7B. It is clearly shown that after the initial 20 micro-steps, all rooms’ temperature gradually locate within their individual allowable interval indicated by Tmax (red horizontal line) and Tmin (yellow horizontal line), and varies around Tfit (purple horizontal line). In fact, target signal s∗ is bounded to [-1,1], as shown in Figure 7C, so room temperature will not violate user’s preference constraints.
5.3.3 Adjustable capacity of IAC cluster
ACC of IAC cluster is updated for calculation of IAC cluster’s adjustable capacity before conducting ARED, so its updating period is τARED = 5 min, which equals 20 micro-steps. Figure 8 demonstrates adjustable capacity evolution of the IAC cluster at busbar 25. The upward adjustable capacity of the IAC cluster can be intuitively comprehended by the gap between maximum allowable power and actual power of IAC, and so is downward adjustable capacity similarly.
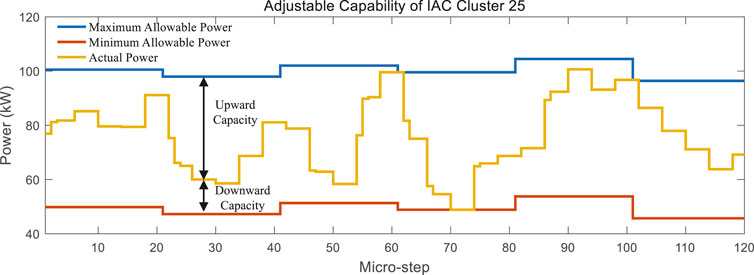
FIGURE 8. Adjustable capability of IAC cluster.
It can be observed that the maximum and minimum allowable power of IAC are time-variant, and this is the most prominent feature that distinguishes controllable IAC clusters from other dispatchable units such as distributed generators. The mechanism of this feature can be explained through ACC we proposed in Section 2: Firstly, higher room temperature will lead to larger maximum and minimum allowable power of IAC according to (12) and (13), which can be comprehended by shifting ACC curve upward along the vertical pac -axis; Meanwhile, “unsatisfactory degree” s is also monotonically increasing with respect to room temperature according to (10). Consequently, we can deduce that a bigger s corresponds to a higher value of the maximum and minimum allowable power of the IAC cluster. Referring to evolution of “unsatisfactory degree” s in Figure 7C, s = −0.354, 0.116. −0.163, −0.421, -0.535 at the 20th, 40th, 60th, 80th, and 100th micro-steps. Hence, the variation rule of the IAC cluster’s maximum and minimum allowable power can be explained.
5.4 Influencing factors of real-time control performance
In this part, we discuss influencing factors of real-time control from two aspects: bias of prediction error and fluctuation amplitude of RES stochastic deviation from the predicted value.
5.4.1 Bias of prediction deviation
Under normal circumstances, the deviation between the predicted value and actual value of RES power generation obeys Gaussian distribution with a mean value of 0. The aforementioned results of real-time control are all obtained based on this assumption. However, positive-definite or negative-definite deviation may occur due to incorrect RES power prediction algorithm or other system failures, which is termed “bias” in this part.
Figure 9 demonstrates real-time control results of the IAC cluster at busbar 25 with a negative-definite bias of -4.5 kW superposed to its power adjustment signal, which requires the IAC cluster to increase power demand by an extra 4.5 kW. It can be noticed that curves of “unsatisfactory degree” are shifted downwards compared with those in Figure 7C. This means the power adjustment is achieved with lower room temperature, which affects the user’s comfort experience. Meanwhile, the actual power of the IAC cluster is shifted upward and reaches the maximum allowable power boundary more frequently. On this occasion, the upward capacity of the IAC cluster is squeezed to 0, and the power adjustment signal may not be fully compensated, as shown at 60th and 90th micro-step in Figure 9B.
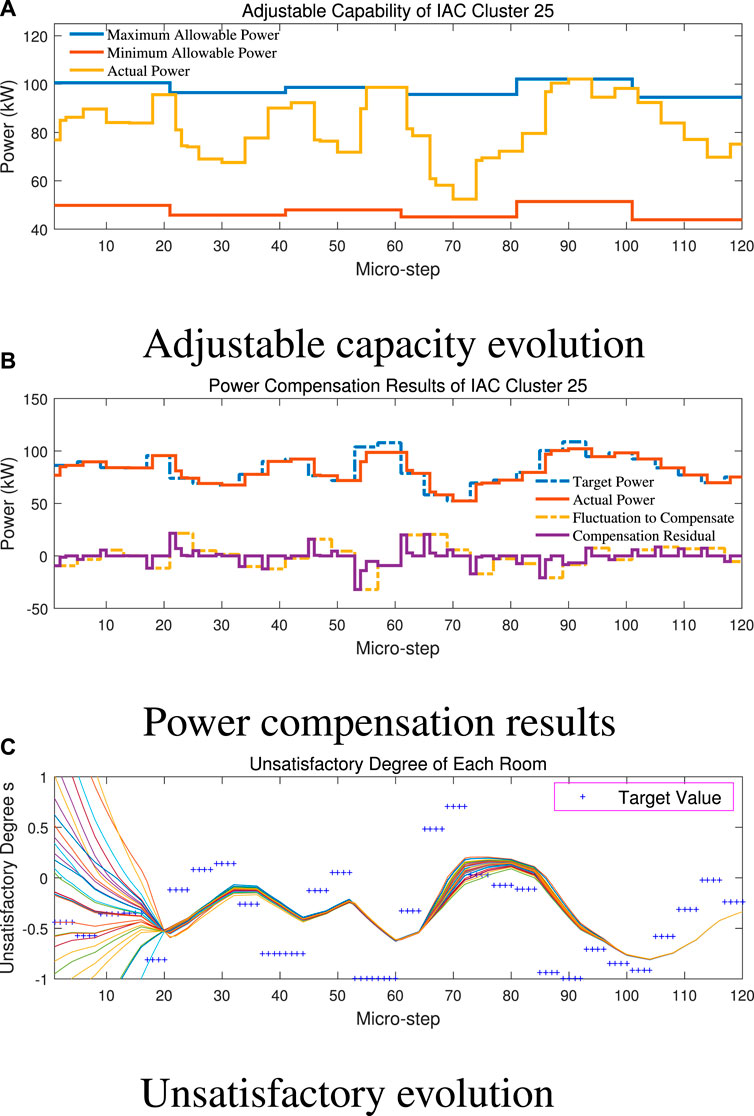
FIGURE 9. Results of real-time control with negative biased RES prediction error. (A) Adjustable capacity evolution. (B) Power compensation results. (C) Unsatisfactory evolution.
Consequently, the bias of prediction deviation will lead to orientated increasing or decreasing of IAC cluster power, which also shifts the variation range of room temperature. The bias should be avoided as far as possible by improving the RES power prediction algorithm or eliminating system faults.
5.4.2 Amplitude of fluctuation
In this part, we amplify the power adjustment signal by 1.88 times to simulate violent RES power fluctuation. The results are calculated and shown in Figure 10.
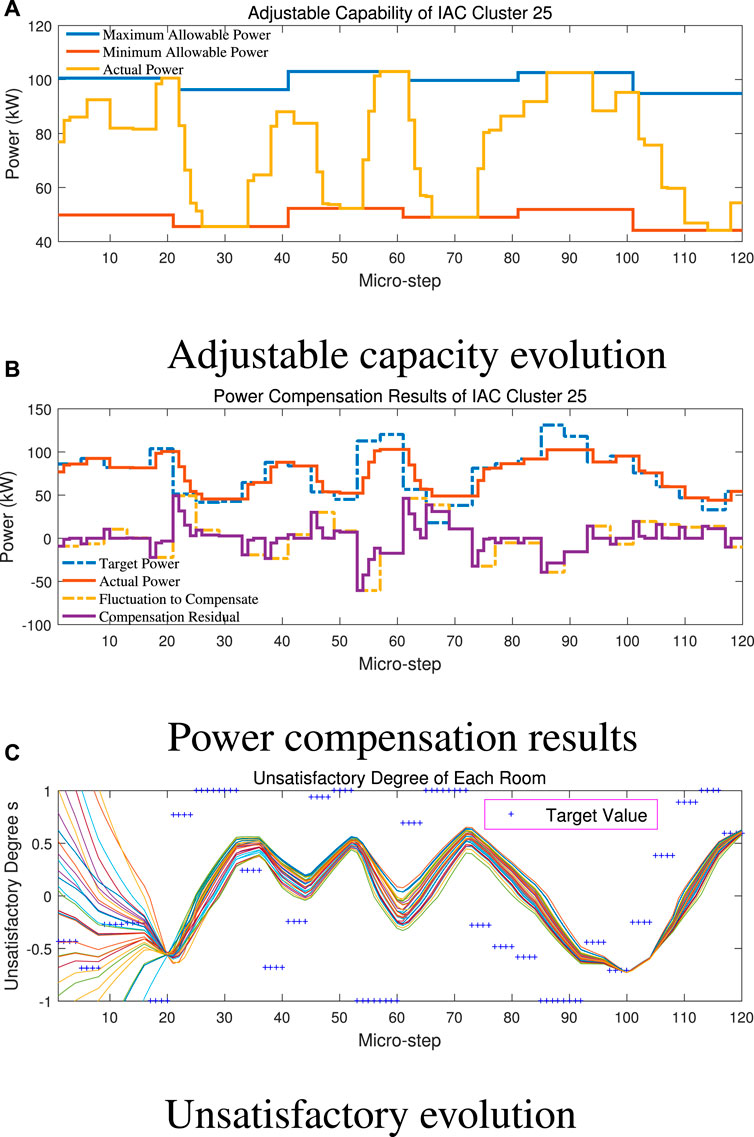
FIGURE 10. Results of real-time control with large power adjustment signal. (A) Adjustable capacity evolution. (B) Power compensation results. (C) Unsatisfactory evolution.
Comparing Figure 10A with Figure 8, we can find that the actual power of IAC will reach maximum or minimum allowable boundary much more frequently under large fluctuation. When this happens, the upward capacity or downward capacity of the IAC cluster will be alternately squeezed to 0, and the power adjustment signal may not be fully compensated, as shown at the 55th, 70th, and 90th micro-steps in Figure 10B. For room temperature or “unsatisfactory degree” in Figure 10C, it is not shifted like the results under the biased situation of RES prediction, but the variation range becomes relatively wider compared with Figure 7C.
In fact, the actual power fluctuation of RES is usually bounded within a maximum range of 20% deviation from the predicted value. Therefore, the power adjustment signal can be fully compensated by the IAC cluster by aggregating a sufficient number of IACs or selecting the appropriate coefficient of distribution proportion.
6 Conclusion
This work proposes an adaptive robust economic dispatch (ARED) and real-time control scheme of the distribution system, which comprehensively takes the uncertainty of RES and flexibility of controllable IAC clusters into consideration. Firstly, the concept of the adjustable capacity curve (ACC) is developed to quantify the exact adjustable capacity of the IAC cluster within a certain time period and guide each IAC to carry out decentralized local model predictive control. Afterward, ARED model for the power dispatch stage is formulated, which incorporates the adjustable capacity of IAC and uncertainty set of RES power generation in the constraints. An iterative solution methodology of ARED is also designed by drawing the experience of the C&CG algorithm, of which the master problem is formulated as a QCQP and the max-min sub-problem is reformulated to a MILP via linear duality theory and big-M method. Finally, to hedge against stochastic RES power fluctuation, a real-time control strategy is also proposed, where IAC clusters provide ancillary power adjustment service based on decentralized control.
A case study on a modified IEEE 33-bus system verifies that ARED model can better guarantee the economic efficiency of the distribution system against the worst uncertainty scenario under different uncertainty budgets. Meanwhile, the real-time control strategy of the IAC cluster is also proved to be effective in eliminating RES power fluctuation without violating the comfort preferences of IAC users. In addition, the influence of biased prediction error and fluctuation amplitude is also analyzed in detail, which can provide a reference for enhancing the operation stability of the IAC cluster under our control strategy. In the future, we will furtherly investigate adjustable capability quantification and real-time control of IAC clusters based on price-based demand response.
Data availability statement
The original contributions presented in the study are included in the article/supplementary material, further inquiries can be directed to the corresponding author.
Author contributions
GC: modeling, simulation, and paper writing; DL: conceptualization and draft-reviewing.
Funding
This work was supported in part by the National Natural Science Foundation of China—Key Program of Joint Fund in Smart Grid (U2166210) and the National Key Research and Development Program of China (Basic Research Class 2017YFB0903000).
Conflict of interest
The authors declare that the research was conducted in the absence of any commercial or financial relationships that could be construed as a potential conflict of interest.
Publisher’s note
All claims expressed in this article are solely those of the authors and do not necessarily represent those of their affiliated organizations, or those of the publisher, the editors and the reviewers. Any product that may be evaluated in this article, or claim that may be made by its manufacturer, is not guaranteed or endorsed by the publisher.
References
Chen, G., and Liu, D. (2021). Hybrid flow model of cyber physical distribution network and an instantiated decentralized control application. CSEE J. Power Energy Syst. (Early Access). doi:10.17775/CSEEJPES.2020.05770
Chen, Y., Wang, Y., Kirschen, D., and Zhang, B. (2018). Model-free renewable scenario generation using generative adversarial networks. IEEE Trans. Power Syst. 33, 3265–3275. doi:10.1109/TPWRS.2018.2794541
Chen, Z., Guo, C., Dong, S., Ding, Y., and Mao, H. (2021). Distributed robust dynamic economic dispatch of integrated transmission and distribution systems. IEEE Trans. Ind. Appl. 57, 4500–4512. doi:10.1109/TIA.2021.3091663
Dai, Y., Kang, Y., and Xiong, X. (2017). Energy development and carbon emission scenarios towards 2050 energy transition and low carbon development roadmap for China. Beijing: China Environmental Publishing House.
Ding, Y., Xie, D., Hui, H., Xu, Y., and Siano, P. (2021). Game-theoretic demand side management of thermostatically controlled loads for smoothing tie-line power of microgrids. IEEE Trans. Power Syst. 36, 4089–4101. doi:10.1109/TPWRS.2021.3065097
Farivar, M., and Low, S. H. (2013). Branch flow model: Relaxations and convexification—Part i. IEEE Trans. Power Syst. 28, 2554–2564. doi:10.1109/TPWRS.2013.2255317
Gao, H., Liu, J., Wang, L., and Wei, Z. (2018). Decentralized energy management for networked microgrids in future distribution systems. IEEE Trans. Power Syst. 33, 3599–3610. doi:10.1109/TPWRS.2017.2773070
Hui, H. X., Ding, Y., and Zheng, M. L. (2019). Equivalent modeling of inverter air conditioners for providing frequency regulation service. IEEE Trans. Ind. Electron. 66, 1413–1423. doi:10.1109/tie.2018.2831192
Jiang, A., and Wei, H. (2018). Distributed cooperation model and optimal control strategy for interaction between large-scale air conditioning and power grid based on communication. Proc. Chin. Soc. Electr. Eng. 38, 6276–6283. doi:10.13334/j.0258-8013.pcsee.172036
Kalantar-Neyestanaki, M., Sossan, F., Bozorg, M., and Cherkaoui, R. (2020). Characterizing the reserve provision capability area of active distribution networks: A linear robust optimization method. IEEE Trans. Smart Grid 11, 2464–2475. doi:10.1109/TSG.2019.2956152
Li, Z., Shahidehpour, M., Wu, W., Zeng, B., Zhang, B., and Zheng, W. (2015). Decentralized multiarea robust generation unit and tie-line scheduling under wind power uncertainty. IEEE Trans. Sustain. Energy 6, 1377–1388. doi:10.1109/TSTE.2015.2437273
Liu, Y., Guo, L., and Wang, C. (2018). Economic dispatch of microgrid based on two stage robust optimization. Proc. CSEE 38, 4013–4022. doi:10.13334/j.0258-8013.pcsee.170500
Lu, Z., Huang, H., Shan, B., Wang, Y., Du, S., and Li, J. (2017). Morphological evolution model and power forecasting prospect of future electric power systems with high proportion of renewable energy. Automation Electr. Power Syst. 41, 12–18. doi:10.7500/AEPS20170109001
Ning, C., and You, F. (2018). Data-driven stochastic robust optimization: General computational framework and algorithm leveraging machine learning for optimization under uncertainty in the big data era. Comput. Chem. Eng. 111, 115–133. doi:10.1016/j.compchemeng.2017.12.015
Roldán, C., Mínguez, R., García-Bertrand, R., and Arroyo, J. M. (2019). Robust transmission network expansion planning under correlated uncertainty. IEEE Trans. Power Syst. 34, 2071–2082. doi:10.1109/TPWRS.2018.2889032
Ruan, H., Gao, H., Liu, J., and Huang, Z. (2019). A distributionally robust reactive power optimization model for active distribution network considering reactive power support of dg and switch reconfiguration. Proceedings Chin. Soc. Electr. Eng. 39, 685–695. doi:10.13334/j.0258-8013.pcsee.180241
Shao, C., Wang, X., Shahidehpour, M., Wang, X., and Wang, B. (2017). Security-constrained unit commitment with flexible uncertainty set for variable wind power. IEEE Trans. Sustain. Energy 8, 1237–1246. doi:10.1109/TSTE.2017.2673120
Shuai, H., Fang, J., Ai, X., Tang, Y., Wen, J., and He, H. (2019). Stochastic optimization of economic dispatch for microgrid based on approximate dynamic programming. IEEE Trans. Smart Grid 10, 2440–2452. doi:10.1109/TSG.2018.2798039
Tan, Z., Zhong, H., Xia, Q., Kang, C., Wang, X. S., and Tang, H. (2020). Estimating the robust p-q capability of a technical virtual power plant under uncertainties. IEEE Trans. Power Syst. 35, 4285–4296. doi:10.1109/TPWRS.2020.2988069
Wei, W., Wang, D., Jia, H., Wang, R., Guo, B., Qu, B., et al. (2016). A hierarchical and distributed control strategy of thermostatically controlled appliances for city park based on load model prediction. Proc. Chin. Soc. Electr. Eng. 36, 2049–2056. doi:10.13334/j.0258-8013.pcsee.2016.08.003
Yang, Y., Wu, W., Wang, B., and Li, M. (2021). Chance-constrained economic dispatch considering curtailment strategy of renewable energy. IEEE Trans. Power Syst. 36, 5792–5802. doi:10.1109/TPWRS.2021.3081120
Yao, Y., and Zhang, P. (2018). Coordinated control method for ancillary services of power system with participation of large-scale inverter air-conditioner. Automation Electr. Power Syst. 42, 127–134. doi:10.7500/AEPS20180131001
Yao, Y., and Zhang, P. (2020). Unified control strategy of heterogeneous thermostatically controlled loads with market-based mechanism. J. Mod. Power Syst. Clean Energy 8, 1231–1239. doi:10.35833/MPCE.2018.000828
Ye, L., Li, Z., Sun, B., Tang, Y., Lan, H., Wu, L., et al. (2018). Optimal dispatch of system integrated wind farm clusters based on stochastic model predictive control considering temporal correlation of wind power. Proc. Chin. Soc. Electr. Eng. 38, 3172–3183. doi:10.13334/j.0258-8013.pcsee.171162
Zeng, B., and Zhao, L. (2013). Solving two-stage robust optimization problems using a column-and-constraint generation method. Operations Res. Lett. 41, 457–461. doi:10.1016/j.orl.2013.05.003
Zhang, Z., Chen, Y., Liu, X., and Wang, W. (2019). Two-stage robust security-constrained unit commitment model considering time autocorrelation of wind/load prediction error and outage contingency probability of units. IEEE Access 7, 25398–25408. doi:10.1109/ACCESS.2019.2900254
Keywords: adaptive robust economic dispatch, column and constraint generation, controllable load, distribution system, inverter air-conditioner, real-time control, uncertainty
Citation: Chen G and Liu D (2023) Adaptive robust economic dispatch and real-time control of distribution system considering controllable inverter air-conditioner clusters. Front. Energy Res. 10:1017892. doi: 10.3389/fenrg.2022.1017892
Received: 12 August 2022; Accepted: 29 August 2022;
Published: 09 January 2023.
Edited by:
Yue Song, The University of Hong Kong, Hong Kong SAR, ChinaReviewed by:
Yingbing Luo, Chongqing University, ChinaTong Han, The University of Hong Kong, Hong Kong SAR, China
Copyright © 2023 Chen and Liu. This is an open-access article distributed under the terms of the Creative Commons Attribution License (CC BY). The use, distribution or reproduction in other forums is permitted, provided the original author(s) and the copyright owner(s) are credited and that the original publication in this journal is cited, in accordance with accepted academic practice. No use, distribution or reproduction is permitted which does not comply with these terms.
*Correspondence: Dong Liu, ZG9uZ2xpdUBzanR1LmVkdS5jbg==