 Zhaowen Wang
 Qipeng Zhang4
- 1Postdoctoral Research Station, Shanghai Waigaoqiao Shipbuilding Co., Ltd., Shanghai, China
- 2Research and Development Department, Shanghai Waigaoqiao Shipbuilding Co., Ltd., Shanghai, China
- 3School of Naval Architecture, Ocean & Civil Engineering, Shanghai Jiao Tong University, Shanghai, China
- 4General Manager Office, Shanghai Waigaoqiao Shipbuilding Co., Ltd., Shanghai, China
LNG is considered a promising alternative fuel for the marine industry with the increasingly strict environmental requirements while the safety problems caused by LNG leakage accidents need to be concerned and analyzed. In this article, the cryogenic safety analysis of the fuel gas preparation room in an LNG-powered ship during LNG leakage accidents was performed by CFD simulations. The simulation results showed as follows: the range of cryogenic region in the fuel gas preparation room was related to flow field direction during LNG leakage; The surface temperature of equipment dropped to some extent during LNG leakage accidents. The temperature drop was less than 15°C, which was confirmed to be a safe temperature range in engineering; In addition, for safety operation analysis, the NG distribution situation of dangerous regions with explosive limit was also obtained.
1 Introduction
Due to the global warming mitigation goal of Paris agreement, countries are paying more attention to the issue of CO2 emission reduction (Fischer et al., 2016). The prospect of substantial reductions in greenhouse gas emissions has brought enormous pressure on the shipping industry, whose CO2 emissions account for about 3% (110 million tons) of global GHG emissions each year (IEA, 2017). Additionally, due to the increasingly severe environmental pollution problem, emissions of NOx, SOx and particulate pollutants are also of concern. In particular, the International Maritime Organization has limited the sulfur content of global ship fuel emissions to 0.5% since 2020 (Peng et al., 2021). Therefore, in the future, the share of ships with alternative fuels will grow dramatically. Some zero-emission ships using hydrogen, ammonia and biofuel lack the infrastructure capacity and comprehensive specifications to satisfy the world shipping needs (Depken et al., 2022) while CO2 emissions of the other marine fuels are shown in Figure 1. Liquefied natural gas (LNG), a kind of clean energy with high energy and fuel efficiency (Burel et al., 2013; Xu et al., 2022), has the lowest CO2 emissions in Figure 1, at least 20% less than traditional oil fuel (DNV, 2019; Sharples, 2019). LNG has virtually no SOx and very low particulate emissions, whose NOx emissions requirements (Lindstad and Rialland, 2020). What’s more, LNG has overcome hurdles with international legislation while its application as the marine fuel has sufficient productivity support in the foreseeable future (Awoyomi et al., 2019). Consequently, LNG is considered to be one of the most promising alternative fuels for ships by Det Norske Veritas (Lee et al., 2020; Ti et al., 2020). Scholars mentioned (James and Renjith, 2021) that a large number of LNG terminals had been built or were under construction for meeting the massive demand of LNG industry development. According to Ocean Forecast 2050, LNG will account for 40–80% of ship fuel by 2050 (DNV, 2019). Since 2000, the number of LNG-powered vessels operating or being built around the world has gradually increased (Baalisampang et al., 2018; Wang et al., 2021).
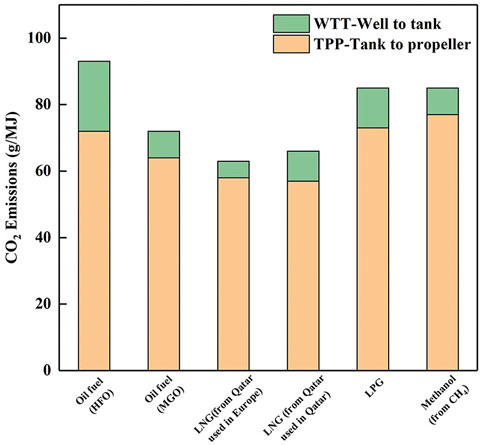
FIGURE 1. CO2 emissions of various marine fuels.
LNG has cryogenic, flammable and explosive physical and chemical characteristics. In recent years, LNG leakage accidents with explosions and cryogenic injuries have occurred frequently, causing severe environmental damage and economic losses (Gz et al.Chai et al., 2016;, 2020). Thus, the safety design analysis for LNG-powered ships is necessary, preferably in the basic design stage (Paik et al., 2011). Many researchers have developed the safety analysis simulation of LNG leakage hazards and established several models, such as zone models, integral models (Puttock, 1987; Shekhar et al., 2018), semiempirical models (Zhou et al., 2013), and computational fluid dynamics (CFD) models (Pula et al., 2005; Blanco and Zingg, 2007; Luketa-Hanlin et al., 2007). Among them, CFD simulation has been widely applied to analyze the leakage risk of LNG-powered ships under various conditions such as cryogenic impact, gas diffusion and explosion progress (Rigas and Sklavounos, 2006; Gavelli et al., 2008). In the context of dual-fuel ships, Fu et al. Fu et al. (2016) exploited a risk assessment systematic framework, identifying risks, modelling probabilistically and evaluating results. Anay (Bu and Dai, 2008) proposed the boundary conditions of LNG leakage simulation. Nubli Nubli and Sohn (2020) simulated the critical zone of LNG gas diffusion and discussed the influence of LNG leakage amount, including wind speed and wind direction on the formation of the critical zone. Zhu et al. Aneziris et al. (2020) clarified the law of gas diffusion concentration in the LNG gasification process through CFD simulation. Li et al. Li et al. (2017) studied the key parameters of LNG leakage through numerical simulation and set up an engineering model based on the simulation results. Qi et al. Qi et al. (2010) applied the ANSYS CFX CFD program to simulate LNG diffusion and researched the essential input parameters in the CFX simulation process, including source term turbulence, atmospheric conditions, LNG evaporation rate, and environment temperature.
Fuel gas preparation room is a vital place to vaporize and heat the gas to a specific temperature and pressure for subsequent use of generator and boiler users on board in an LNG powered ship, which contains lots of essential equipment. Additionally, equipment in the fuel gas preparation room shall be protected against cryogenic injury for the sake of security. However, as shown in Table 1, there are few investigations on the safety analysis for fuel preparation room during LNG leakage accidents, especially cryogenic safety analysis. In this article, the cryogenic safety analysis of the fuel gas preparation room in an LNG-powered ship during LNG leakage was performed. A CFD simulation method was proposed and the cryogenic safety analysis simulation result for the fuel gas preparation room was obtained. Additionally, for the safety operation analysis, the NG distribution situation of dangerous regions with explosive limit was also researched.
TABLE 1. The published literature research.
2 Theory
2.1 Turbulence model
The governing equation of fluid flow performs the following continuity equation and momentum equation, ignoring the heat transmission and alteration of atmospheric pressure, structure and fluid itself.
The inlet fluid satisfies continuity Eq. 1 and Navier-Stokes Eq. 2:
where u is Eulerian velocity, m/s; x is direction, m;
As the following Eqs. 3, 4, the velocity component and pressure component were composed of time average component and fluctuation component:
where
Time average continuity equation:
Time average momentum equation (Navier-Stokes equation):
The flow is assumed as constant and
2.2 Heat transfer theory
Changes in fluid temperature are caused by heat transfer, convection, and radiation. Heat transfer by transferring material, Qm, can be expressed as the heat transfer of particles:
where V is the latent heat of evaporation, determined by the temperature (Bohl and Jackson, 2007).
Additionally, convection heat transfer,
where
where
Finally, radiation flux
where
In general, not affected by the motion of particles, the heat change rate can be calculated by summing that of every particle as follows.
3 Computational fluid dynamics simulation
3.1 Three-dimension (3D) modeling
Figure 2 displayed the schematic diagram of the whole fuel preparation room. The fuel preparation gas room consisted of LNG heater (LH), two boiled off gas (BOG) compressors, low pressure (LP) buffer, processor value unit (PVU), etc., which was divided into four units marked in Figure 2.
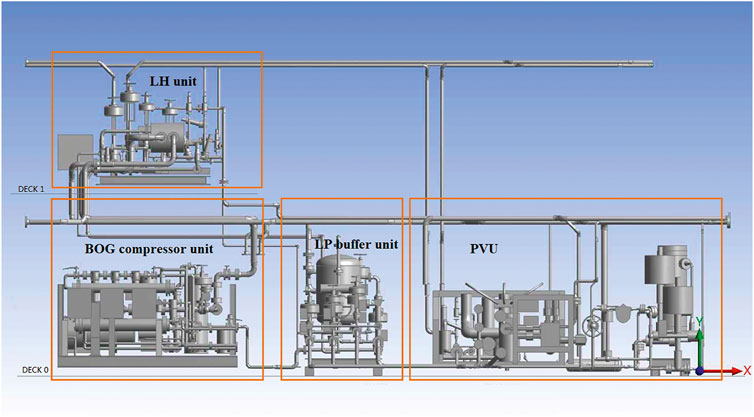
FIGURE 2. 3D schematic diagram of the fuel preparation room.
LNG leakage occurred in the LH unit on the upper deck (Deck one in Figure 2), including a drip tray. Therefore, the LNG safety design analysis in this paper concentrated on the equipment in LH unit, whose structure in detail was exhibited in Figure 3. The safety analysis simulation was carried out in the LH unit on Deck 1 while other units on Deck 0 were not considered.
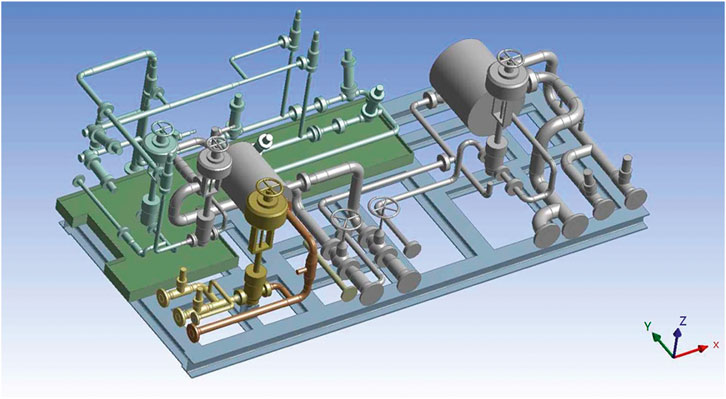
FIGURE 3. 3D schematic diagram of the LH unit on Deck one in fuel gas preparation room.
To analyze the possible cryogenic effects on peripheral equipment of LNG leakage inside the fuel gas preparation room, the 3D model was constructed in Figure 4, whose fluid domain covered the whole room. As shown in Figure 4, the room included two entrances for the inflow of fresh air and two ventilation fan systems for the escape during LNG leakage situation. From Figure 4, the structure of inlet windows, ventilation fans, and equipment in the LH unit were all constructed in detail.
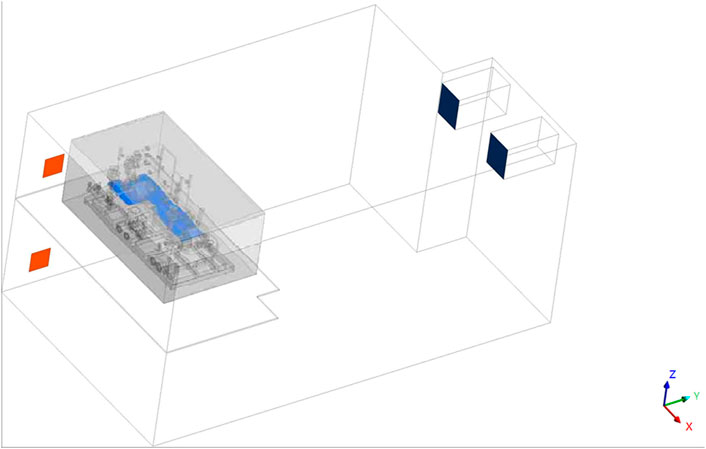
FIGURE 4. 3D modeling of CFD simulation.
3.2 Grid generation
The generated grid of simulation area is displayed in Figure 5, which includes 2.7×10⁷–2.8×10⁷ nods and 1.5×10⁷–1.6×10⁷ elements. The grid independent analysis of the simulation was displayed in Table 2. As shown in Table 2, the errors of the simulation results for Grid 3 and Grid 4 were 0.6% and 0.1% respectively, satisfying the computational requirement. In this article, 2.7×10⁷–2.8×10⁷ nods (Grid) was generated for the simulation, which meets the requirement of high calculation accuracy.
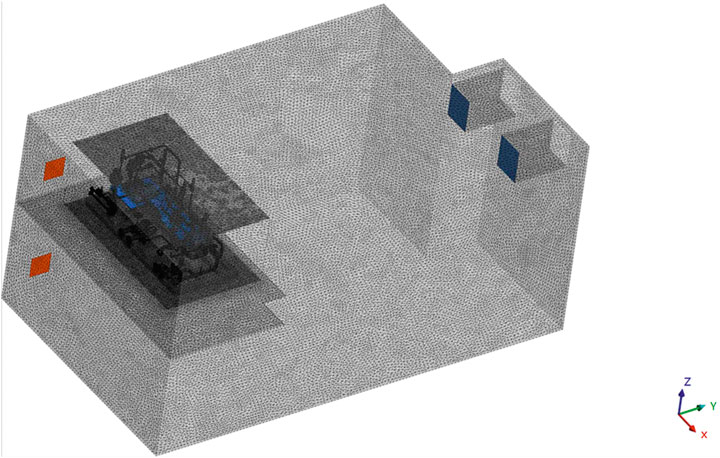
FIGURE 5. Grid of CFD simulation.
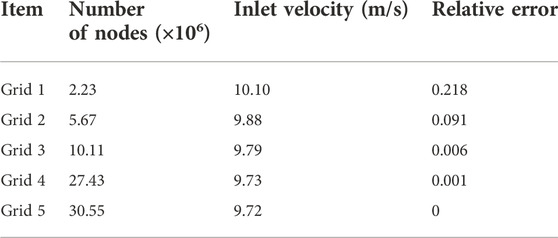
TABLE 2. Grid independent results of the CFD simulation.
For more exact numerical simulation results, the grid of the area around the wall, inlet window, outlet fan, and equipment in the LH unit was constructed with a denser prism layer. The dimensionless wall distance y+ was less than 1 by encrypting the mesh near the wall, while all simulation calculations could converge to less than 10–6. The simulation was calculated on the cluster computer with 240 CPUs. And, ANSYS CFX V.20.1 software was adopted for the numerical analysis in this paper.
3.3 Boundary condition and simulation setup
The boundary conditions during the numerical simulation were exhibited in Figure 6. As shown in Table 3, the inlet was set as pressure inlet while the outlet was set as pressure outlet. The walls are subjected to no slip condition. Due to the detector instrument and emergency shutdown device, the LNG leakage process in the fuel gas preparation room takes a short time. Then, the LNG leakage can be predicted to be the most dangerous scenario in which the total amount of leaked LNG is gathered on the drip tray at once. Therefore, the cryogenic safety simulation in this paper assumed that the leaked LNG was all concentrated in the drip tray. And, the volume amount of leaked LNG is listed in Table 4.
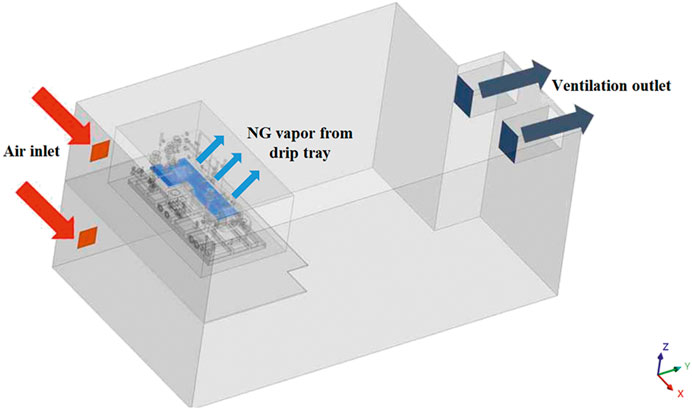
FIGURE 6. Diagrammatic sketch of boundary conditions during the CFD simulation.
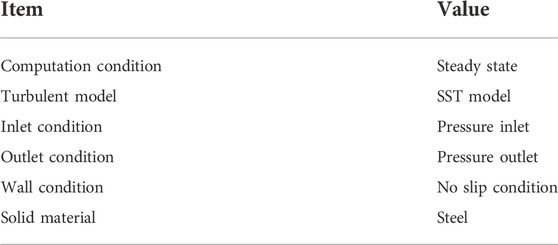
TABLE 3. Boundary conditions of the CFD analysis.
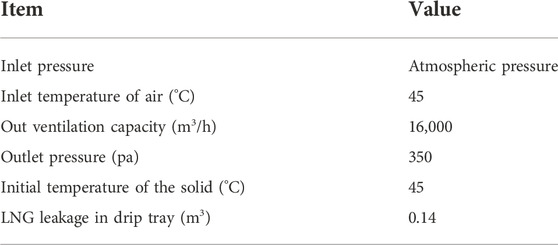
TABLE 4. Setting parameters during the CFD analysis.
Table 4 displayed the setting parameters of the simulation, which were selected on the basis of the engineering experience and actual condition in the LNG-powered ship. As shown in Table 4, the ventilation situation by two ventilation fans was regarded as a boundary condition while the inlet pressure was assumed to be atmospheric pressure. For the most active heat exchange and the most extensive range of cryogenic effects, the air temperature was set at the highest environment temperature of 45°C. The LNG evaporation rate, an important parameter of LNG leakage simulation, depended on the amount of LNG leakage volume in the drip tray, ambient temperature, and ambient flow velocity around the drip tray. In addition, ventilation is considered more active than evaporation. For the evaluation of ambient flow velocity, the ventilation flow analysis was firstly carried out without consideration of LNG leakage situation, and then the flow velocity around the drip tray was obtained as 1.1 m/s. In addition, it could be predicted that it took approximately 2–3 h for LNG to transform into NG gradually. Therefore, the simulation analysis process was assumed to be a steady state.
4 Simulation results
4.1 Flow field simulation results
In order to better analyze and describe the simulation results, we selected four section planes YZl, YZm, XZl and XZm as reference planes, as shown in Figure 7. The planes YZl and YZm were perpendicular to the X-axis, while XZl and XZm were perpendicular to the Y-axis. Additionally, YZm and XZm were respectively located in the middle of the length and width of the drip tray.
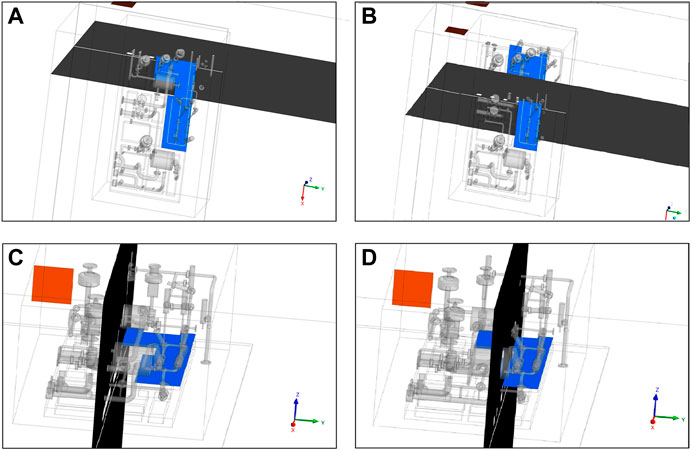
FIGURE 7. The defined planes to shown the simulation results. (A) YZ1; (B) YZm (C) XZ1; (D) XZm.
The pressure and velocity field simulation results were shown in Figures 8, 9, respectively. As seen in Figure 8, there was a vortex area with larger pressure value in the YZm plane because of the ventilation system and the air inflow direction along the X-axis. In a micro negative pressure state, the pressure value of other areas in the fuel preparation room is more uniform. From Figure 9, the velocity value distribution had a similar tendency corresponding to the pressure value distribution while a vortex area with high velocity was near the entrances. The whole fuel gas preparation room was basically at about -80 Pa negative pressure by the ventilation system, which resulted in the inflow of air under the atmospheric pressure from entrances. In Figure 9, there was an area with a high velocity about 10 m/s flow velocity near the inlet while the flow velocity of other regions was relatively low. The velocity above the drip tray was 1–2 m/s, which influenced the LNG evaporation rate. Then, the fuel gas preparation was normally ventilated at a low wind speed (most area) to deal with sudden LNG leakage accidents.
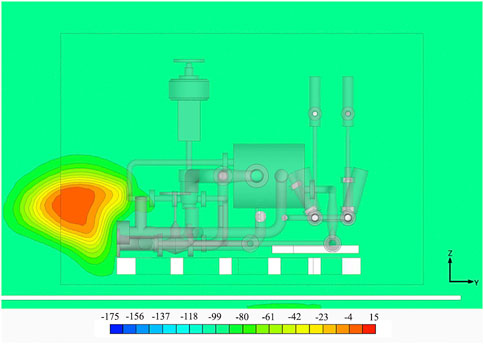
FIGURE 8. Pressure field simulation results of the LH unit. (A) YZm; (B) XZm.

FIGURE 9. Velocity field simulation results of the LH unit. (A) YZm; (B) XZm.
4.2 Temperature field simulation results
The ventilation was more active compared to evaporation, resulting in active heat exchange and expansion of cryogenic regions. The simulation results of temperature field distribution near the drip tray were displayed in Figure 10. Dramatic heat exchange occurred at very short intervals in the drip tray, causing a tiny range of intense temperature decreases. Therefore, for a more intuitive and meaningful description, the legend of temperature in Figure 10 was set as 0°C–45°C rather than −163°C–45°C. The temperature of most areas in the LH unit is stable, which is the same as incoming air temperature. The temperature field near the drip tray should be paid more attention to with a lower temperature than the surrounding environment temperature, due to the heat exchange and evaporation from ultra-low temperature LNG in the drip tray. As seen in Figure 10, the cryogenic region accounted for a small percentage of LH unit, gathering above the drip tray. What’s more, except for a pretty thin area near the drip tray, the temperature of the cryogenic region varied from 25°C to 45°C, which was less than 20°C below the ambient temperature.

FIGURE 10. Temperature field simulation results of the LH unit. (A) YZ1; (B) YZm (C) XZ1; (D) XZm.
From Figure 9, there was a distinct airflow in the positive direction of the X-axis and a slight airflow in the negative direction of the Y-axis, resulting in the extension of the cryogenic area in Figure 10. It could be known from Figures 10C,D that the cryogenic area developed apparently along the positive direction of the X-axis through some pipes and devices, which should be concerned on in the equipment surface temperature analysis (Section 4.3).
4.3 Equipment surface temperature and NG dispersion results
The cryogenic effects for equipment are exhibited by the surface temperature simulation results. It can be seen from Figure 11 that the surface temperatures of all the pipes, valves and devices in the LH unit were carried out to explore the cryogenic effect on the equipment during LNG leakage. From Figure 11, some cryogenic regions whose temperature dropped less than 15°C were identified on the equipment surface in the LV unit, which was confirmed to be a safe temperature range in engineering. In addition, for safety analysis of crew operations, NG dispersion in the explosive range was exhibited with blue clouds in Figure 11. The lower explosive limit (LEL) and upper explosive limit of NG were respectively 5% and 15% volume concentration while, according to the IGF code (Lantz), electrical equipment shall be automatically disconnected when the gas concentration was greater than 40% LEL. Therefore, the gas cloud of NG dispersion with 2–15% volume concentration was expressed in Figure 11, in which explosion risk shall be considered and crew operation for equipment shall be with caution. The gas cloud in Figure 11 also confirmed that the gaseous NG diffuses mainly to the outlet along the positive direction of the X-axis, accompanied by diffusion disturbance in the Y direction. It could be concluded from Figures 10, 11 that the cryogenic areas of the equipment surface were caused by forced heat transfer when cryogenic NG flowed through these areas. The equipment surface temperature simulation results were relevant to the amount of cryogenic fuel evaporation and flow field situation.
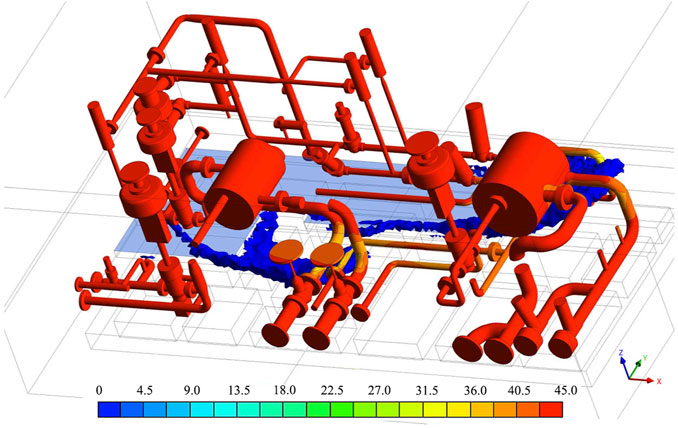
FIGURE 11. Simulation results of equipment surface temperature and NG distribution of dangerous region.
When the position of some equipment, especially the drip tray, changes, the ambient air flow rate may improve, or the heat exchange may enhance. In this situation, more evaporation of NG can be expected. The equipment surface temperature could be reduced to a dangerous degree with much stronger evaporation, lower than −30°C. However, in the fuel gas preparation room of this paper, this dangerous situation is expected to be a possible scenario if only the evaporation proceeds 10 times faster than the recent predictions by calculation. Therefore, in this paper, equipment in the fuel gas preparation room is at a safe temperature even if some conditions changes to increase the evaporation rate. The dangerous situation needs to be considered in other application scenarios of cryogenic safety analysis.
5 Conclusion
The cryogenic safety analysis of fuel gas preparation room during LNG leakage is of great significance to stable operation and safety design in the LNG-powered ship. In this article, a 3D CFD simulation method was applied to investigate cryogenic influences of LNG leakage on the fuel gas preparation room based on ANSYS CFX. The SST model was used for the CFD analysis, which is a turbulent model that can effectively predict internal and wall flow. The simulation results are drawn as follows.
1) The range of cryogenic regions in the fuel gas preparation room during LNG leakage was related to the flow field in the room, for the ventilation was more active than evaporation.
2) The surface temperature of some equipment near the drip tray had a drop less than 15°C, which was confirmed to be a safe temperature range in engineering.
3) When the evaporation rate proceeds faster than 10 times, the equipment surface temperature of cryogenic regions will reduce to a dangerous degree. The equipment in the fuel gas preparation room is at a safe temperature even if some conditions changes to increase the evaporation rate.
4) In addition, the vapour cloud of dangerous regions with explosive limit was also obtained, which is meaningful for equipment control and safe operation.
Data availability statement
The original contributions presented in the study are included in the article/Supplementary Material, further inquiries can be directed to the corresponding author.
Author contributions
XL, YW and JZ contributed to the conception, investigation, and analysis of the study. ZW and QZ contributed to the writing of the manuscript. All authors contributed to manuscript revision. All authors agree to be accountable for the content of the work and approved the submitted version.
Acknowledgments
The authors gratefully acknowledge the High-tech ship research project team of Shanghai Waigaoqiao Shipbuilding Co., Ltd.
Conflict of interest
ZW, QZ, YW, XL, and JZ were employed by Shanghai Waigaoqiao Shipbuilding Co., Ltd.
Publisher’s note
All claims expressed in this article are solely those of the authors and do not necessarily represent those of their affiliated organizations, or those of the publisher, the editors and the reviewers. Any product that may be evaluated in this article, or claim that may be made by its manufacturer, is not guaranteed or endorsed by the publisher.
Abbreviations
LNG, Liquefied natural gas; CFD, Computational fluid dynamics; SST, Shear stress transport; FES, Finite element simulation; NG, Natural gas; LEL, Lower explosive limit; UEL, Upper explosive limit; LH, LNG heater; BOG, Boiled off gas; LP, Low pressure; PVU, Processor value unit; Re, Reynold Number.
References
Aneziris, O., Koromila, I., and Nivolianitou, Z. (2020). A systematic literature review on LNG safety at ports. Saf. Sci. 124, 104595. doi:10.1016/j.ssci.2019.104595
Awoyomi, A., Patchigolla, K., and Anthony, E. J. (2019). Process and economic evaluation of an onboard capture system for LNG-fueled CO2 carriers. Ind. Eng. Chem. Res. 59, 6951–6960. doi:10.1021/acs.iecr.9b04659
Baalisampang, T., Abbassi, R., Garaniya, V., Khan, F., and Dadashzadeh, M. (2018). Review and analysis of fire and explosion accidents in maritime transportation. Ocean. Eng. 158, 350–366. doi:10.1016/j.oceaneng.2018.04.022
Blanco, M., and Zingg, D. W. (2007). Newton-Krylov algorithm with a loosely coupled turbulence model for aerodynamic flows. Aiaa J. 45 (5), 980–987. doi:10.2514/1.22972
Bohl, D., and Jackson, G. (2007). Experimental study of the spill and vaporization of a volatile liquid. J. Hazard. Mater. 140 (1-2), 117–128. doi:10.1016/j.jhazmat.2006.06.076
Bu, G. K., and Dai, G. L. (2008). Leakage characteristics of the glass fabric composite barriers of LNG ships. Compos. Struct. 86 (1-3), 27–36. doi:10.1016/j.compstruct.2008.03.021
Burel, F., Taccani, R., and Zuliani, N. (2013). Improving sustainability of maritime transport through utilization of Liquefied Natural Gas (LNG) for propulsion. Energy 57 (57), 412–420. doi:10.1016/j.energy.2013.05.002
Chai, S., Garaniya, V., and Abbassi, R., (2016). AN inherently safer layout design for the liquefaction process of an flng plant. Int. J. Marit. Eng. 158 (PT.A2), A91–A102. doi:10.5750/ijme.v158ia2.978A91-A102
Depken, J., Dyck, A., Ro, L., and Ehlers, S. (2022). Safety considerations of hydrogen application in shipping in comparison to LNG. Energies 15, 3250. doi:10.3390/en15093250
DNV (2019). Assessment of selected alternative fuels and technologies. Available at: https://www.dnv.com/maritime/publications/alternative-fuel-assessment-download.html (Accessed date 9 August 2022).
Fischer, E., Rogelj, M., Joeri, L., Lissner, T., and Licker, R., (2016). Science and policy characteristics of the Paris Agreement temperature goal. Nat. Clim. Chang. 9, 827–835. doi:10.1038/nclimate3096
Fu, S. S., Yan, X. P., Zhang, D., Li, C. Y., and Zio, E. (2016). Framework for the quantitative assessment of the risk of leakage from LNG-fueled vessels by an event tree-CFD. J. Loss Prev. Process Industries 43, 42–52. doi:10.1016/j.jlp.2016.04.008
Gavelli, F., Bullister, E., and Kytomaa, H. (2008). Application of CFD (Fluent) to LNG spills into geometrically complex environments. J. Hazard. Mater. 159 (1), 158–168. doi:10.1016/j.jhazmat.2008.02.037
Gz, A., Xg, A., Yan, Y. A., Wei, T. A., and Chao, J. (2020). Experiment and simulation research of evolution process for LNG leakage and diffusion. J. Loss Prev. Process Industries 64, 104041. doi:10.1016/j.jlp.2019.104041
IEA (2017). Energy Technology perspectives 2017: Catalysing agency. Paris, France: IEA. doi:10.1787/d07136f0-en
James, S., and Renjith, V. R. (2021). Risk assessment and vulnerability analysis of liquefied natural gas (LNG) regasification terminal. Process Integr. Optim. Sustain. 5 (1), 99–121. doi:10.1007/s41660-020-00138-3
Jones, W. P., and Launder, B. E. (1972). The prediction of laminarization with a two-equation model of turbulence. Int. J. Heat. Mass Transf. 15 (2), 301–314. doi:10.1016/0017-9310(72)90076-2
Khetib, Y., Melaibari, A., and Alsulami, R. (2021). The influence of combined turbulators on the hydraulic-thermal performance and exergy efficiency of mwcnt-Cu/water nanofluid in a parabolic solar collector: A numerical approach. Front. Energy Res. 9, 716549. doi:10.3389/fenrg.2021.716549
Lee, H. J., Yoo, S. H., and Huh, S. Y. (2020). Economic benefits of introducing LNG-fuelled ships for imported flour in South Korea. Transp. Res. Part D Transp. Environ. 78, 102220. doi:10.1016/j.trd.2019.102220
Li, L., Choi, J., Bang, J., Lee, S., Lee, S. H., and Kim, D. (2017). Numerical investigation of LNG gas dispersion in a confined space: An engineering model. J. Mech. Sci. Technol. 31 (9), 4533–4540. doi:10.1007/s12206-017-0853-2
Lindstad, E., and Rialland, A. (2020). LNG and cruise ships, an easy way to fulfil regulations-versus the need for reducing GHG emissions. Sustainability 12 (5), 2080. doi:10.3390/su12052080
Luketa-Hanlin, A., Koopman, R. P., and Ermak, D. L. (2007). On the application of computational fluid dynamics codes for liquefied natural gas dispersion. J. Hazard. Mater. 140 (3), 504–517. doi:10.1016/j.jhazmat.2006.10.023
Menter, F. R. (1992). Influence of freestream values on K-omega turbulence model predictions. Aiaa J. 30 (6), 1657–1659. doi:10.2514/3.11115
Nubli, H., and Sohn, J. M. (2020). CFD-based simulation of accidental fuel release from LNG-fuelled ships. Ships Offshore Struct. 17, 339–358. doi:10.1080/17445302.2020.1827806
Paik, J. K., Czujko, J., Kim, B., Seo, J. K., Han, S. R., Ha, Y. C., et al. (2011). Quantitative assessment of hydrocarbon explosion and fire risks in offshore installations. Mar. Struct. 24 (2), 73–96. doi:10.1016/j.marstruc.2011.02.002
Peng, Y., Zhao, X. Z., Zuo, T. L., Wang, W. Y., and Song, X. Q. (2021). A systematic literature review on port LNG bunkering station. Transp. Res. Part D Transp. Environ. 91, 102704. doi:10.1016/j.trd.2021.102704
Pula, R., Khan, F. I., Veitch, B., and Amyotte, P. R. (2005). Revised fire consequence models for offshore quantitative risk assessment. J. Loss Prev. Process Industries 18 (4-6), 443–454. doi:10.1016/j.marstruc.2011.02.002
Puttock, J. S. (1987). Comparison of thorney island data with predictions of hegabox hegadas. J. Hazard. Mater. 16, 439–455. doi:10.1016/0304-3894(87)80047-X
Qi, R. F., Ng, D., Cormier, B. R., and Mannan, M. S. (2010). Numerical simulations of LNG vapor dispersion in brayton fire training field tests with ANSYS CFX. J. Hazard. Mater. 183 (1-3), 51–61. doi:10.1016/j.jhazmat.2010.06.090
Rigas, F., and Sklavounos, S. (2006). Simulation of coyote series trials—Part II: A computational approach to ignition and combustion of flammable vapor clouds. Chem. Eng. Sci. 61 (5), 1444–1452. doi:10.1016/j.ces.2005.09.005
Sharples, J. (2019). LNG supply chains and the development of LNG as a shipping fuel in northern europe. Oxford United Kingdom: oxford institute for energy studies. doi:10.26889/9781784671266
Shekhar, R., Gortschakow, S., Grosshans, H., and Uhrlandt, D. (2018). Numerical investigation of transient, low-power metal vapour discharges occurring in near limit ignitions of flammable gas. J. Phys. D. Appl. Phys. 52 (4), 045202. doi:10.1088/1361-6463/aaed04
Ti, A., Gl, B., At, A., Es, A., and Vc, A. (2020). Sustainability of cruise ship fuel systems: Comparison among LNG and diesel technologies. J. Clean. Prod. 260, 121069. doi:10.1016/j.jclepro.2020.121069
Wang, C., Ju, Y. L., and Fu, Y. Z. (2021). Comparative life cycle cost analysis of low pressure fuel gas supply systems for LNG fueled ships. Energy 218, 119541. doi:10.1016/j.energy.2020.119541
Xu, J., Lin, W., Chen, X., and Zhang, H. (2022). Review of unconventional natural gas liquefaction processes. Front. Energy Res. 10. 915893. doi:10.3389/fenrg.2022.915893
Keywords: LNG powered ship, LNG leakage, cryogenic safety analysis, CFD simulation, fuel gas preparation room, SST modeling
Citation: Wang Z, Zhang Q, Wang Y, Li X and Zhou J (2023) Computational fluid dynamics simulation of cryogenic safety analysis in an liquefied natural gas powered ship during liquefied natural gas leakage. Front. Energy Res. 10:1015904. doi: 10.3389/fenrg.2022.1015904
Received: 10 August 2022; Accepted: 26 September 2022;
Published: 11 January 2023.
Edited by:
Sudhakar Babu Thanikanti, Chaitanya Bharathi Institute of Technology, IndiaReviewed by:
Joaquin De La Morena, Polytechnic University of Valencia, SpainRuomiao Yang, Zhejiang Chinese Medical University, China
Copyright © 2023 Wang, Zhang, Wang, Li and Zhou. This is an open-access article distributed under the terms of the Creative Commons Attribution License (CC BY). The use, distribution or reproduction in other forums is permitted, provided the original author(s) and the copyright owner(s) are credited and that the original publication in this journal is cited, in accordance with accepted academic practice. No use, distribution or reproduction is permitted which does not comply with these terms.
*Correspondence: Zhaowen Wang, MzEyMDEwMTMzOUB6anUuZWR1LmNu