 Shuifeng Hong1,2
 Yimin Luo
- 1School of Economics and Management, China University of Geosciences, Wuhan, China
- 2Research Centre of Resource and Environmental Economics, School of Economics and Management, China University of Geosciences, Wuhan, China
Nickel, an essential strategic emerging mineral in China, plays a vital role in promoting the development of the new energy vehicle industry and protecting the security of energy resources. However, the linkage between international and domestic nickel futures markets and the spot market is increasing. It is necessary to analyze and study the correlation characteristics and influence mechanisms to help investors avoid risks and judge the market situation which will improve the risk control ability and promote the steady development of the domestic market. Therefore, from the perspective of international and domestic markets and based on the yield sequence of the nickel futures prices and the spot prices, the study first discusses the characteristics of the volatility aggregation effect and asymmetries of the nickel futures and spot prices. Second, select an appropriate GARCH model to fit the marginal distribution sequence of the yields. Third, use the Copula function to connect the financial time series to find the correlation. The results indicate that the Copula-GARCH model can better fit the tail correlation between nickel futures market and spot market. Finally, we put forward policy recommendations for strengthening and improving the domestic nickel futures market, actively participating in the international competition mechanism, and preventing and controlling the risk of market price fluctuations.
Introduction
For the first time, mineral and power security were discussed at the Political Bureau of the CPC Central Committee meeting on 18 November 2021, elevating mineral security to the status of a national strategy. First, a long-term stable supply of mineral resources must be guaranteed. Second, we must prevent wildly fluctuating mineral resource prices. The market supply, psychology, finance, trade, and other elements to encourage the metal nickel futures prices have varied drastically. Nickel is an essential new energy mineral. The London Metal Exchange (LME) nickel price once again passed the $100,000/ton mark on 10 March 2022, hitting its most significant historical level. The SMM Nickel also followed LME nickel’s lead at that time. However, despite being nickel-poor, China is the largest consumer of nickel resources all over the world. According to Antaike statistics, China’s nickel dependence on foreign nations will reach an all-time high of 85% in 2020, indicating that China’s nickel dependence has been above 80% since 2015. Due to China’s extensive reliance on imported nickel resources, the local nickel price is greatly influenced by the price of nickel in other countries. To better understand the international and domestic nickel markets, increase the security of the supply of nickel from mines, and ensure the long-term steady and healthy growth of the Chinese nickel period spot market, it is helpful to study the correlation between domestic nickel period spot price and international nickel futures price.
The Copula function is suitable for analyzing the correlation between variables. Scholars mainly use it to study the correlation between multiple financial markets. (Sklar 1959) first proposed using the Copula function to connect the marginal distribution of multivariate joint distribution function variables to realize the analysis of complex correlation. Next, Nelson 1999) systematically summarized the theory of Copula function and its basic properties. Using the Copula function for correlation risk analysis has gradually become a standard. Although domestic research started late, it has made some achievements. The research scope mainly focuses on the correlation between the stock markets (Feng et al., 2016), stock market and crude oil price (Zhu et al., 2016; Liu and He 2020); the model can also be used to measure the comprehensive risk of China’s carbon financial market (Wang et al., 2022) and analyze the correlation between exchange rate correlation and economic fundamentals (Gong et al., 2022). Presently, the research on the correlation of capital market is mainly focused on the domestic market, and there is less research on the correlation between international and domestic markets. However, with the development of the Chinese capital market, the correlation between international and domestic markets is closer, and the research on the correlation between domestic and international markets is becoming more and more critical. Therefore, this paper uses international and domestic perspectives as an entry point for research.
The GARCH model can accurately simulate the change of volatility of time series variables which enables people to grasp the risk fluctuation more accurately. For example, the volatility of crude oil prices is predicted based on the relevant GARCH model, which improves the forecasting ability of crude oil futures volatility (Klein et al., 2016; Wu et al., 2019; Verma et al., 2021); in addition, the correlation GARCH model can be used to study the relationship between emerging markets and stock market volatility (Nathani et al., 2022). Therefore, the GARCH model has excellent performance in price volatility and risk prediction. But there is less research on the nickel market based on the GARCH model, this paper decides to use it to study the nickel futures market and the spot market to make a contribution to the research in this field.
In the application of the Copula-GARCH model, scholars mainly used it to analyze the correlation between stocks, bonds, crude oil, and other markets. For instance, the Copula-GARCH model can be used to analyze the dependence of financial assets (Jondeauel 2006; Yu 2018); the model can also be used for the correlation analysis of the Shanghai, Hong Kong and Shenzhen Stock Exchanges. After the implementation of the Shanghai-Hong Kong Stock Connect policy, the tail correlation coefficient between Shanghai Stock Exchange Index and Hang Seng Index increased significantly. The daily yield sequences of the Shanghai and Shenzhen stock markets have a strong correlation and symmetry. When the Shanghai and Shenzhen stock markets fluctuate sharply, the synergistic effect of the yield sequences of the two markets will be significantly enhanced (Hou et al., 2019; Shi et al., 2021). At the same time, some scholars used the model to study the correlation and risk spillover effect of the stock market and found that the financial return series has the characteristics of time-varying fluctuations, high peaks and thick tails (Tang 2014; Wang 2017). Based on the Copula-GARCH model, some scholars have studied the correlation between the financial and real estate markets in mainland China and Hong Kong. The study showed a correlation between the financial and real estate markets in mainland China and Hong Kong (Sui et al., 2019); and some scholars based on the model and the empirical analysis of the Istanbul Stock Exchange, analyze the correlation between oil price and the stock market. The results show that all stock market returns and oil price changes are positively correlated, and there is a weak dependence structure between Istanbul Stock Exchange and Brent crude oil price (Ayse 2019; Kouki et al., 2019).
The Copula-GARCH model is also applied to other aspects. Some scholars studied the hedging effect based on the Copula-GARCH model, it is found that the margin of stock index futures and the exchange rate will have a certain impact on the hedging effect (Guo et al., 2017; Yu et al., 2019; Zhu et al., 2020). The Copula-GARCH model also plays an important role in the study of the interdependence between oil prices and exchange rates. The study shows that there is a mutual relationship between two variables which helps to diversify risks and achieve inflation targeting. (Aloui et al., 2013; He et al., 2019, Thai Hung; Ngo 2019), and some studies have evaluated the conditional dependence structure of commodity futures markets based on the Copula-GARCH model, and the analysis shows that there are significant differences in the correlation between commodity futures (Just et al., 2020). In addition, Quantile causality and the DCC Copula-GARCH method are used to analyze the causal relationship between exchange rate and real estate price in boom and bust markets, the study shows that there is a greater causality between house prices and exchange rates in the booming market compared to the bust market (Woraphon et al., 2022).
Through the research of nickel futures and spot prices, it is found that nickel futures have a certain price discovery function. Based on the Johansen cointegration test and wavelet coherence analysis, the researchers compared the price discovery efficiency of Chinese non-ferrous metal futures and found that nickel futures price could guide spot price to a certain extent (Yu 2019); and then, based on the distributed lag model, the study analyzed the network evolution of the linkage effect between nickel futures and spot prices which shows that the change in spot prices is caused by the change in nickel futures prices (Dong et al., 2019). Making full use of the price discovery function of nickel futures is beneficial to Chinese investors to avoid the risk in time and realize hedging. The COVID-19 pandemic has had a huge impact on traditional energy manufacturing, with geopolitical risks in the low frequency band, unprecedented impacts on economic policies and stock volatility of oil prices plummeting (Nwosa Philip Ifeakachukwu, 2021; Zhu et al., 2021; Zhang et al., 2021; Sharif et al., 2020; Adedeji Abdulkabir et al., 2021). But to some extent, it has also promoted the development of new energy industries. Research on new energy minerals has gradually become a hot topic.
In conclusion, the research on the correlation of financial time series in the existing literature tends to focus on stocks, bonds, crude oil and other fields, while there are fewer studies on the correlation of new energy minerals (such as lithium, cobalt and nickel). However, new energy minerals have been widely concerned with the advancement of global “carbon neutrality” in recent years. Since last year, the soaring price of nickel futures has exposed China to price and supply security risks. Therefore, it is necessary to effectively avoid market risks by analyzing the correlation of nickel price fluctuations.
What’s more, this paper discusses the correlation between the nickel futures market and spot market from international and domestic perspectives, which overcome the shortcoming that previous studies only considered domestic market or international market. Besides, this article adopts the method of combining the GARCH model and the Copula function to build the Copula-GARCH model to describe the correlation between international and domestic markets. This method not only overcomes the limitations of selecting a single model in previous studies but also can better portray the nonlinear relationship between the series from the perspective of probability. This research is of great significance for regulating the domestic market risk, providing a basis for prognosis in the context of the current international market form, and avoiding systemic risk.
Theoretical model
The Copula-GARCH model is mainly used to analyze multivariate financial time series’ correlation and distribution characteristics. In this paper, the GARCH model is used to describe the conditional marginal distribution of each yield series, and the Copula function is used to link the financial time series. It is to convert the obtained conditional edge function by probability integration, and the Copula function connects the new series to depict the correlation relationship between them. The definition of the GARCH-t model and the Copula function as follows.
Construction of marginal distribution model
The conditional distributions of financial time series predominantly present peaks, thick tails, time-varying, and skewed characteristics. The t-distribution can perfectly describe these characteristics, and the GARCH model can describe the series’ volatility. Generally, the GARCH (1,1) model can be used to fit the time-varying and volatility of each financial time series. The t-GARCH (1,1) model is expressed as follows:
Where
The construction of EGARCH model
The expression of the EGRACH model, which is used to characterize the asymmetry of fluctuations. The model is as follows:
Where if
Construction of copulas connect function
Selecting the bivariate Gaussian-Copulas function and the bivariate t-Copulas function describe the serial correlation. The distribution and denisity function of the bivariate t-Copulas function are respectively defined as follows:
Where
The distribution and density function of the bivariate t-Copula function with a degree of freedom
Where
Empirical analysis
Data selection and statistical description
To examine the futures and spot price fluctuations of nickel association, this article selects the London Metal Exchange (LME) and Shanghai Nonferrous Metals Mesh (SMM) nickel daily closing prices as the domestic and international nickel futures prices, the domestic nickel daily market prices as the nickel spot price, with a sample period of 1 April 2015, to 29 April 2022, a total of 1722 sets of daily nickel price data.
As can be seen from the data in Table 1, the means of the three yield sequences are relatively small and greater than 0, the skewness is less than 0 and the kurtosis is greater than 3. We can find that the yield sequences have left skewness, and the series has the phenomenon of “sharp peak and thick tail.” The probability values are all less than 0.05, indicating that the null hypothesis that the series follows normal distribution is rejected. That is to say, the LME Nickel and spot yield series do not follow the normal distribution, and the J-B statistic values are both large, which further indicates that the distribution of the yield series is not normal.
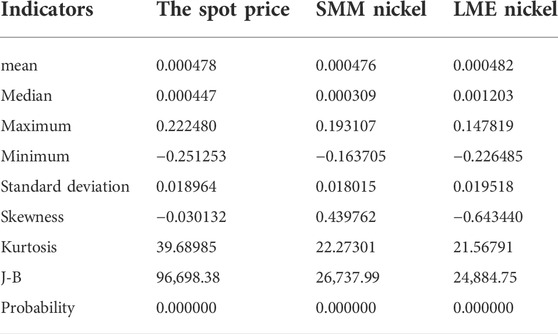
TABLE 1. Statistical descriptions.
Since the GARCH model can better reflect the conditional heteroscedasticity of the data that does not follow the normal distribution, and can reflect the characteristics of the peaks and thick tails of the sequences. Therefore, it is appropriate to use the GARCH model for fitting the sequences in this paper. The time series of the yield series is shown in Figure 1. By observing the time series, it can be found that the yield series of domestic and international nickel futures have significant characteristics of volatility aggregation effect.
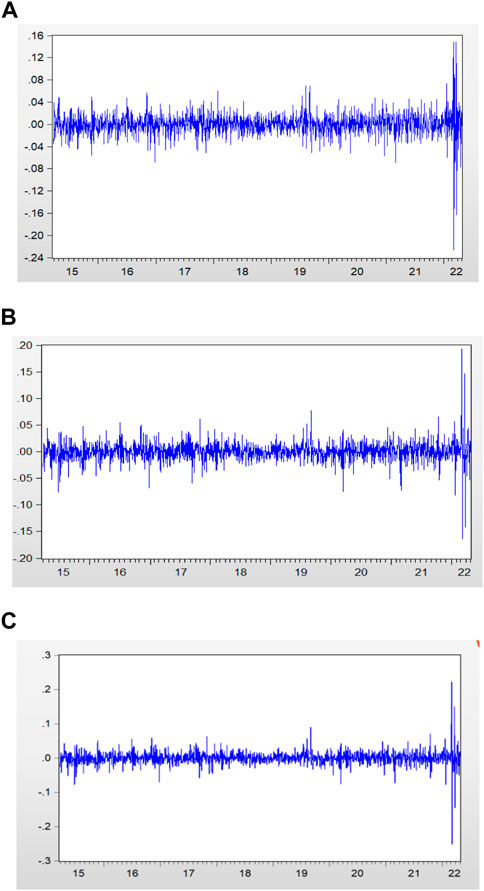
FIGURE 1. Time sequence diagram of yield series (A) LME Nickel, (B) SMM Nickel, (C) The spot price.
Construct GARCH and EGARCH models
First, the stationarity of the return series is examined using the ADF unit root test (Table 2), and the findings indicate that all three series are stationary. The yield series residuals are next examined for autocorrelation; if the null hypothesis is rejected, autocorrelation is assumed to exist in the series. The three sequences’ residual terms were subjected to the ARCH-LM test, which revealed that all of the p-values for the F-statistic and LM statistic were less than 0.05, showing that the sequences showed conditional heteroscedastic properties. Therefore, the standard normal model, the T model, and the GED model with thick-tailed distribution are employed to investigate the aggregation and asymmetries of the return series of the LME price, the SMM price and the spot price. The outcomes of GARCH(1,1)-t and EGARCH(1,1)-t chosen for the return series of the LME Nickel, the SMM Nickel and the spot price, are displayed in Tables 3, 4 based on the AIC criterion.
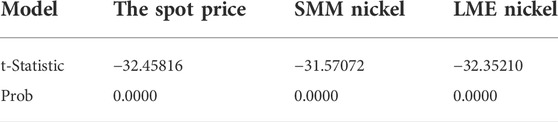
TABLE 2. ADF stationarity test results.
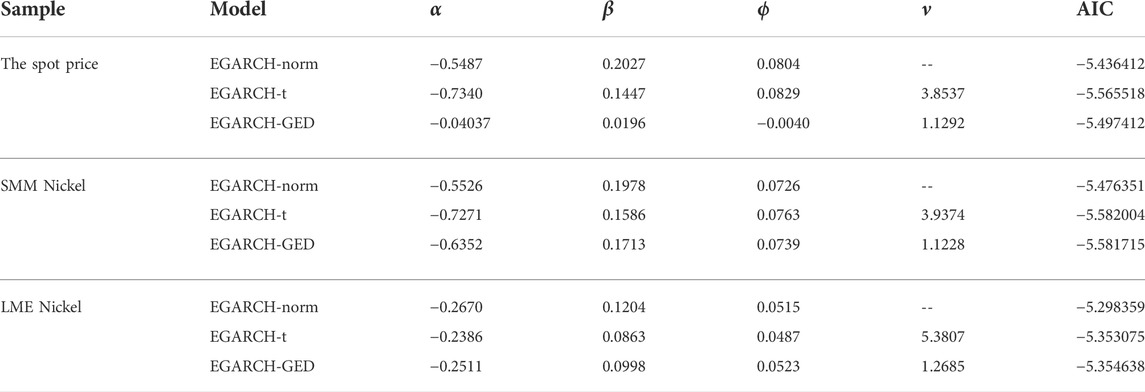
TABLE 3. EGARCH model results.

TABLE 4. Parameter estimation and test results of the marginal distribution model.
GARCH marginal distribution model selection and parameter estimation
According to earlier research, the Copula-GARCH model is frequently used to examine the correlation properties of financial time series, so in this paper, conditional marginal distribution is carried out using the GARCH model. By altering the probability integral of the normalized residual sequence, a new sequence is generated. Finally, as shown in Figure 2, the quantile comparison diagram of the matching T-distribution and the distribution of residual sequence are both drawn. The quantile figure demonstrates intuitively how well the aforementioned model fits the marginal distribution.
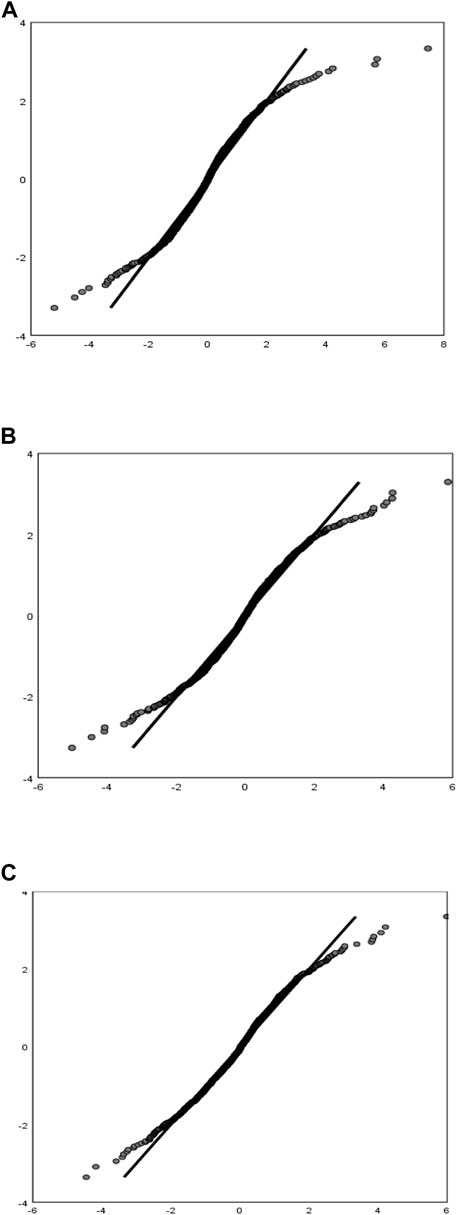
FIGURE 2. Q-Q diagram of the fitting degree of the conditional marginal distribution mode (A) LME Nickel yield series, (B) SMM Nickel yield series, (C) The spot price yield series. Note: The horizontal axis represents the quantile of the normal distribution. The vertical axis represents the quantile of the series of yields after a first-order difference.
Selection of copula function and parameter estimation
Correlation between the london metal exchange nickel futures market and the spot market
After determining the respective marginal distributions, the bivariate frequency histograms (Figure 3) of the joint distribution function (U, V) consisting of the marginal distribution functions of the series of LME Nickel futures and spot price returns were obtained by processing with Matlab software.
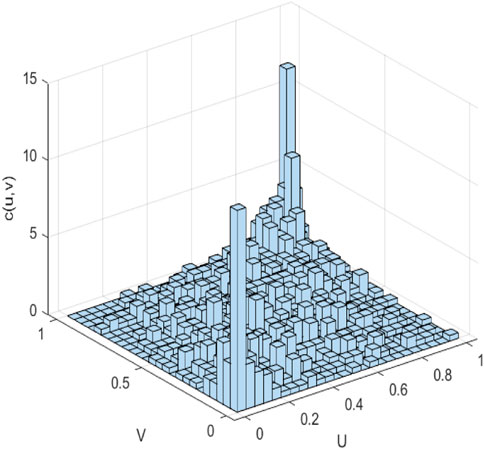
FIGURE 3. Bivariate frequency histogram of daily yield series in LME Nickel and the spot price. Note: The indicator U is the edge distribution of LME Nickel futures. The indicator V is the edge distribution of the spot price. C (U,V) represents a joint distribution fuction.
According to the histogram, it can be shown that the joint density function (U, V) has a significant density in the upper and lower tails. The density of the lower tail is moderately more significant than the density of the upper tail. In contrast, the tails of the two markets are strongly correlated and have a comparatively symmetric tail, demonstrating that the probability of the two markets having a low or high level at the same time is higher, and the joint density function (U, V) also known as the Copula function, has a symmetric tail. According to the image characteristics of the Copula function, it can initially be determined to select the bivariate Gaussian-Copula function and the bivariate t-Copula function that depict the tail symmetry relationship. The density function and distribution function of the bivariate Gaussian-Copula function and the bivariate t-Copula function are displayed in Figure 4.
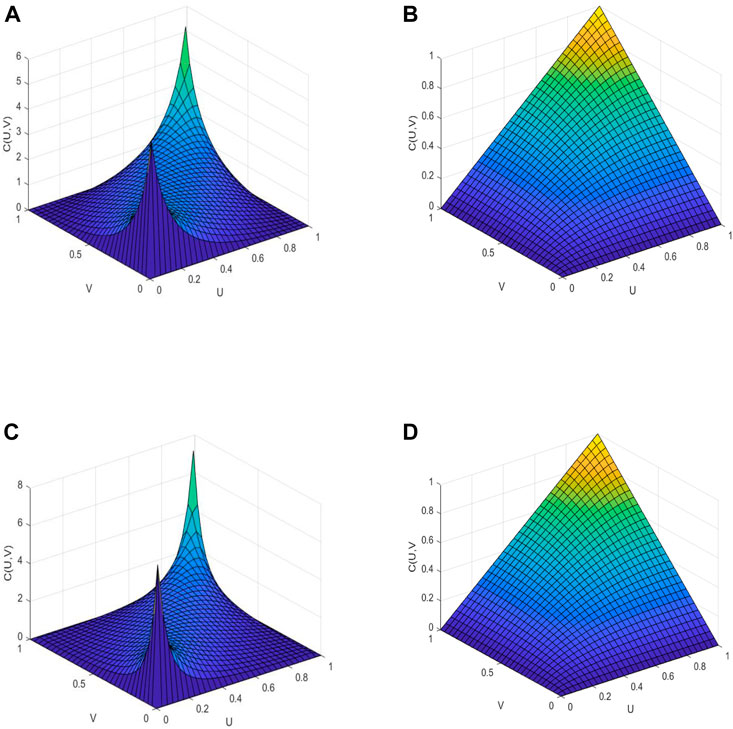
FIGURE 4. Bivariate density function and bivariate distribution fuction of the Gaussian-Copula function and the t-Copula function (A)bivariate Gaussian-Copula density function, (B)Bivariate Gaussian-Copula distribution function, (C)bivariate t-Copula density function, (D)Bivariate t-Copula distribution function.
It can be intuitively seen from the density function plot that the data exhibit noticeable symmetric features, demonstrating that both the bivariate Gaussian-Copula function and the bivariate t-Copula function can better capture the correlation characteristics between the two series. Among them, the bivariate t-Copula function has thicker tails and is more responsive to changes in the tail relationship between variables, and can better capture the tail correlation between the two markets compared with the bivariate Gaussian-Copula function. The distribution function images of both functions reveal conical shapes. Nevertheless, the bivariate t-Copula function selection as the most appropriate Copula function by the image alone still lacks basis, so further accurate analysis with relevant data is necessary.
In order to select the best Copula function to describe the dependency structure of the variables from the two functions, this article uses the AIC information criterion to estimate the function parameters. First of all, the normalized residual sequences obtained by the above conditional edge distribution is transformed by probabilistic integral transformation to two new sequences. Then, use the bivariate Gaussian-Copula function and the bivariate t-Copula function to describe the correlation between new sequences, and the analysis results are displayed in Table 5.
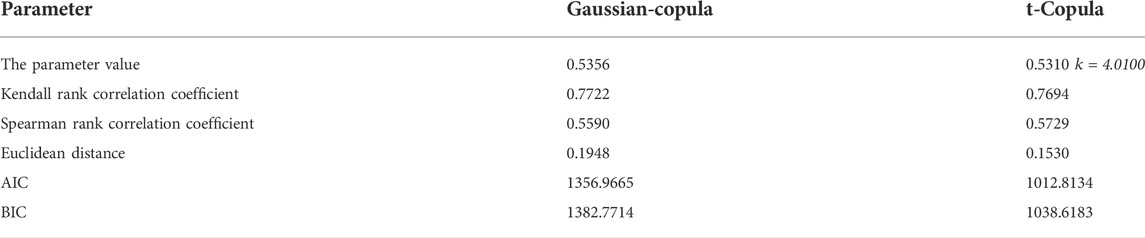
TABLE 5. Estimated values of relevant parameters of the Copula model.
The fitting degree can be directly compared according to the Euclidean distance minimum rule, but in order to more accurately select the Copula function with the best fitting degree, this paper uses the AIC information criterion and BIC information criterion of different Copula functions for comparison. According to the AIC and BIC information criteria, the smaller the value, the better the fitting effect.
As shown in Table 5, the value of the Euclidean distance, AIC and BIC of the Gaussian-Copula function is the largest, which means that the bivariate Gaussian-Copula function fits less than the bivariate t-Copula function. Meanwhile, the Kendall coefficient and the Spearman coefficient of the 0.7694 and 0.5729 respectively, and the coefficients are all positive, indicating that there is a strong nonlinear and positive correlation between the new sequences. It can be seen from Figure 4 that the tail correlation of the two yield series is larger than zero, which indicates that the price surge or sudden drop in the international nickel futures market will have a significant impact on the domestic nickel spot market. Above all, according to the AIC information criterion, the bivariate t-Copula function has a better fitting effect on the correlation between the yield series of the LME Nickel futures price and the spot price.
Correlation between the shanghai nonferrous metals mesh nickel futures market and the spot market
After determining the marginal distribution functions of the yield series of SMM Nickel and spot prices, bivariate frequency histograms (Figure 5) of the joint distribution function (U′, V′) composed of their marginal distribution functions are plotted.
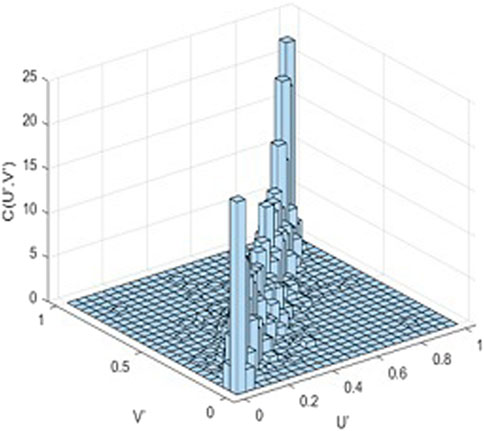
FIGURE 5. Bivariate frequency histogram of daily yield series in SMM Nickel and the spot price. Note: The indicator U′ is the edge distribution of LME Nickel futures. The indicator V′ is the edge dis tribution of the spot price. C (U′, V′) represents a joint distribution fuction.
It can be visualized from the bivariate frequency histogram that the joint distribution function (U′, V′) has a symmetric tail relationship with a more significant density in the upper and lower tails, which means that the probability of both markets having a lower and higher level at the same time is higher. Consequently, the bivariate Gaussian-Copula function and the bivariate t-Copula function can be selected to describe the correlation between the series of futures and spot yields. The normalized residuals of the two series are reconstructed by probability integration to obtain two new series, and then the correlation between the new series is evaluated, and the results are displayed in Table 6.
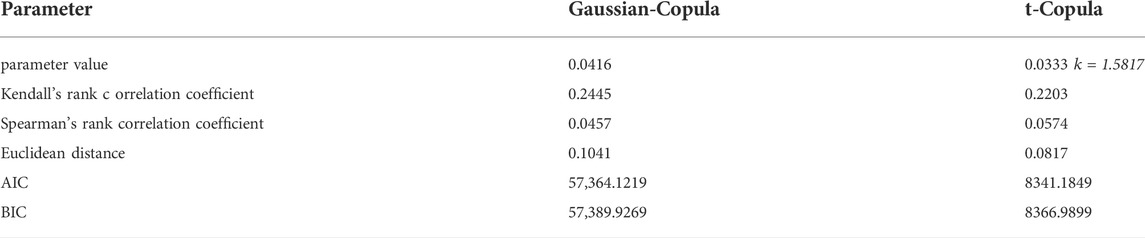
TABLE 6. Estimated values of relevant parameters of the Copula model.
We can intuitively see that the value of the Euclidean distance, AIC and BIC of the bivariate t-Copula function are all less than the relevant parameter values of the bivariate Gaussian-Copula function, indicating that the bivariate t-Copula function has a better fitting effect. At the same time, the value of the Kendall coefficient and the Spearman coefficient is positive, showing that the new sequences have a strong nonlinear and positive correlation. If the price of the domestic nickel futures market rises, the price of the nickel spot market will rise synchronously. The density function and distribution function of the bivariate t-copula function as shown in Figure 6.
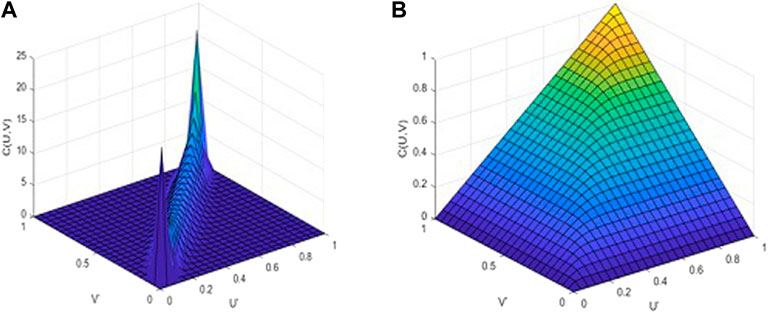
FIGURE 6. Bivariate density function and bivariate distribution fuction of the t-Copula function (A) bivariate t-Copula density function, (B) Bivariate t-Copula distribution function.
The above analysis selects the bivariate t-Copula function to depict the correlation between domestic and foreign nickel futures markets and the spot market. The values of the correlation measures of the bivariate t-Copula function are all positive, and the density function plots of the bivariate t-Copula functions of nickel futures and spot prices all exhibit a symmetrically distributed positive correlation pattern with thick tails and symmetric front-to-back concavity in the middle, demonstrating that the bivariate t-Copula function is sensitive to changes in the tail relationship between random variables and can well capture the tails between the two markets correlation. There is a strong synergistic effect between the two markets, and they display the same increase and decline to some extent. When the price of one index changes sharply, the price of the other will likewise change the same way in a short period of time.
Conclusion and policy implications
Conclusion
Affected by geopolitical conflicts, emergencies and carbon neutrality, the demand and competition for new energy minerals will increase, and China will face a certain degree of price and supply risks. At the beginning of 2020, the COVID-19 epidemic caused the price of mineral products to drop continuously. On 26 March 2020, the SMM Nickel futures price fell to 91,700 yuan per ton, the lowest since 2019, and the spot price fell by 11.21% simultaneously. After the outbreak of the Russian-Ukrainian conflict on 24 February 2022, the nickel futures price soared and broke through the $100,000 per ton on March 10. The price was so high that the LME was forced to suspend nickel trading. As the largest consumer of nickel, the soaring price of international nickel futures inevitably had a serious impact on the domestic market. The SMM nickel prices was affected by the linkage mechanism between internal and external markets, the futures price rose by the daily limit and the premium rate exceeded 100%. The spot price reflected in the short term and continued to rise for 2 days, breaking the new high of 310,000 per ton, with an increase of 46.86%. This event reflects the synergy between the nickel futures market and the spot market, which means that the soaring price of nickel futures will lead to the same rise of the domestic nickel spot price. Nickel futures prices are closely related to the global economic conditions, investors can use the linkage between the futures market and the spot market to hedge, avoid the price risk of the spot market and achieve the expected profit. China should reasonably arrange nickel futures and spot trading according to the needs of domestic economic development, reserve and release nickel ore from the national perspective, and timely adjust nickel supply to push up or stabilize nickel prices.
In this paper, the correlation between domestic and foreign nickel futures and spot markets is researched by constructing the Copula-GARCH model, based on the yield series of daily nickel prices from 1 April 2015, to 29 April 2022, for empirical analysis. Firstly, the GARCH (1,1)-t model is embraced to estimate the marginal distribution of each return series. The Copula function is constructed to depict the correlation between the markets, and lastly, the AIC information criterion is employed as an evaluation index to test the fitting effect of the model and select the most appropriate Copula function. The following conclusions can be drawn.
(1) The yield series of LME nickel, SMM nickel and spot price has an ARCH effect, the characteristics of peak, thick tail, fluctuation aggregation and random walking characteristics. They rise steadily and the fluctuation range gradually increases, reflecting the rapid changes of the capital market and the sustainability of price fluctuations. Market investors can make reasonable investment decisions by predicting the fluctuation trend of the nickel futures prices.
(2) The GARCH(1,1)-t model and the EGARCH(1,1)-t model better explain the fluctuation aggregation characteristics and asymmetric characteristics of nickel price series, and the GARCH(1,1)-t model has a good fit effect on the edge distribution of the series, and the GARCH model and the Copula function can fit well.
(3) The bivariate t-Copula function fits the yield sequence of the international and domestic nickel futures markets and the spot market well, indicating that the futures market and the spot market have a symmetrical tail correlation relationship which is a positive correlation. That is to say, the market has a synergistic effect. Empirical analysis found that the density function of the bivariate t-Copula function has a thicker tail. The thicker the tail, the greater the probability of extreme yields.
Recommendations
To make reasonable decisions, the analysis of the linkage mechanism between domestic and foreign nickel markets plays a vital role in the investors’ systematic analysis and risk analysis. To improve the global discourse power of China’s nickel market and ensure the smooth and orderly operation of the market, the following recommendations are proposed:
First, strengthen and improve the domestic nickel futures market
China’s nickel futures were listed and traded in 2005, and the development of its relevant legal system and transaction mechanism is relatively lagging behind. Due to the strong correlation between the LME and the SMM, the relevant outstanding systems and operating mechanisms of foreign countries can be learned to improve the relevant legal system and trading operation mechanism based on the current situation and characteristics of the Chinese nickel futures market. The first point is to improve the current future regulations and relax the restrictions on overseas futures trading, which is conducive to Chinese trading enterprises to carry out hedging transactions on the international market, and facilitate producers and operators to transfer spot market risks to achieve lock-in costs and achieve expected profits and encourage Chinese capital to enter the international capital market to improve China’s discourse power in international nickel futures pricing. The second point is that domestic exchanges should enrich the types of futures hedging tools to meet the market demand better, The selection of futures hedging tools can learn from those outstanding tools in the LME and those suitable for the China nickel futures market, which can better meet the market demand. In this way, the risk of nickel industry chain-related enterprises can be reduced, the scale of the futures market can be expanded, the trading volume of futures can be increased, and sufficient capital can be obtained to increase the discourse power of Chinese nickel futures in the international market.
Second, actively participate in international competition mechanisms
(1) Actively participate in the formulation of international futures policies. It can be concluded from the above research that LME Nickel futures market is strongly correlated with the SMM Nickel futures market and the spot market. Therefore, the domestic nickel futures and spot market is influenced not only by relevant policies at home but also by relevant policies abroad. Therefore, China should actively participate in the formulation of international futures policy, refer to international futures policy, and timely adjust relevant policies of our futures market which can provide fair competition conditions and a suitable environment for the development of the nickel market and gradually improve the discourse power of nickel pricing in China.
(2) Encourage domestic and foreign enterprises to participate in international competition actively. We should actively encourage enterprises to adopt risk exploration, acquisition of the stake in mines, sign long-term supply contracts, participate in the international market, strengthen foreign exchange and cooperation, implement diversified imports ways, and prevent our nickel market from relying heavily on exporting countries. In this way, we can improve the discourse power of the China’s nickel market and gradually reduce the influence of international nickel market price fluctuation on China’s nickel market prices.
Third, prevent and control the risk of market price fluctuations
(1) Improve the information disclosure mechanism of nickel futures products. Relevant regulatory authorities and exchanges should improve the nickel futures information disclosure mechanism. Futures information disclosure mechanism. Due to the strong correlation between the LME and the SMM, the information disclosed includes relevant information on domestic and foreign nickel futures products. We should improve the efficiency of information acquisition at home and abroad, ensure the truth and accuracy of the information, and improve the nickel futures price warning mechanism. In this way, the relevant information will be made transparent, the negative impact caused by the asymmetry of market information will be reduced, and the trading will be more rational, to improve the anti-risk ability of China’s nickel futures market and make China’s nickel futures market more autonomous and independent.
(2) Strengthen the popularization of professional knowledge of nickel futures traders. The relevant departments of nickel futures shall train the traders of nickel futures, popularize the relevant professional knowledge, attract more traders with professional knowledge to enter the market, promote the relevant traders of the nickel futures market to trade rationally, and give full play to the function of risk avoidance and price discovery of the futures market.
(3) Improve the market risk control system. While improving futures hedging tools and expanding the trading scale, we should also pay attention to risk control and management and establish and improve the risk control system at different levels, and risk prevention and control should include international and domestic risk prevention and control. The futures supervision department should make full use of market information at home and abroad to monitor risks, establish and perfect risk management systems and risk monitoring systems, and let relevant systems play a corresponding role in risk management. The futures exchange should make use of the risk early warning system. According to the information conveyed by international and domestic nickel futures markets, we should take corresponding risk prevention and control measures to prevent and resolve risks in timely manner to avoid excessive transmission of foreign risks to the domestic market.
Data availability statement
The original contributions presented in the study are included in the article/Supplementary Material; further inquiries can be directed to the corresponding author.
Author contributions
SH put forward the main research points; SH, YL, ML, and DQ completed manuscript writing and revision; YL and ML completed simulation research; ML and DQ collected relevant background information; SH, YL, ML, and DQ revised grammar and expression. All authors contributed to manuscript revision, read, and approved the submitted version.
Funding
This work was supported by both the Ministry of Education Humanities and Social Sciences Research Planning Fund Project of China (The study of security risk measurement and benefit evaluation of China’s outward mining investment in the context of “One Belt One Road,” Grant No. 19YJA790027) and Major projects of National Natural Science Foundation of China (Research on supply security and management policy of strategic key mineral resources in the new era, Grant No. 71991482).
Acknowledgments
We would like to thank the reviewers for all comments and suggestions.
Conflict of interest
The authors declare that the research was conducted in the absence of any commercial or financial relationships that could be construed as a potential conflict of interest.
Publisher’s note
All claims expressed in this article are solely those of the authors and do not necessarily represent those of their affiliated organizations, or those of the publisher, the editors and the reviewers. Any product that may be evaluated in this article, or claim that may be made by its manufacturer, is not guaranteed or endorsed by the publisher.
References
Adedeji Abdulkabir, N., Ahmed Funmilola, F., and Adam Shehu, U. (2021). Examining the dynamic effect of COVID-19 pandemic on dwindling oil prices using structural vector autoregressive model. Energy 230, 120813. doi:10.1016/J.ENERGY.2021.120813 |
Aloui, R., Aïssa, M. S. B., and Nguyen, D. K. (2013). Conditional dependence structure between oil prices and exchange rates: A copula-GARCH approach. J. Int. Money Finance 32, 719–738. doi:10.1016/j.jimonfin.2012.06.006 |
Ayse, M. K. (2019). An analysis of dependence between oil price and stock market with Copula-Garch approach: An empirical analysis from Istanbul stock exchange. Therm. Sci. 23 (1), 33–46. doi:10.2298/TSCI180917328M |
Chen, Y. H., and Ma, L. Y. (2021). Risk measurement of internet financial market based on copula-GARCH model. J. Nanjing Univ. Finance Econ. 39 (01), 22–33.
Dong, X., Gao, X., Dong., Z., Liu., S., and Liu, S. (2019). Network evolution analysis of nickel futures and the spot price linkage effect based on a distributed lag model. Int. J. Mod. Phys. B 33 (19), 1950206. doi:10.1142/S0217979219502060 |
Feng, L., and Wu, J. Q. (2016). Research on market risk measures for portfollos composed of stocks based on correlation models. J. Syst. Sci. Math. Sci. (12), 2307–2324. CNKI:SUN: STYS.0.2016-12-015.
Gong, Y., and Chen, Q. (2022). Exchange rate dependence and economic fundamentals: A copula-MIDAS approach. J. Int. Money Finance 123, 102597. (pre-publish). doi:10.1016/J.JIMONFIN.2021.102597 |
Guo, J. F., Zhai, H. C., Hu, Z. Y., and Li, Y. (2017). Research on the effect of margin adjustment of stock index futures on hedging. Commun. Finance Account. 02, 17–20. doi:10.16144/j.cnki.issn1002-8072.2017.02.003 |
He, Y., and Hamori, S. (2019). Conditional dependence between oil prices and exchange rates in BRICS countries: An application of the copula-GARCH model. J. Risk Financ. Manag. 12 (2), 99. doi:10.3390/jrfm12020099 |
Hou, Y. Z., and Lu, J. X. (2019). Correlation between Shanghai and shenzhen stock markets based on copula-GARCH model. J. Xi'an Technol. Univ. 1, 7–11. doi:10.16185/j.jxatu.edu.cn.2019.01.002 |
Jondeau, E., and Rockinger, M. (2006). The Copula-GARCH model of conditional dependencies: An international stock market application. J. Int. Money Finance 25 (5), 827–853. doi:10.1016/j.jimonfin.2006.04.007 |
Just, M., and Łuczak, A. (2020). Assessment of conditional dependence structures in commodity futures markets using copula-GARCH models and fuzzy clustering methods. Sustainability 6, 2571. doi:10.3390/su12062571 |
Kim, J.-M., Kim, S., and Kim, S. T. (2020). On the relationship of cryptocurrency price with US stock and gold price using copula models. Mathematics 8 (11), 1859. doi:10.3390/math8111859 |
Kim, J. M., and Jung, H. (2016). Linear time-varying regression with Copula–DCC–GARCH models for volatility. Econ. Lett. 145, 262–265. doi:10.1016/j.econlet.2016.06.027 |
Klein, T., and Thomas, W. (2016). Oil price volatility forecast with mixture memory GARCH. Energy Econ. 58, 46–58. doi:10.1016/j.eneco.2016.06.004 |
Kouki, M., Massoud, S. B., and Barguellil, A. (2019). On the dynamic dependence between oil prices and stock market returns: A copula-GARCH approach. ijafr. 9 (1), 414–416. doi:10.5296/ijafr.v9i1.14243 |
Liu, J. F., and He, W. X. (2020). Research on the correlation between international crude oil market and Chinese stock industry sectors: Based on copula model. Financial Theory & Pract. 42 (06), 79–85. doi:10.3969/j.issn.1003-4625.2020.06.010 |
Nathani, N., and Kushwah, S. V. (2022). Volatility study in some of the emerging stock markets: A GARCH approach. World Rev. Sci. Technol. Sustain. Dev. 18 (3–4), 3–4. doi:10.1504/WRSTSD.2022.123781 |
Ngo, T. H. (2019). Interdependence of oil prices and exchange rates: Evidence from copula-based GARCH model. AIMS Energy 7 (4), 465–482. doi:10.3934/energy.2019.4.465 |
Philip Ifeakachukwu, N. (2021). Oil price, exchange rate and stock market performance during the COVID-19 pandemic: Implications for TNCs and FDI inflow in Nigeria. Transnatl. Corp. Rev. 13 (1), 125–137. doi:10.1080/19186444.2020.1855957 |
Sharif, A., Aloui, C., and Yarovaya, L. (2020). COVID-19 pandemic, oil prices, stock market, geopolitical risk and policy uncertainty nexus in the US economy: Fresh evidence from the wavelet-based approach. Int. Rev. Financial Analysis 70, 101496. doi:10.1016/j.irfa.2020.101496 |
Shi, Z. Y., Song, W. H., and Wang, C. J. (2021). Correlation analysis of Shanghai and Hong Kong markets based on the copula-GARCH model. J. Math. Pract. Theory 51 (22), 1–9.
Sui, X., and Yan, T. (2018). Research on the correlation measurement between markets of finance and real estate in Chinese mainland and Hong Kong based on the copula-GARCH model. Adv. Soc. Sci. Educ. Humanit. Res. 246, 531–536. doi:10.2991/icpel-18.2018.121 |
Tang, H. S., and Luo, X. X. (2014). An empirical analysis of the interaction between stock index futures and stock market risk. Hunan Soc. Sci. 27 (03), 136–138. doi:10.3969/j.issn.1009-5675.2014.03.035 |
Verma, S. (2021). Forecasting volatility of crude oil futures using a GARCH–RNN hybrid approach. Intell. Syst. Acc. Financ. Manag. 28 (2), 130–142. doi:10.1002/ISAF.1489 |
Wang, X., Cai, J. L., Tang, L., and He, K. J. (2017). VaR measurement of stock portfolio based on BEMD-Copula-GARCH Model. Syst. Eng. Theory Pract. 37 (02), 303–310. doi:10.12011/1000-6788(2017)02-0303-08 |
Wang, X., and Yan, L. (2022). Measuring the integrated risk of China's carbon financial market based on the copula model. Environ. Sci. Pollut. Res. 29, 54108–54121. doi:10.1007/S11356-022-19679-W |
Woraphon, Y., Liu, J., Li, M., Paravee, M., and Dinh Hai, Q. (2022). Analyzing the causality and dependence between exchange rate and real estate prices in boom-and-bust markets: Quantile causality and DCC copula GARCH approaches. Axioms 11 (3), 113. doi:10.3390/AXIOMS11030113 |
Wu, M., and Lu, D. (2019). Volatility spillover effect of international crude oil futures and China-Russia stock market: A multivariate BEKK-GARCH model based on wavelet multiresolution analysis. Asian J. Finance Account. 11 (1), 63–82. doi:10.5296/AJFA.V11I1.14348 |
Yu, M. L. (2019). Comparison of China nonferrous metals FuturesPrice discovery efficiency——based on johansen cointegration test and wavelet coherence analysis. Price:Theory Pract. 38 (06), 98–101. doi:10.19851/j.cnki.cn11-1010/f.2018.06.025 |
Yu, S. (2018). Optimal allocation of household financial assets under the internet background: An empirical study based on copula-GARCH model. Financ. Econ. 37 (24), 86–88. doi:10.14057/j.cnki.cn43-1156/f.2018.24.038 |
Yu, X., Zhang, W. G., and Liu, Y. J. (2019). Hedging model with cross-currency options based on Copula-GARCH method. J. Syst. Eng. 05, 656–671. doi:10.13383/j.cnki.jse.2019.05.008 |
Zhang, W., and Shigeyuki, H. (2021). Crude oil market and stock markets during the COVID-19 pandemic: Evidence from the US, Japan, and Germany. Int. Rev. Financial Analysis 74, 101702. doi:10.1016/J.IRFA.2021.101702 |
Zhu, H. M., Dong, D., and Guo, P. (2016). Research on the Correlation between International Crude oil price and stock market Returns based on Copula function. Theory Pract. Finance Econ. 37 (02), 32–37. doi:10.16339/j.cnki.hdxbcjb.2016.02.006 |
Zhu, P., Tang, Y., Yu, W., and Lu, T. (2021). Multidimensional risk spillovers among crude oil, the US and Chinese stock markets: Evidence during the COVID-19 epidemic. Energy 231 (7), 120949. doi:10.1016/J.ENERGY.2021.120949 |
Keywords: Copula-GARCH model, price volatility correlation, LME nickel futures market, SMM nickel futures market, nickel spot market
Citation: Hong S, Luo Y, Li M and Qin D (2022) Volatility research of nickel futures and spot prices based on copula-GARCH model. Front. Energy Res. 10:1011750. doi: 10.3389/fenrg.2022.1011750
Received: 04 August 2022; Accepted: 26 August 2022;
Published: 16 September 2022.
Edited by:
Xiangyun Gao, China University of Geosciences, ChinaReviewed by:
Jong-Min Kim, University of Minnesota Morris, United StatesYingwei Han, China University of Geosciences, China
Xiaojuan Dong, Hebei GEO University, China
Copyright © 2022 Hong, Luo, Li and Qin. This is an open-access article distributed under the terms of the Creative Commons Attribution License (CC BY). The use, distribution or reproduction in other forums is permitted, provided the original author(s) and the copyright owner(s) are credited and that the original publication in this journal is cited, in accordance with accepted academic practice. No use, distribution or reproduction is permitted which does not comply with these terms.
*Correspondence: Yimin Luo, MjQ1OTQ0ODk4NUBxcS5jb20=