 Soumya Ghosh1
 Mrinmoy Majumder
 Omar Hazem Mohammed
 Mohit Bajaj
 Arvind R. Singh
 Salah Kamel
94% of researchers rate our articles as excellent or good
Learn more about the work of our research integrity team to safeguard the quality of each article we publish.
Find out more
ORIGINAL RESEARCH article
Front. Energy Res. , 24 October 2022
Sec. Process and Energy Systems Engineering
Volume 10 - 2022 | https://doi.org/10.3389/fenrg.2022.1009987
The failure probability of the wave energy converters is exceptionally high, which again increases the operation cost of the entities. The cause of this high cost lies in the fact that various factors influence the production efficiency of the converters. To solve this problem, multiple converters are utilized in series and parallel formation to produce energy simultaneously. This multiple converter system, known as wave energy farms, also fails to increase efficiency and decrease the cost of operation sufficiently. The reason for this is that not only technical but socio-economic as well as different environmental factors have a significant role in this aspect, which remains undetected or under- or over-detected while calculating the potential wave energy. The present investigation tries to classify the different factors which are most influential in controlling the transfer efficiency of wave energy farms to solve the problem of erroneously detecting significant factors. The authors offer a new indicator for estimating the failure likelihood of wave energy farms in converting ocean wave energy into electricity by combining Multi-Criteria Decision Making and Polynomial Neural Networks with information collected from an unbiased ranking technique.
With the current population and economic growth, it is predicted that in the near future, demand for energy will increase considerably by 17 TW (Rotty, 1979). Global climate change, as well as the warnings linked with it, constitute a serious threat to the world’s ecosystems. The possibility of reversing this trend relies on lowering CO2 emissions into the environment. By investing in renewable energies such as wind and solar electricity, international treaties are playing a critical role. However, there is another renewable energy cluster with great potential and a bright future. This is the energy created by waves, which is quickly gaining traction as a viable alternative to reducing the environmental impact of fossil fuel use (Abanades et al., 2014). Wave energy has a number of advantages, including, but not limited to, large energy capacity One of the most concentrated, reliable, and long-lasting energy sources, wave energy is available in many nations but is underutilized (Mackay et al., 2010).
As a result, the utilization of wave renewable energy offers enormous potential for lowering greenhouse gas emissions. More wave energy providers are showcasing their products to draw investors in a competitive manner as a result of the growing marine renewable sector. Information about WEC is frequently confidential. Developers want to place a device in the best possible way, but investors just want to make money. The rivalry also causes WECs on the market to have very dynamic properties. Therefore, research is necessary to improve evaluations of novel WECs and offer recommendations for matching WECs and locales (Choupin et al., 2021). Because the wave energy converter (WEC) produces no gaseous, liquid, or solid emissions, wave power is less environmentally damaging than most other forms of energy generation (Brooke, 2003). Wave farms vary depending on the device type, condition of the ocean, farm size, proximity to shore and grid connection, and device and plant cost estimation of the farm layout.
Wave farms (Guanche et al., 2014) are arrays of wave energy converters that are arranged in either series or parallel connections to cumulatively convert the available potential of wave energy resources. The efficiency of conversion mainly depends on the performance efficiency of the converters (Bódai and Srinil, 2015), the transmission loss incurred in the connecting cables (Sharkey et al., 2013), the park effect (Katsaprakakis and Christakis, 2014; Gatzert and Kosub, 2016), and some other factors which depend on location, such as wind speed, duration of fetch (Carrasco et al., 2012), water quality (Ghosh et al., 2016), tourism potential (Greaves et al., 2016), etc. Due to various crucial characteristics, such as gap resonance, array arrangement, wave nonlinearity, 3-D flow field effect, power take-off (PTO) mechanism, and oblique wave incidence, the hydrodynamic behavior of multi oscillating wave surge converter devices is still not fully known (Cheng et al., 2021).
It is particularly difficult to determine how nonlinear multi-body hydrodynamic interaction would affect the harvested energy of OWSC devices. It is necessary to do systematic research into the additional nonlinear hydrodynamic performance of an array of OWSCs.
The goal of this research is to determine the best arrangement for wave energy farms so that the most quantity of utilizable energy can be transformed. The study’s unique contribution is the creation of an indicator that may objectively describe the performance efficiency of wave farms in terms of location, design, and cost. The creation of an instinctual indication was accomplished, and it was used to solve a problem for the first time.
The present study includes the application of the Multi-criteria decision making (MCDM) and ANN-based GMDH methods. The latter method was used to incorporate adaptability, and MCDM was used to find the priority of the input parameter with respect to the study objective. Sections 2.1, 2.2 depict the strengths, weaknesses, and application of the MCDM and GMDH methods in the related fields.
The MCDM is used to make objective decisions and determine the significance of selected characteristics for the study’s specific goal. In this study, MCDMs such as Fuzzy-AHP (Shaw et al., 2012) and ANP (Aragonés-Beltrán et al., 2014) were used to determine the importance of selected characteristics in relation to the investigation’s goal.
The computation approach developed by Saaty (Saaty, 1980) for the analytical hierarchy process was based on crisp judgment. On the basis of fuzzy set theory and hierarchical structure analysis, many fuzzy AHP approaches have been devised. In the application process, Saaty proposed the significance scale, which uses numbers from 1 to 9 while the decision-maker performs paired comparisons. Most real-life decisions, on the other hand, have unknown outcomes (Chang, 1996).
The weights for evaluative elements are determined using fuzzy AHP, which is based on fuzzy interval arithmetic using fuzzy triangular numbers and confidence indexes, and an interval means method (Buckley, 1985; HMd and Wu, 2011). To enhance decision-making, some academics have combined fuzzy theory with AHP.
Analytical network process (ANP) is a flexible decision-making strategy that works with both quantitative and qualitative data and qualitative data. Saaty introduced ANP as a novel MCDM technique to solve the real-world concerns of interaction and feedback among criteria and options (Saaty, 2004). ANP is a nonlinear dynamic structure that is based on the Markov Chain notion and is an extension of AHP (Saaty, 1999). We discovered that while dealing with ANP, the standard way of normalizing the non-weighted super matrix was not appropriate since, in the actual world, varying degrees of impact exist within clusters of factors/criteria. As a result, the weighted super matrix’s weighted assumption of equal weights for each cluster is impractical and has to be modified (Luo et al., 2010). Three matrix analyses are included in the ANP method: the super matrix, the weighted super matrix, and the limit matrix (Yang et al., 2003). Table 1 depicts the advantages, disadvantages, and application of the ANP method.
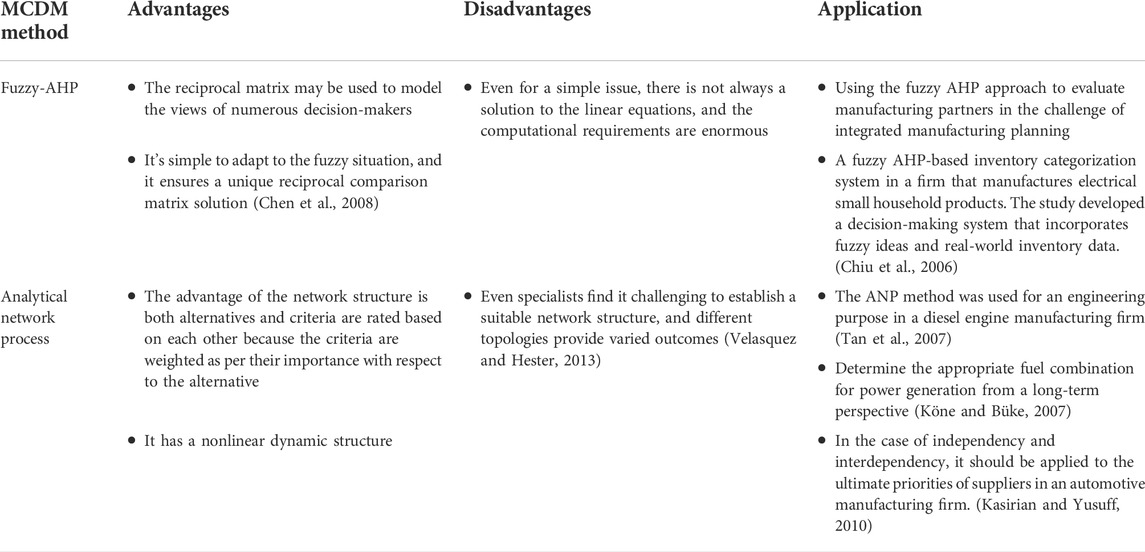
TABLE 1. Table showing advantages, disadvantages, and application of Fuzzy-AHP method.
Duncan was the first to suggest an economical design for X control charts (Duncan, 1956). By adding statistical restrictions into the economic model, Saniga was the first to propose the economic-statistical design of X bar and R charts (Saniga, 1989). Multiple objectives, including cost function and statistical features, are maximized simultaneously in their method. As a result, the best control chart design is modeled as a Multi-criteria decision making (MCDM) issue (Allen, 2006) (Table 2).
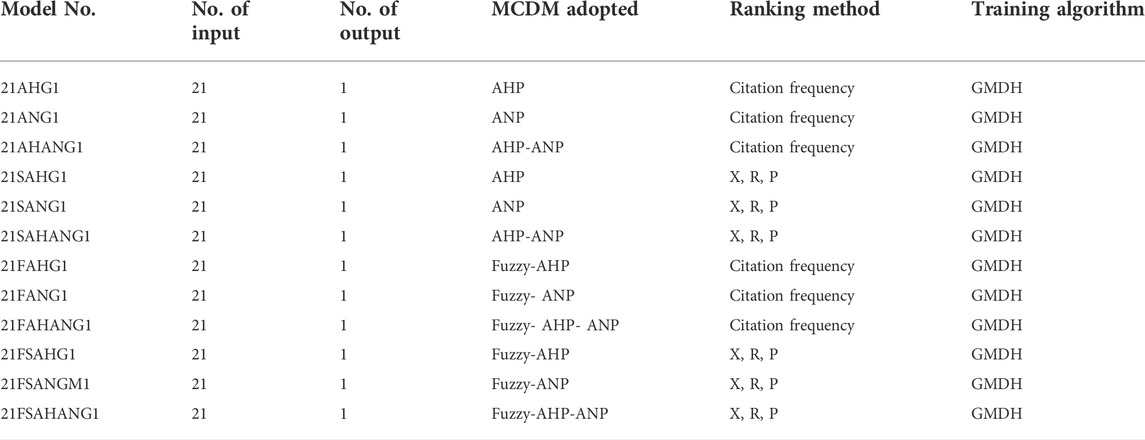
TABLE 2. Table showing the features of the twelve development models.
The present investigation also uses some statistical control charts to find the rank of the selected factors in an unbiased and non-preferential way.
The control charts are used to detect system performance outliers. The charts are used in this study to determine the relevance of the index’s optimal performance and the associated features of the input parameters without outliers. The separation of the factors in terms of their contribution to optimizing the index performance. The X-bar, R, and P control charts were used separately to rank the variables as per their contribution to the study objective.
Ivakhnenko (Ivakhnenko, 1971) created the Group method data handling algorithms (GMDH) model, which is one of the learning machine models based on the polynomial theory of complex systems. The most important input parameters, the number of layers, the number of neurons in the middle layers, and the network’s ideal topology design are all automatically defined by this network. As a result, the GMDH network is a model of active neurons that self-organize. During the training step, the GMDH network’s topology is set using a polynomial model that yields the least amount of error between the predicted value and the observed output.
The neuro-fuzzy GMDH network is a highly versatile algorithm that may be integrated with other iterative and evolutionary algorithms with ease (Nariman-Zadeh et al., 2002). The GMDH neural network is a self-organizing, unidirectional structure with many layers made up of neurons with comparable structures.
After selecting the model criterion in line with the modeling and information division’s aims, GMDH will automatically confirm the model. If several types of input units are used, this modeling approach will generate multiple types of models. This automated modeling method has been used to create Bayesian networks (Xiao et al., 2009) and Mamdani-type fuzzy models (Lemke and Müller, 2003).
The noise-immunity of GMDH is another attractive feature. We all know that when data contains noise, the greatest danger is over-fitting (Tan et al., 2006), which means that models become too complicated and generalizable. This issue, however, may be overcome in the case of GMDH.
Following an examination of the literature, the twenty-one most critical factors for the efficiency of a wave energy converter farm design were chosen. These factors are wave height, shipping density, wave period, water depth, distance from the coast, wind speed, salinity, regularity of wave, number of WEC, the distance between WEC, wave incidence direction, array layout, length of cable connecting to shore, buoy diameter, rated power, converter efficiency, unit cost, operating and maintenance costs, capital costs, taxes and rate of energy charge per unit.
The current research took two steps to create an indicator for representing farm performance in terms of the installation site, converter design, and system cost.
The control charts X bar, R, and P were used in the first phase based on their significance to the study goals. The Fuzzy-AHP and ANP MCDM techniques were then used to determine the priority value of each of the parameters. The MCDM technique is divided into three parts, which will be detailed in the next section.
The application of MCDM involves three steps, which are described in the next section.
The criteria were selected based on the study objective. In the present study, the location (L), Design (D), and Cost (C) were selected as the criteria on which the parameters will be compared.
All the selected parameters were considered as alternatives to the decision-making method. Based on the rank obtained using the control chart method, each of the possibilities is compared to one another.
After comparing each of the alternatives against each other based on the criteria and with respect to the study aim, the criteria and alternatives were utilized to identify the equal weight of the given parameters.
The criteria were then compared to one another based on the available possibilities, all while keeping the study’s purpose in mind. To evaluate the weight of importance for each of the elements, both findings were cross multiplied based on the criteria and in relation to the study’s purpose.
The weight vector or priority values of the parameters were used to convey the relevance of the parameters at the end of this strategy, which is directly proportional to the significance of the variables.
Weight Function as the Indicator: The W-value, or Indicator for Performance Evaluation of Wave Energy Converter Array Design, was calculated by Eq. 1
where “wn” and bn denote the degree of the weight of importance, beneficiary and non-beneficiary variables, respectively, and n and m indicate the number of the beneficiary and non-beneficiary variables.
With twenty-one inputs and one output, the GMDH model was created. The models’ datasets were standardized, and 60 percent of the data was utilized for training, while the remaining 40 percent was preserved for testing. A total of twelve models were created using a variety of control charts, MCDMs, and data transformations. Table 1 demonstrates how the models were created in different methods to anticipate the same goals.
Mean Absolute Error (MAE) (Willmott and Matsuura, 2005), Root Mean Square Error (RMSE) (Despotovic et al., 2016), Mean Relative Error (MRE) (Gray et al., 2016), and Correlation(R) (Pascual-González et al., 2016) were used to evaluate the performance of all forty-eight models.
Model accuracy is known to be inversely proportional to the former measures, but model performance is known to be directly proportional to the latter measurements. The model’s performance during the checking (c) or testing phase is a better predictor of model dependability than the model’s performance during the training (t) phase (Noori and Kalin, 2016).
According to the EI, three models were chosen for additional validation after they were shown to be superior to the forty-eight models produced for this investigation.
Root Mean Square Error (RMSE), Mean Relative Error (MRE), and Percent bias (PBIAS) (Gupta et al., 1999) between predicted and observed data were used to assess the dependability of the selected three models. The Performance Index (PI) was created to represent the models’ performance. Equ.2.
where t is for testing and T is for the training phase.
Table 1 shows the nomenclature, which starts with the number of inputs, then the first letter of the training process, the data transformation function, and finally, the model number.
The most efficient model’s sensitivity will always be proportional to the importance of the parameters in the model output. For a model to be trustworthy and efficient in predicting its output with dependability, the sensitivity and significance must be consistent and associated. The model was subjected to a sensitivity analysis, and it was discovered to have the highest EI of all the models produced for this study.
In Figure 1 represents the geographical locations of five points (location 1 to location 5), which are used to define the wave energy converter efficiency analysis.
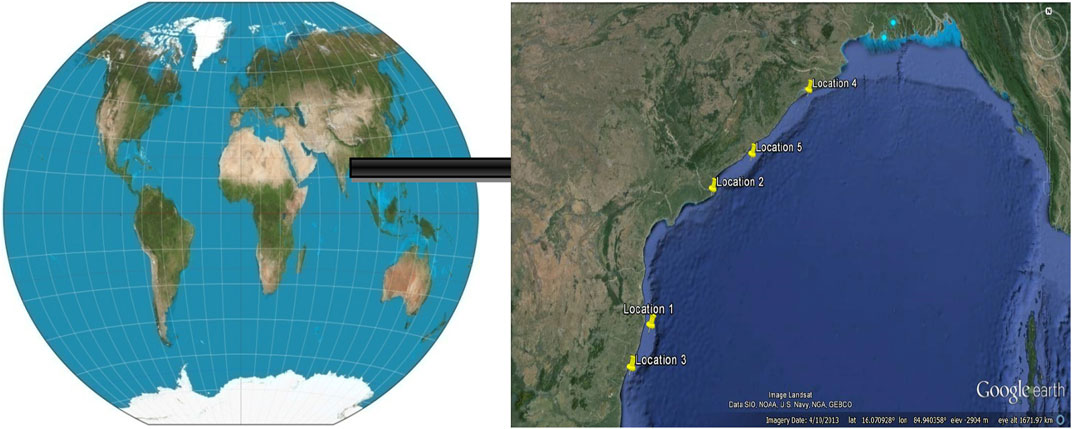
FIGURE 1. Locations of the study area (Noori and Kalin, 2016)
Several industries are currently developing and implementing novel technologies in wave energy generation across the world. AquaEnergy Group, Ltd. (AquaEnergy), an ocean wave corporation, describes its categorization growth and optimization efforts in this study. Ocean energies have witnessed a resurgence in attention in recent years, owing to a growing recognition that we will need all types of clean energy to lessen our reliance on fossil fuels.
The weight vector of the parameters was calculated to analyze the X bar, R, P control chart, and citation frequency; the citation frequency refers to the number of citations divided by the number of the literature surveyed, as defined in Table 3. The twelve models were specified as AHP, ANP, AHP-ANP, Statistical method with AHP, Statistical method with ANP, Statistical method with AHP-ANP, Fuzzy AHP, Fuzzy ANP, Fuzzy –AHP, Fuzzy-ANP, Fuzzy-AHP-ANP, Statistical method with Fuzzy-AHP, Statistical method with Fuzzy-ANP and Statistical method with Fuzzy-AHP-ANP in Table 4. The performance of the twelve models in the prediction of wave energy farm performance is depicted in Table 5. Figures 2, 3 depict the comparison of predicted and observed output during the training and testing or predictive phase and the distribution of residuals derived from the predicted and observed output, respectively.
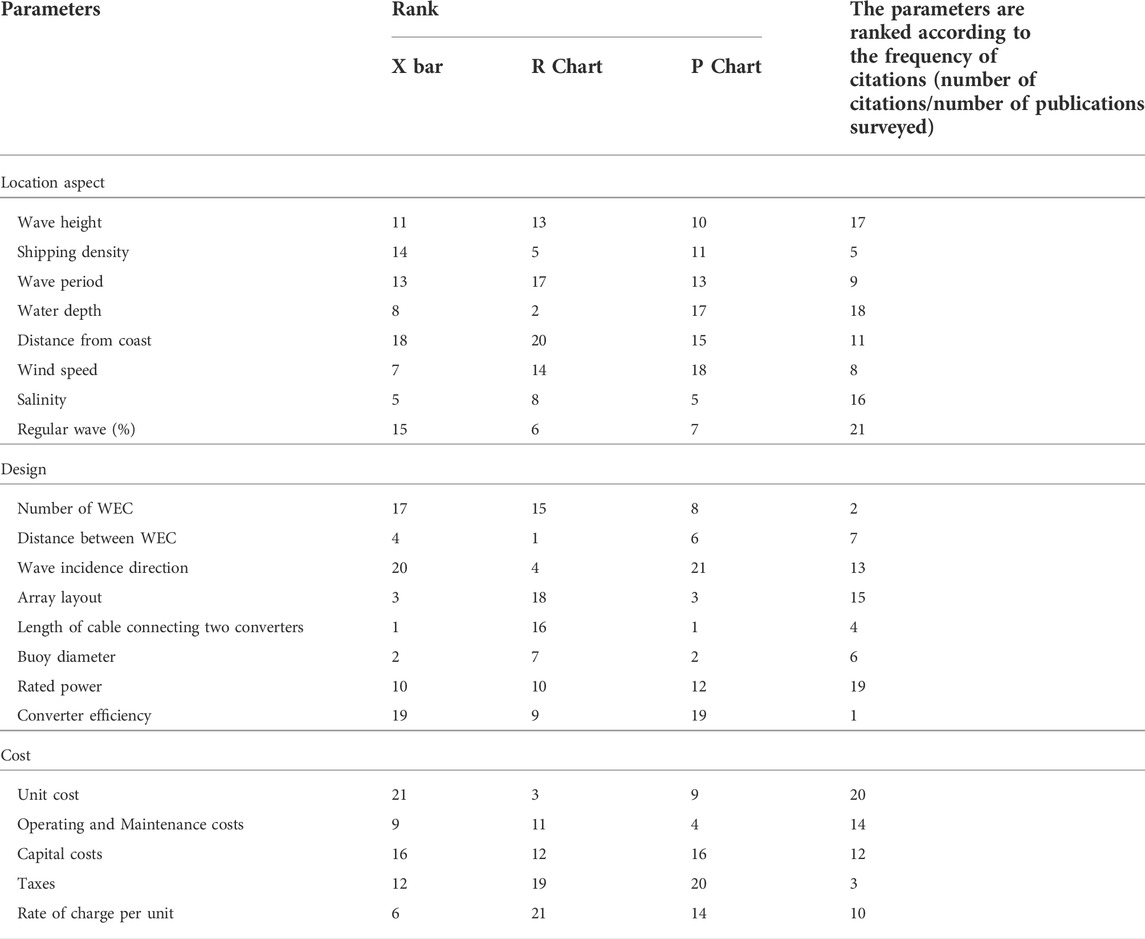
TABLE 3. Table showing the rank of the parameter of X bar, R, and P control chart.
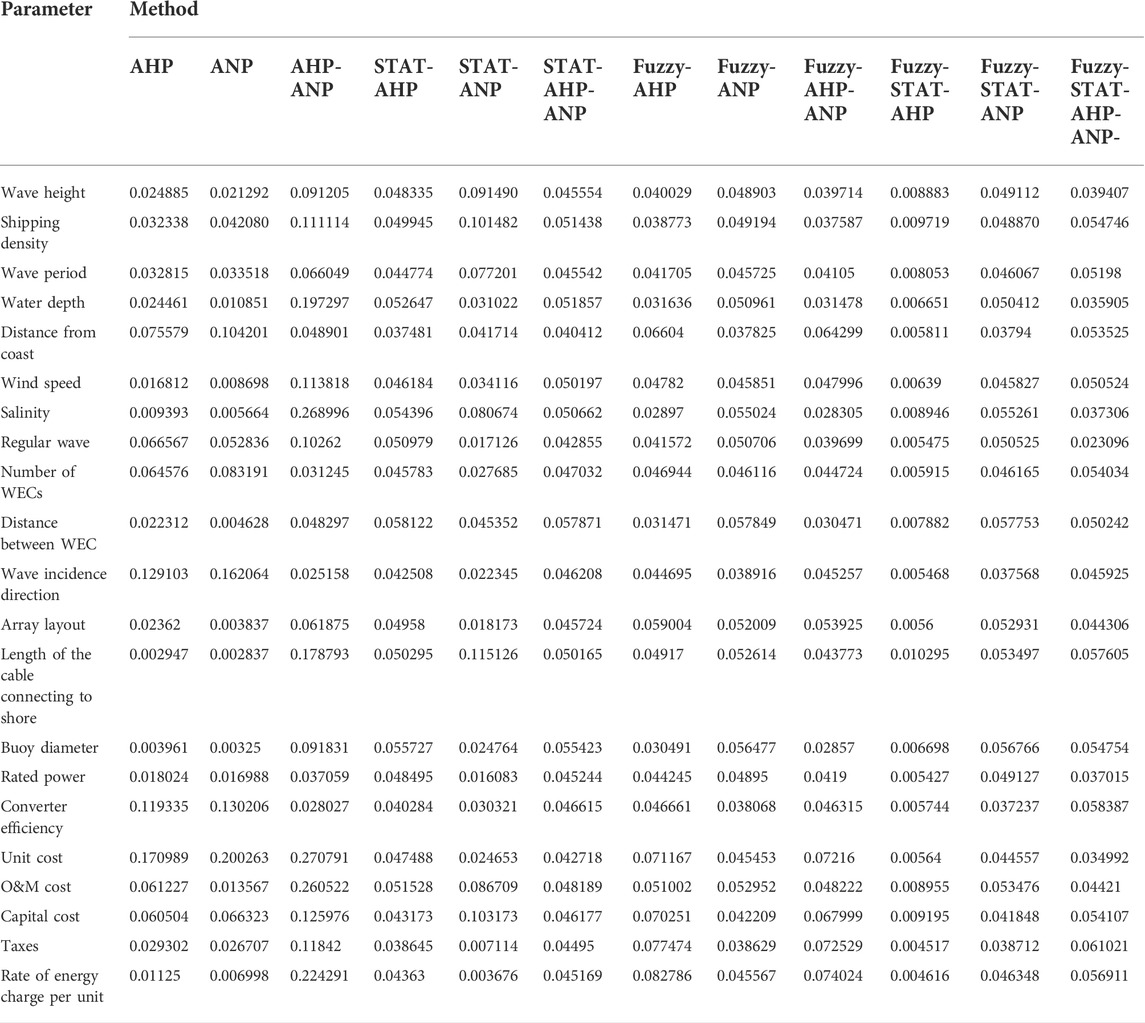
TABLE 4. Table showing the parameters as determined by various MCDM methods.
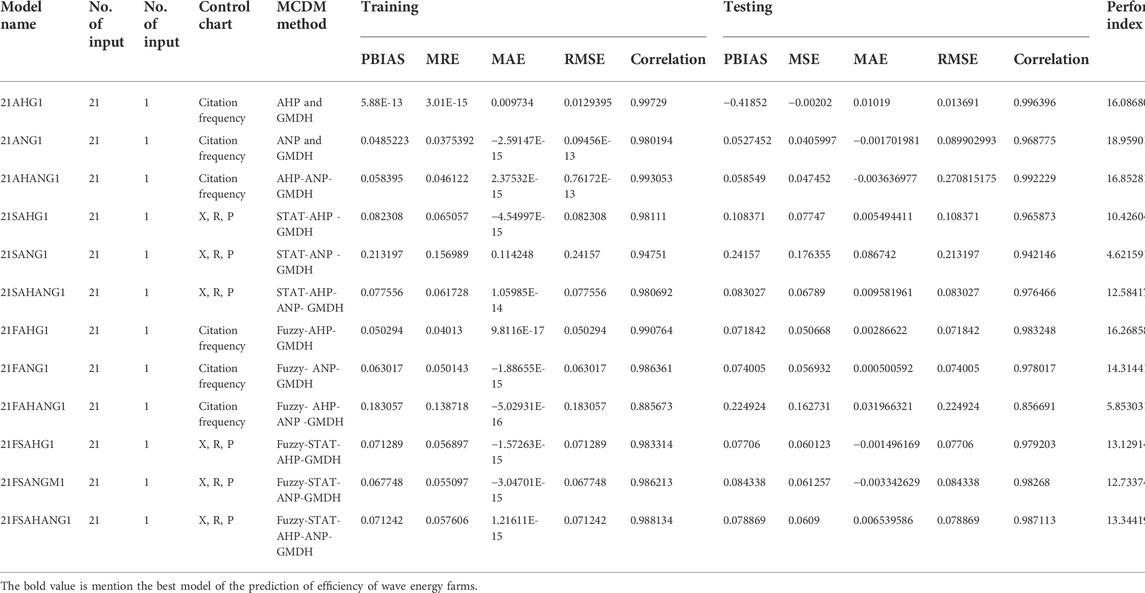
TABLE 5. Table results of the 12 models developed for prediction of efficiency of wave energy farms.
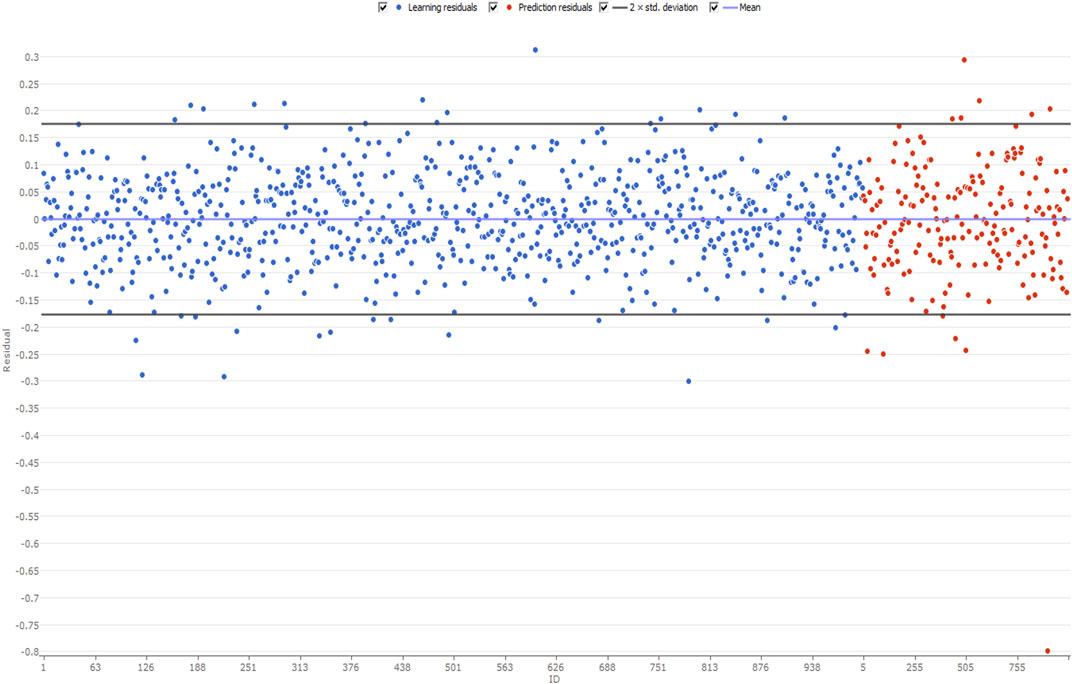
FIGURE 2. Figure showing the distribution of residual value for the model #21ANG1.
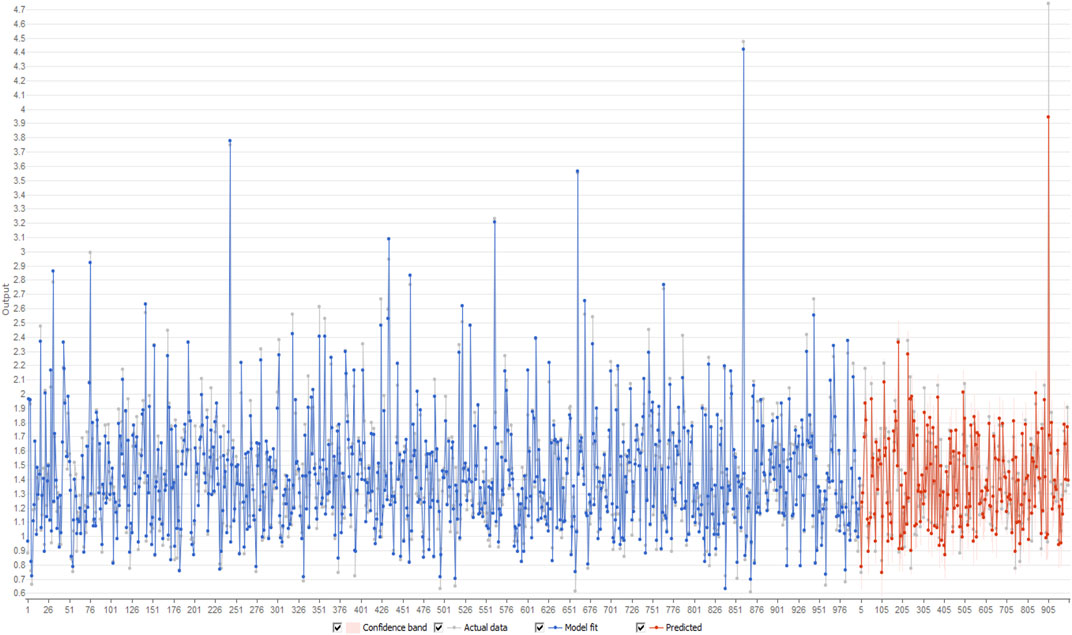
FIGURE 3. Figure showing the distribution of residuals derived from observed and predicted output for #21ANG1.
According to the results of the fuzzy-AHP and ANP strategies, the potency of the wave energy farm was found to be the highest three most vital factors among the twenty-one thought-about parameters.
The study’s performance analysis found that Model No. 21ANG1 was the most dependable of all the models studied, followed by Model No. 21FAHG1. Both of the essential models were GMDH-trained, utilized non-linear neuron function, and modified the output. Models three and seven, which were discovered to be the study’s second and third most important models, incorporated variable ranking as well as output transformation, and the model was trained with GMDH. All the models that employed all twenty-one input variables were included in the analysis.
The model 21ANG1 was found to be better than the other models in Table 5. According to the results, one model was selected for prediction as performance will depend on the method of variable ranking and may change if the method is changed in Table 5. If the MCDM approach is altered, the performance accuracy of the chosen model may change as well. Thus it was assumed that if the method of MCDM remains unchanged, the accuracy of the model will be uniform in any system as the model was trained with a normalized data set that is independent of scale problems.
Chennai has the highest probability of failure among the sites, according to the conclusions of the case study research. In addition, criterion and alternative selection has a significant impact on the model findings in Table 6.
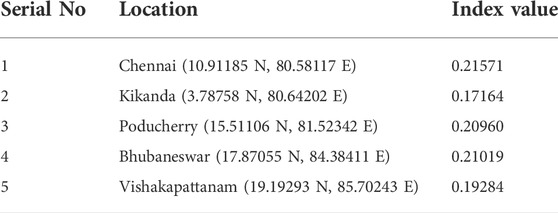
TABLE 6. Table showing the performance analysis of five locations.
The importance of the variables was considered based on normal conditions; it depicts no information regarding the process to optimal performance efficiency of the converter. However, the importance variable by estimated MCDM depends on the information retrieved from the literature survey of a certain number of reports.
Figure 3 shows the comparison of predicted and output data, as estimated by the selected model. The distribution of residual value is depicted in Figure 2.
Using twenty-one input and one output parameter, the wave energy farm designs of five sites were estimated. The network was trained using the GMDH technique and Supplementary Equation S54 in Supplementary Annexure S1 shows the number of hidden layers and the value of the weight vector for each input.
where
The objective equation of model was developed by
In the current analysis, it was discovered that the GMDH trained model had acceptable performance metrics. To establish a relationship between the dependent and independent variables, a multiple linear regression was run on the dataset. The PI test for the MLRM model is not as significant as 0.122945. Correlation was calculated to be 0.992075, indicating that the developed model suited the dataset well. The MLRM model performed better at predicting in Table 7 than the regression model, which was determined by the MSE, which was obtained for both cases and was 0.03498 for the regression model and 0.0367 for the GHDH model. To validate the model, the created GHDH and regression model were both given the test dataset. The regression model was created utilizing the entire dataset, which included the test data points, but the MLRM model was never exposed to the test dataset during training. The GMDH method required to include data points that were near to the minimum and maximum values of the dependent variable when creating the test dataset.
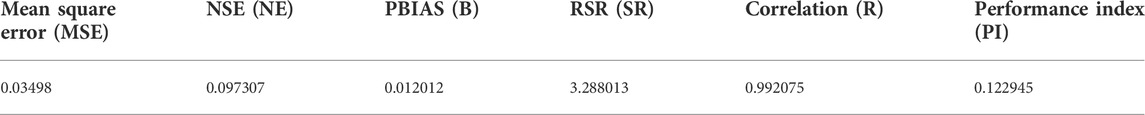
TABLE 7. Performance index of multiple linear regression model.
Each number in the sensitivity analysis represents the difference between the expected result and the level of uncertainty associated with a single input variable. It was observed that with a change in each of the input variables (i.e., wave height, shipping density, wave period, water depth, distance from the coast, wind speed, salinity, regular wave, number of WECs, the distance between WECs, wave incidence direction, array layout, length of cable connecting to shore, buoy diameter, rated power, converter efficiency, unit cost, operating and maintenance costs, capital costs, taxes and rate of energy charge per unit) there is a change in output, which depicts the sensitivity of the model with respect to each of its inputs in Figure 4. The most sensitive parameter was wave period, and the least sensitive was array layout.
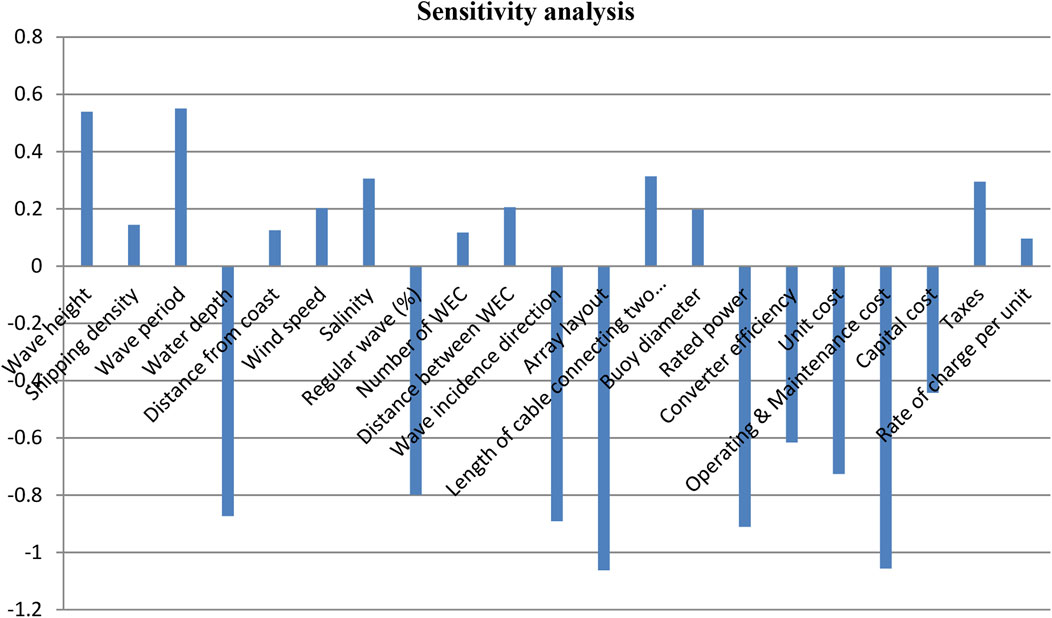
FIGURE 4. Figure depicting the input variable’s sensitivity analysis.
The goal of this research is to evaluate the likelihood of wave energy farms failing. In this case, 12 alternative models were created using MCDM approaches and polynomial neural networks. Each model’s performance was estimated using performance indicators such as RMSE, MAE, r, and PBIAS. The model with the best performance efficiency was used to forecast the chance of failure. The selected model was also utilized to determine the likelihood of failure in five areas along the Indian coastal strip. The length of the cable connecting the converter (as determined by the X and P chart methods), the distance between WEC (as determined by the R Chart method), and converter efficiency (as determined by the citation frequency) were found to be the most important parameters in terms of failure probability.
Among the 12 models, the 21ANG1 developed model was found to have the highest performance efficiency (18.959). According to the sensitivity analysis results, the sensitivity and weight of importance of the variables are in exact coherence. The case study results show that the Chennai region has the highest failure probability compared to the other four regions, whereas the Kikanada coastal belt has the lowest chance of failure. This means that farms installed in the Kikanada region have the potential for higher conversion efficiency than in the Chennai region. Although the model has some drawbacks, such as if the method of ranking or decision making is changed, then the importance of the parameter may also change, and this will also impact the results. Again, the selected factors may also change if more resources are analyzed. Such drawbacks can be compensated for if specific policies are initiated so that uniformity among all the feasibility methods can be maintained.
The datasets presented in this study can be found in online repositories. The names of the repository/repositories and accession number(s) can be found in the article/Supplementary Material.
All authors listed have made a substantial, direct, and intellectual contribution to the work and approved it for publication.
The authors thank the support of the National Research and Development Agency of Chile (ANID), ANID/Fondap/15110019.
The authors declare that the research was conducted in the absence of any commercial or financial relationships that could be construed as a potential conflict of interest.
All claims expressed in this article are solely those of the authors and do not necessarily represent those of their affiliated organizations, or those of the publisher, the editors and the reviewers. Any product that may be evaluated in this article, or claim that may be made by its manufacturer, is not guaranteed or endorsed by the publisher.
The Supplementary Material for this article can be found online at: https://www.frontiersin.org/articles/10.3389/fenrg.2022.1009987/full#supplementary-material
Abanades, J., Greaves, D., and Iglesias, G. (2014). Wave farm impact on the beach profile: A case study. Coast. Eng. 86, 36–44. doi:10.1016/j.coastaleng.2014.01.008
Allen, T. T. (2006). Introduction to engineering statistics and six sigma: Statistical quality control and design of experiments and systems. Springer Science & Business Media.
Aragonés-Beltrán, P., Chaparro-Gonzalez, F., Pastor-Ferrando, J. P., and Pla-Rubio, A. (2014). An AHP (Analytic Hierarchy Process)/ANP (Analytic Network Process)-based multi-criteria decision approach for the selection of solar-thermal power plant investment projects. Energy 66, 222–238. doi:10.1016/j.energy.2013.12.016
Bódai, T., and Srinil, N. (2015). Performance analysis and optimization of a box-hull wave energy converter concept. Renew. Energy 81, 551–565. doi:10.1016/j.renene.2015.03.040
Buckley, J. J. (1985). Fuzzy hierarchical analysis. Fuzzy sets Syst. 17 (3), 233–247. doi:10.1016/0165-0114(85)90090-9
Carrasco, A., Ferreira, O., Matias, A., and Freire, P. (2012). Flood hazard assessment and management of fetch-limited coastal environments. Ocean Coast. Manag. 65, 15–25. doi:10.1016/j.ocecoaman.2012.04.016
Chang, D.-Y. (1996). Applications of the extent analysis method on fuzzy AHP. Eur. J. operational Res. 95 (3), 649–655. doi:10.1016/0377-2217(95)00300-2
Chen, M.-F., Tzeng, G.-H., and Ding, C. G. (2008). Combining fuzzy AHP with MDS in identifying the preference similarity of alternatives. Appl. Soft Comput. 8 (1), 110–117. doi:10.1016/j.asoc.2006.11.007
Cheng, Y., Chen, X., Dai, S., Ji, C., and Cocard, M. (2021). Wave energy extraction for an array of dual-oscillating wave surge converter with different layouts. Appl. Energy 292, 116899. doi:10.1016/j.apenergy.2021.116899
Chiu, Y.-C., Chen, B., Shyu, J. Z., and Tzeng, G. H. (2006). An evaluation model of new product launch strategy. Technovation 26 (11), 1244–1252. doi:10.1016/j.technovation.2005.09.002
Choupin, O., Pinheiro Andutta, F., Etemad-Shahidi, A., and Tomlinson, R. (2021). A decision- making process for wave energy converter and location pairing. Renew. Sustain. Energy Rev. 147, 111225. doi:10.1016/j.rser.2021.111225
Despotovic, M., Nedic, V., Despotovic, D., and Cvetanovic, S. (2016). Evaluation of empirical models for predicting monthly mean horizontal diffuse solar radiation. Renew. Sustain. Energy Rev. 56, 246–260. doi:10.1016/j.rser.2015.11.058
Duncan, A. J. (1956). The economic design of | barX charts used to maintain current control of a process. J. Am. Stat. Assoc. 51 (274), 228–242. doi:10.2307/2281343
Gatzert, N., and Kosub, T. (2016). Risks and risk management of renewable energy projects: The case of onshore and offshore wind parks. Renew. Sustain. Energy Rev. 60, 982–998. doi:10.1016/j.rser.2016.01.103
Ghosh, S., Chakraborty, T., Saha, S., Majumder, M., and Pal, M. (2016). Development of the location suitability index for wave energy production by ANN and MCDM techniques. Renew. Sustain. Energy Rev. 59, 1017–1028. doi:10.1016/j.rser.2015.12.275
Gray, J., Chen, J., Hearn, T., Hendricks, E. S., Lavelle, T. M., and Martin, J. R. (2016). “Thermodynamics of gas turbine cycles with analytic derivatives in OpenMDAO,” in Proceeding of the 57th AIAA/ASCE/AHS/ASC Structures, Structural Dynamics, and Materials Conference, San Diego, California, USA, January 2016 (IEEE).
Greaves, D., Conley, D., Magagna, D., Aires, E., Chambel Leitao, J., Witt, M., et al. (2016). Environmental impact assessment: Gathering experiences from wave energy test centres in europe. Int. J. Mar. Energy 14, 68–79. doi:10.1016/j.ijome.2016.02.003
Guanche, R., de Andres, A., Simal, P., Vidal, C., and Losada, I. (2014). Uncertainty analysis of wave energy farms financial indicators. Renew. Energy 68, 570–580. doi:10.1016/j.renene.2014.02.046
Gupta, H. V., Sorooshian, S., and Yapo, P. O. (1999). Status of automatic calibration for hydrologic models: Comparison with multilevel expert calibration. J. Hydrol. Eng. 4 (2), 135–143. doi:10.1061/(asce)1084-0699(1999)4:2(135)
Hmd, A., and Wu, F. (2011). Support vector machine approach to for longitudinal dispersion coefficients in streams. Appl. Soft Comput. 11 (2), 2902–2905.
Ivakhnenko, A. (1971). Polynomial theory of complex systems. IEEE Trans. Syst. Man. Cybern. SMC-1, 364–378. doi:10.1109/tsmc.1971.4308320
Kasirian, M. N., and Yusuff, R. M. (2010). Application of AHP and ANP in supplier selection process-a case in an automotive company. Int. J. Manag. Sci. Eng. Manag. 5 (2), 125–135. doi:10.1080/17509653.2010.10671100
Katsaprakakis, D. A., and Christakis, D. G. (2014). Seawater pumped storage systems and offshore wind parks in islands with low onshore wind potential. A fundamental case study. Energy 66, 470–486. doi:10.1016/j.energy.2014.01.021
Köne, A. Ç., and Büke, T. (2007). An Analytical Network Process (ANP) evaluation of alternative fuels for electricity generation in Turkey. Energy Policy 35 (10), 5220–5228. doi:10.1016/j.enpol.2007.05.014
Lemke, F., and Müller, J.-A. (2003). Self-organising data mining. Syst. Anal. Model. Simul. 43 (2), 231–240. doi:10.1080/0232929031000136135
Luo, Z.-m., Zhou, J. z., Zheng, L. p., Mo, L., and He, Y. y. (2010). A TFN–ANP based approach to evaluate Virtual Research Center comprehensive performance. Expert Syst. Appl. 37 (12), 8379–8386. doi:10.1016/j.eswa.2010.05.044
Mackay, E. B., Bahaj, A. S., and Challenor, P. G. (2010). Uncertainty in wave energy resource assessment. Part 2: Variability and predictability. Renew. energy 35 (8), 1809–1819. doi:10.1016/j.renene.2009.10.027
Nariman-Zadeh, N., Darvizeh, A., Darvizeh, M., and Gharababaei, H. (2002). Modelling of explosive cutting process of plates using GMDH-type neural network and singular value decomposition. J. Mater. Process. Technol. 128 (1), 80–87. doi:10.1016/s0924-0136(02)00264-9
Noori, N., and Kalin, L. (2016). Coupling SWAT and ANN models for enhanced daily streamflow prediction. J. Hydrology 533, 141–151. doi:10.1016/j.jhydrol.2015.11.050
Pascual-González, J., Guillen-Gosalbez, G., Mateo-Sanz, J. M., and Jimenez-Esteller, L. (2016). Statistical analysis of the EcoInvent database to uncover relationships between life cycle impact assessment metrics. J. Clean. Prod. 112, 359–368. doi:10.1016/j.jclepro.2015.05.129
Rotty, R. M. (1979). Growth in global energy demand and contribution of alternative supply systems. Energy 4 (5), 881–890. doi:10.1016/0360-5442(79)90019-7
Saaty, T. L. (1999). “Fundamentals of the analytic network process,” in Proceedings of the 5th international symposium on the analytic hierarchy process.
Saaty, T. L. (2004). Fundamentals of the analytic network process—dependence and feedback in decision-making with a single network. J. Syst. Sci. Syst. Eng. 13 (2), 129–157. doi:10.1007/s11518-006-0158-y
Saaty, T. L. (1980). The analytic hierarchy process: Planning, priority setting, resources allocation. New York: McGraw.
Saniga, E. M. (1989). Economic statistical control-chart designs with an application to X̄ and R charts. Technometrics 31 (3), 313–320. doi:10.2307/3556141
Sharkey, F., Bannon, E., Conlon, M., and Gaughan, K. (2013). Maximising value of electrical networks for wave energy converter arrays. Int. J. Mar. Energy 1, 55–69. doi:10.1016/j.ijome.2013.06.002
Shaw, K., Shankar, R., Yadav, S. S., and Thakur, L. S. (2012). Supplier selection using fuzzy AHP and fuzzy multi-objective linear programming for developing low carbon supply chain. Expert Syst. Appl. 39 (9), 8182–8192. doi:10.1016/j.eswa.2012.01.149
Tan, P.-N., Steinbach, M., and Kumar, V. (2006). Introduction to data mining, 1. Boston: Pearson Addison Wesley.
Tan, X., Ma, K., Guo, W., and Huang, T. (2007). “An application of ANP with benefits, opportunities, costs and risks in supplier selection: A case study in a diesel engine manufacturing firm,” in Proceeding of the Automation and Logistics, 2007 IEEE International Conference on, September 2007 (IEEE).
Velasquez, M., and Hester, P. T. (2013). An analysis of multi-criteria decision-making methods. Int. J. Operations Res. 10 (2), 56–66.
Willmott, C. J., and Matsuura, K. (2005). Advantages of the mean absolute error (MAE) over the root mean square error (RMSE) in assessing average model performance. Clim. Res. 30 (1), 79–82. doi:10.3354/cr030079
Xiao, J., He, C., and Jiang, X. (2009). Structure identification of Bayesian classifiers based on GMDH. Knowledge-Based Syst. 22 (6), 461–470. doi:10.1016/j.knosys.2009.06.005
Keywords: wave energy farm, GMDH, fuzzy, AHP, ANP
Citation: Ghosh S, Majumder M, Mohammed OH, Bajaj M, Singh AR and Kamel S (2022) Estimation of failure probability of wave energy farms by group method of data handling: An indian scenario. Front. Energy Res. 10:1009987. doi: 10.3389/fenrg.2022.1009987
Received: 04 August 2022; Accepted: 05 October 2022;
Published: 24 October 2022.
Edited by:
Iskander Tlili, National School of Engineers of Monastir, TunisiaReviewed by:
Muhammad Shahzad Nazir, Huaiyin Institute of Technology, ChinaCopyright © 2022 Ghosh, Majumder, Mohammed, Bajaj, Singh and Kamel. This is an open-access article distributed under the terms of the Creative Commons Attribution License (CC BY). The use, distribution or reproduction in other forums is permitted, provided the original author(s) and the copyright owner(s) are credited and that the original publication in this journal is cited, in accordance with accepted academic practice. No use, distribution or reproduction is permitted which does not comply with these terms.
*Correspondence: Salah Kamel, c2thbWVsQGFzd3UuZWR1LmVn
Disclaimer: All claims expressed in this article are solely those of the authors and do not necessarily represent those of their affiliated organizations, or those of the publisher, the editors and the reviewers. Any product that may be evaluated in this article or claim that may be made by its manufacturer is not guaranteed or endorsed by the publisher.
Research integrity at Frontiers
Learn more about the work of our research integrity team to safeguard the quality of each article we publish.