 Feiye Zhang
 Qingyu Yang*
- School of Automation Science and Engineering, Xi’an Jiaotong University, Xi’an, China
The smart grid greatly facilitates the transmission of power and information by integrating precise measurement technology and efficient decision support systems. However, deep integration of cyber and physical information entails multiple challenges to grid operation. False data injection attacks can directly interfere with the results of state estimation, which can cause the grid regulator to make wrong decisions and thus poses a huge threat to the stability and security of grid operation. To address this issue, we propose a detection approach against false data injection attacks for dynamic state estimation. The Kalman filter is used to dynamically estimate the state values from IEEE standard bus systems. A long short-term memory (LSTM) network is utilized to extract the sequential observations from states at multiple time steps. In addition, we transform the attack detection problem into supervised learning problem and propose a deep neural network-based detection approach to identify attacks. We evaluate the effectiveness of the proposed detection approach in multiple IEEE standard bus systems. The simulation results demonstrate that the proposed detection approach outperforms benchmarks in improving the detection accuracy of malicious attacks.
1 Introduction
Recently, precise measurement technology and decision support systems have been increasingly widely used in the smart grid, including grid monitoring, information sharing, and attack detection, which have significantly improved the safety and efficiency of grid operation (Lee and Lee, 2015). The integration of IoT systems greatly facilitates the transmission efficiency of smart grids through bilateral flow of power and information. A large number of advanced measurement devices have significantly improved the automation and management level of the smart grid. However, the smart grid is more fragile to attacks than a typical grid because of its open network environment (Connolly et al., 2019; Yang et al., 2017).
As a new type of malicious attack against grid monitoring systems, false data injection attacks are extremely threatening because it is difficult for the defender to identify the attack behaviors (Deng et al., 2015;Cintuglu et al., 2016). The adversary injects a malicious attack based on current state estimation and adjusts the attack vector, which can bypass existing detection methods, resulting a deviation in the results of state estimation results and posing a huge threat to grid operation (Rahman and Mohsenian-Rad, 2013). Unlike traditional power grid attacks, the objects and methods of false data injection attacks have diverse characteristics, thus, it is difficult to detect them with traditional detection methods (e.g., residue-based bad data detection and measurement mutation detection) (Giani et al., 2011; Sandberg et al., 2010).
In recent years, false data injection attacks have received growing attention, and extensive detection approaches have been investigated. Most recent research efforts focus on estimating the state in a static scenario (Guan and Ge, 2017;Rahman and Mohsenian-Rad, 2012). For instance, Guan and Ge (2017) constructed a resilient attack detection approach to detect the presence of false data injection. James et al. (2018) proposed an online deep neural network-based detection approach to oppose false data injection attacks in AC systems. Li et al. (2014) introduced the use of the generalized likelihood ratio to address the attack detection problem with unknown parameters. Rahman and Mohsenian-Rad (2012) proposed a novel measurement to rank smart grid topologies to detect malicious attacks.
Detection approaches based on dynamic state estimation have attracted growing attention in the recent years (Karimipour and Dinavahi, 2017;Kurt et al., 2018b). For instance, Karimipour and Dinavahi (2017) proposed a robust attack detection method based on Euclidean distance metric and Markov decision progress. Taha et al. (2016) presented a dynamic attack detection strategy to mitigate the impact of unknown cyber-attacks. Chakhchoukh et al. (2019) proposed a statistical outlier detection algorithm based on successive batch regression representations of the Kalman filter. Ünal et al. (2021) developed a novel detection approach that employs machine learning, deep learning, and parallel computing techniques. Dayaratne et al. (2022) reported a data-driven unsupervised anomaly detection approach that is based on the k-means clustering method and the Spectral Residual method to detect false data injection attacks in smart grid demand response.
By contrast with existing studies, in this study, we first analyze the basic principles of false data injection attacks from the attackers’ perspective and then present a detection approach for false data injection attacks with dynamic state estimation using a recurrent neural network and a Kalman filter. The main contributions of this study are outlined below:
• We first review the dynamic state estimation of a grid system and briefly analyze the basic principles of false data injection attacks on a smart grid from the attacker’s perspective.
• We then transform the detection problem of injection attacks into a binary classification problem, and we propose a LSTM-based malicious attack detection approach of smart grid.
• Finally, we demonstrate the effectiveness of the proposed attack detection method in multiple IEEE standard bus systems. The experimental results show that the proposed detection method greatly outperforms benchmarks in terms of accuracy.
2 Background
In this section, we present the basic operating principles of the dynamic state estimation of power system. Then, we introduce a conventional bad data detection mechanism. Finally, we briefly show a false data injection attack model from the attacker’s perspective.
2.1 Dynamic state estimation
State estimation refers to the obtaining of network topology and real-time measurement data through a supervisory control and data acquisition (SCADA) system. The SCADA system estimates the state of grid operations to perform a power system analysis, safety monitoring, etc. Dynamic state estimation then obtains the estimated state value based on measurement data instead of directly calculating the state value at the current moment, such as in static state estimation. As an example of typical dynamic state estimation approach, a Kalman filter uses discrete measurement sequences {z1, z2, … , zn} to estimate discrete state sequences {x1, x2, … , xn}. For a discrete state sequence, there are two ways to estimate the state value xt+1 at time t + 1 from the state value at time t: 1) estimate the state value xt+1 with measurement data zt+1 obtained at t + 1; 2) predict the state value xt+1 through the system state xt at t.
Notice that part of the state quantity xt+1 is calculated from the indirect estimation of the measurement data zt+1, and the other part of the state quantity xt+1 is calculated from the system state xt through state transition prediction. In a power system that contains m measurement data and n + 1 nodes, the state prediction equation and measurement equation for a discrete system are expressed as:
where xt denotes the system state value with n × 1 dimensions at time t, Ft−1 is the transition function with n × n dimensions, Wt is an n × 1 dimensional noise with mean zero. zt is a measurement vector with m × 1 dimensions, Ht is the measurement matrix of a system with m × n dimensions. Vt is m × 1 dimensional noise with a mean of zero.
We aim seek the estimation of state
The basic principle of Kalman filtering techniques includes two components: state prediction and state update (Fan and Li, 2009).
State prediction:
State update:
where
Kalman filter technology uses a recursive method to dynamically estimate the state of system. It only needs current measurement data zt+1 and the estimation data xt from the previous period to estimate the optimal state
2.2 Bad data detection mechanism
At time step k, the error vector in the dynamic state estimation process of power grid, denoted as et, can be formulated as:
where et is the error vector at time step t, and zt denotes the measurement vector. Notice that et follows a Gaussian distribution.
The normalized error vector λt is derived as:
where et,i is the i − th component of error vector, and Vt,I is the i − th component of measurements error covariance matrix. As shown in Table 1, a traditional bad data detection mechanism judges the system state according to the value λt,i:Note that we believe that the system does not encounter false data injection attacks if (8) is satisfied:
where τ is the detection threshold.
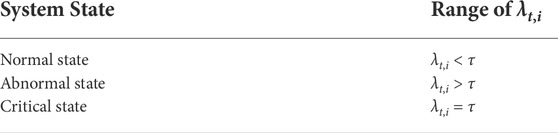
TABLE 1. Bad data detection mechanism.
2.3 Attack strategy
The basic principle of a bad data detection mechanism is to identify whether the normalized error vector λt in (Eq. 8) surpasses τ. However, the adversary’s objective is to manipulate the attack vector to bypass the detection approach. We thus briefly present the attack model from the attacker’s perspective (Ding and Liu, 2017; Hu et al., 2015).
State measurement data
where zt,i is the measurement data, and at,I is the malicious attack vector injected by the attacker.
According to the bad data detection mechanism |λt,i| ≤ τ presented in Section 2.2, the following equation can be derived:
By bringing (9) into (2.3), we have,
Finally, we can derive the safety range of the attack vector:
Obviously, we can see that the data integrity attack can bypass traditional detection if the attack at,i is in the interval indicated in (11).
3 Proposed solution
In this section, we propose a neural network-based approach to detect data integrity attacks against the dynamic state estimation of a smart grid. From Section 2.2 we know that traditional bad data detection mechanisms determine whether a system is abnormal by comparing the normalized error vector λk against a specific threshold. However, the detection accuracy is greatly affected by the value of the threshold. When the threshold is high, the detection accuracy decreases, and when the threshold is low, the amount of false detections increase. Thus, in this section we propose an LSTM network that can draw information from observations in previous m episodes to determine whether the system is currently under a data injection attack to implicitly and automatically analyze changes in the threshold when detecting malicious attacks.
3.1 Observations of the system
Before introducing the proposed approach, we present observations of the system regarded as the metrics for determining whether the power grid system is under attack.
According to Section 2.2, it is difficult to directly check the presence of data injection attacks by the state vector of the system. In this way, we define the computable observation ot of the system state at time t:
where
3.2 LSTM-based feature extraction
From Section 2.1, we know that the measurement data for the dynamic state estimation are correlated in time, so it is reasonable to utilize the previous measurement data to judge the presence of data injection attacks. Moreover, because the measurement data of the power grid always contains system noise, only using measurement data at a single time step without considering the sequential information in the system is not a good choice for determining the presence of a false data injection attack. Note that a recurrent neural network (RNN) has shown excellent performance in processing sequential data, and it can extract sequential measurement features to improve the accuracy of false data injection attacks (Sutskever et al., 2014). An LSTM network is a type of RNN that is designed to model temporal sequences, and its prediction of long-term dependencies is more accurate than typical RNN (Gers et al., 2000). Thus, we utilize the LSTM network to extract measurement data over multiple time periods to check the presence of data injection attacks in the power grid system.
Figure 1 presents the basic structure of the LSTM network utilized in this study. From Figure 1, we can see that there are m LSTM cells that are used to store the observations of the power grid system in previous time steps. Specifically, the input of the first LSTM cell is the observation ot−m of the system at time t − m. Then, the first LSTM cell utilizes ot−m to calculate the hidden state ht−m, which contains information on the previous observation. After that, the second LSTM cell calculates its hidden state ht−m+1 by ht−m and its current observation of the system ot−m+1. This calculation is then repeated in all LSTM cells, and we utilize the final output of the last LSTM cell as the aggregated observation, denoted as o(t), which contains not only current information on the system observation but the representation of the observation over the past m time steps.
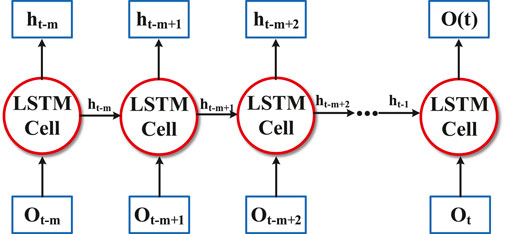
FIGURE 1. LSTM network structure.
3.3 Attack detection algorithm
In the following, the proposed attack-detection method is described. It includes three main procedures: data preprocessing, neural network training, and detection accuracy testing. The overall structure of the attack detection algorithm is illustrated in Figure 2, in which, the system first preprocesses the data from IEEE standard bus system and divides the data into two parts: a training set and a testing set, where the training set is used to update the parameters of the neural networks, and the testing set is used to evaluate the accuracy of thee attack detection approach. Then, we train the proposed deep neural network using the training data. Finally, the trained network is used to detect whether the system is under attack. The details of these three parts are presented as follows.
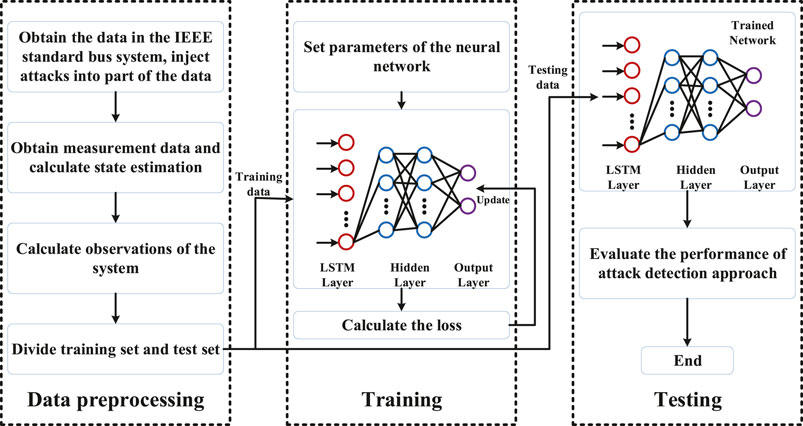
FIGURE 2. Structure of an attack detection algorithm.
3.3.1 Data preprocessing
We define the state of the system with x = {x1, x2, … , xn}, where each state xi contains information on phase angles and voltage magnitudes. The number of episodes in the data-preprocessing process is E, and each episode lasts for T time steps. For each time step t, we obtain the state of the system x from the IEEE standard bus system, as illustrated in Figure 3. The measurement of the system is expressed as z = {z1, z2, … , zm}, and it is calculated by Eq. (2). After this, Kalman filter technology is employed to estimate the system state
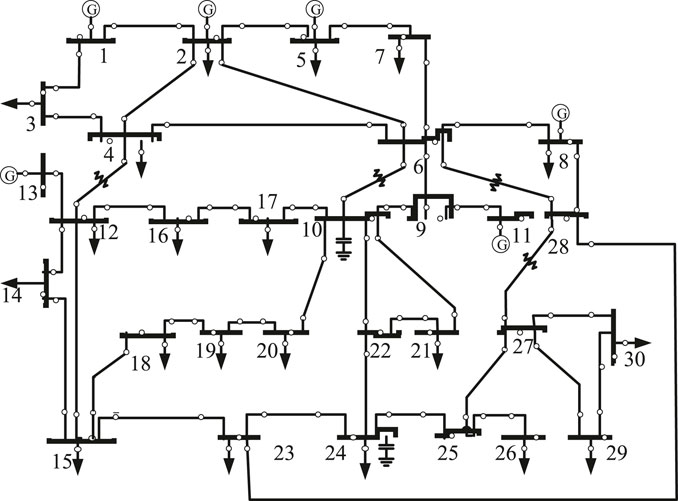
FIGURE 3. IEEE—30 standard bus system.
The attacker adjusts the attack vector to bypass the traditional bad data detection approach. To generate training data, we inject the attack vector, denoted as a, into the measurement data and formulate the process of the data injection attack, as follows:
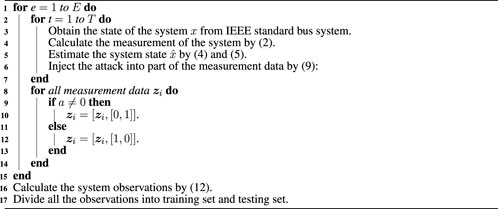
where z is the original measurement data and z′ is the measurement data after the system is attacked. Then we label the measurement data, such that label = [1, 0] means that the data are under attack, and label = [0, 1] means that they are not being attacked. In this way, we transform the attack detection problem into a supervised learning problem, and we utilize a deep neural network to classify the labeled observations. Finally, we divide the labeled observations into a training set and a testing set, using the training set to update the parameters of the neural networks and the testing set to evaluate the accuracy of the attack detection approach. The pseudocode for the data preprocessing is presented in Algorithm 1, in which we obtain the system states in the IEEE standard bus system and inject attacks to the measurements data. Then we label the observations and utilize the deep neural network for classification.
Algorithm 1. Data preprocessing of the attack detection approach.
3.3.2 Neural network training
As shown in Figure 2, we utilize the training data divided from the labeled observations to update the parameters of the neural network. The neural network has an excellent ability to model nonlinear functions Nielsen (2015). The proposed classifier is a deep neural network that consists of three layers. We randomly initialize the parameters θ of the neural network including weights ω and bias b at the beginning of the training. In each training episode e, we sample a mini-batch of the training data with size M. We regard the LSTM layer as the input layer to make full use of the impact of previous observations on the current state, and we feed the LSTM layer with the time series of observations [ot−m, ot−m+1, … , ot] with length m. Therefore, the output of the LSTM layer is given as follows:
where f1(⋅) represents the calculation function of the LSTM layer. Then the output of the LSTM layer o(t) is fed into the hidden layer, including two fully-connected neural networks. The output is represented by:
where f2(⋅) and f3(⋅) are the calculation functions of each fully-connected layer. Finally, the output layer contains two neurons that generate the judgment of the system state based on the system observations in the current parameters of the neural network. Specifically, the output of the neural network is P = [p0, p1], where p0 > p1 indicates that the detector believes that the system is operating normally, and p0 < p1 denotes that the system is under attack.
The loss function of the entire neural network is indicated as the square of the difference between the outputs and labels:
where Pi is the output of the neural network from feeding the i − th observations and labeli is the label for the i − th observations in the mini-batch. The gradient of loss function
where α is the learning rate, which determines neural network training speed.
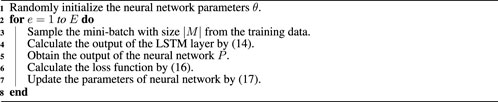
The pseudocode for the neural network training is given in Algorithm 2, which mainly describes the training process for the neural network, using the sampled mini-batch from the training data. The parameters of the neural networks are updated by the back-propagation of the gradient of loss function.
Algorithm 2. Neural network training of the attack detection approach.
3.3.3 Detection accuracy testing
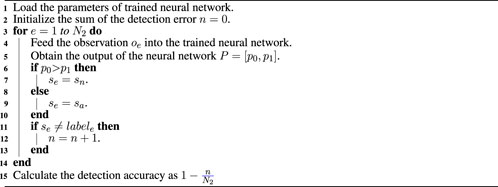
After the training process, the trained neural network is used to evaluate detection accuracy against malicious attacks. We utilize testing data with size N2 from the labeled observations to determine whether the system can correctly capture false data injection attacks. First, sequential observations are regarded as the input of the trained neural network. Then the network generates the output P = [p0, p1]. If p0 > p1, the detector believes that the system is operating normally, and if p0 < p1, the detector thinks the system is under attack. Finally, we compare the output of the detector with the label of the observations to indicate the correctness of detection and define the number of correctly classified samples, divided by the total number of samples as the metric. The procedure for detection accuracy testing is outlined in Algorithm 3, in which it can be seen that the trained neural network is utilized to evaluate the accuracy of detecting the malicious data injection attacks.
Algorithm 3. Detection accuracy testing.
4 Experiments
In this section, we evaluate the detection accuracy of the proposed detection approach in IEEE standard bus systems. We first describe the experimental settings. Then, the detection accuracy of our proposed detection approach is presented, compared with benchmarks. After that, we evaluate the impact of different attack amplitudes and different model parameters on the performance of detection accuracy.
4.1 Experimental settings
4.1.1 Parameters
We investigate the performance of our proposed attack detection approach in IEEE-9, 14, 30, 118, and 300 standard bus systems. The initial state value of the system and measurement matrix are obtained from MATPOWER Zimmerman et al. (2010). The main parameters of the proposed detection approach are presented in Table 2. Specifically, we set the size of the observation sequence of the LSTM layer as 4. We set the number of training data accounting for 90% of the total number of labeled observations, such that the testing process utilizes 10% of the observations to evaluate detection performance. The amplitude of the attack is 1% of the measurement data. The size of the mini-batch is set as 40. The number of episodes E is set to 100, and each episode lasts for 50 time steps. In addition, the learning rate α is set to 0.001, and the structure of hidden layer is set as (36, 64, 64).
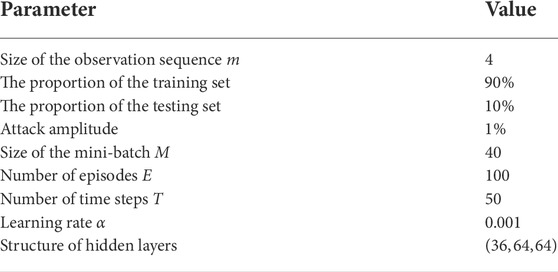
TABLE 2. Parameters of proposed detection approach.
4.1.2 Benchmarks
To evaluate its effectiveness, we compare the proposed attack-detection method with the following two benchmarks:
• BPNN: Back propagation neural network-based (BPNN) detection approach utilizes a fully connected neural network to detect whether the grid system is under attack. The BPNN-based detection approach does not utilize the LSTM layer to extract the previous observations to estimate the current state. The remaining settings are the same as those of the proposed approach.
• BPNN-imp: BPNN-imp is an enhanced detection approach based on the BPNN. It utilizes the concept of a sliding window to input multiple observations into the neural network at once Kurt et al. (2018a). We set the size of the sliding window to the same length as m. The remaining settings are the same as a BPNN-based approach.
4.1.3 Attack scenario
To demonstrate the effectiveness of the proposed detection mechanism in improving the detection accuracy, we introduce two types of attack scenarios: continuous attack and discontinuous attack. The details of these attack scenarios are given in the following:
• continuous attack: in a continuous attack scenario, the attack is launched at the half time step of the episode, i.e.,
• discontinuous attack: in the discontinuous attack scenario, the attack is launched at any time step after the half time step of the episode, i.e.,
4.2 Results of attack detection
We utilize detection accuracy as the evaluation metric to identify the effectiveness of the proposed detection method. The detection accuracy is defined as the number of correctly classified samples, divided by the total number of samples.
We first conduct experiments to compare the detection accuracy of the proposed attack detection approach with BPNN-based approach and a BPNN-imp-based approach against a continuous false data injection attack under the IEEE-9, 18, 30, 118, and 300 bus standard systems. Table 3 shows the simulation results:
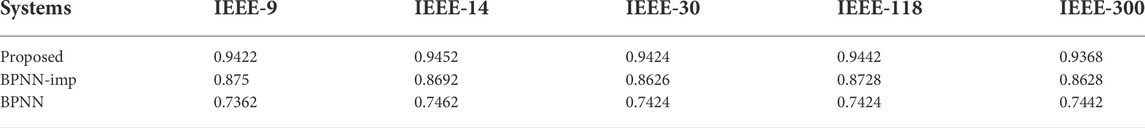
TABLE 3. Detection accuracy in continuous attack scenario.
Table 3 proves that our proposed detection approach outperforms BPNN-based approach and the BPNN-imp-based approach on the continuous attack scenario in terms of attack detection accuracy. Specifically, the average detection accuracy of the proposed approach reaches about 0.9422, 0.9452, 0.9424, 0.9442, and 0.9368 in the IEEE-9, 14, 30, 118, and 300 systems, respectively. Obviously, the proposed detection approach significantly outperforms the benchmarks in detecting the continuous false data injection attacks, which achieves a 7.7, 8.7, 9.3, 8.2, and 8.6% higher detection accuracy than the BPNN-imp-based approach and a 28.0, 26.7, 26.9, 27.2, and 25.9% higher detection accuracy than the BPNN-based approach in IEEE-9, 14, 30, 118, and 300 systems, respectively. In addition, the accuracies of the three detection approaches are basically unchanged under different systems, which demonstrates that the complexity of the system has no impact on the performance of detection accuracy against a continuous attack.
We then compare the detection accuracy of our proposed detection approach with benchmarks for the discontinuous attack model. Table 4 shows the detection accuracy for detection approaches on a discontinuous attack scenario. The results in Table 4 are in general same as those for the continuous attacks. The average detection accuracy against the discontinuous attack of the proposed approach reaches 0.7634, 0.7598, 0.757, 0.7642, and 0.7582 in IEEE-9, 14, 30, 118, and 300 systems, respectively. Clearly, the proposed detection approach achieves a 12.4, 11.9, 12.1, 12.6,and 12.5% higher detection accuracy than the BPNN-imp-based approach and a 29.0, 27.2, 26.1, 25.4, and 27.6% higher detection accuracy than the BPNN-based approach in IEEE-9, 14, 30, 118, and 300 systems, respectively. Furthermore, as can be seen in Tables 3, 4, discontinuous attacks are more difficult to detect than continuous ones, which have lower detection accuracy with the same approaches and the same testing systems.
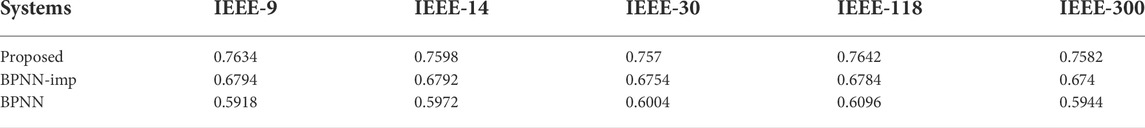
TABLE 4. Detection accuracy in discontinuous attack scenario.
4.3 Training time
Next, we investigate the training time of the proposed detection approach in different systems in Figure 4, where we can see that, although the detection accuracy of the proposed detection approach under different systems is substantially equal, there is a large difference in the training time. Specifically, as the complexity of the system gradually increases, the running time of the detection approach increases significantly. The running time of the detection approach for the IEEE-9 bus system is only 6.57 s, and the running time of the detection approach on IEEE-300 bus system increases by nearly 118 times, to 777.32 s.
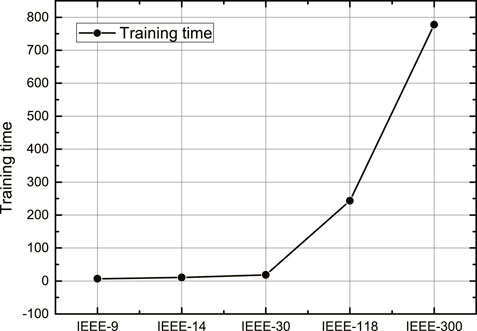
FIGURE 4. Training time of different systems.
4.4 Discussion of attack amplitude
We now consider the impacts of different attack amplitudes on the performance of detection accuracy on an IEEE-30 bus standard system. The results are shown in Figure 5, in which we set the attack amplitude to increase from 0.1 to 2% at a step of 0.1%. In Figure 5, the red line with square marks represents detection accuracy of the continuous attacks. The blue line with triangle marks illustrates the detection accuracy of discontinuous attacks. From Figure 5 we can see that, with increasing attack amplitude, detection accuracy also increases, which demonstrates that the attacks with larger amplitudes are easier to identify by the detection approach. We can also see from Figure 5 that the increment of the detection accuracy is more obvious with increasing attack amplitude when the attack amplitude is small (e.g., the attack amplitude is larger than 0.1% and less than 0.5%). As the attack amplitude gradually increases, the growth rate of the detection accuracy also gradually slows. When the attack amplitude reaches a certain level, the detection accuracy tends to be stable. Moreover, the increment of detection accuracy with the increase in attack amplitude in a continuous attack scenario is faster than that in a discontinuous attack scenario, and the detection accuracy in a continuous attack scenario is always higher than that in a discontinuous attack.
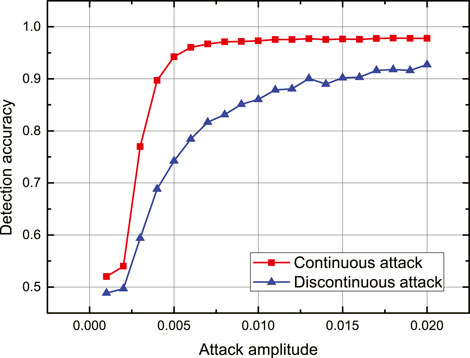
FIGURE 5. Detection delay under different attack amplitudes.
4.5 Impact of training parameters
Finally, we evaluate the impact of the observation sequence length m on the performance of the proposed detection approach in the IEEE-30 bus standard system. The results are shown in Figures 6 and 7, where Figure 6 represents the results of detection accuracy at different m under continuous attack, and Figure 7 represents the results of detection accuracy at different m under discontinuous attack. From Figures 6 and 7, we can see that, when the observation sequence length m is larger than 1 and smaller than 4, the increase of m results in the improvement of the detection accuracy. However, when the observation sequence length m is larger than 4, the increase of m has little impact on the accuracy of detection, and the detection accuracy for both continuous and discontinuous attacks tends to converge to a certain value.
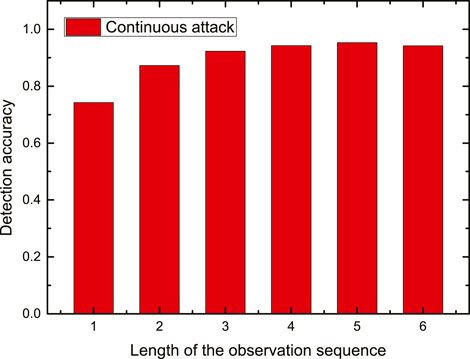
FIGURE 6. Detection accuracy at different m under continuous attacks.
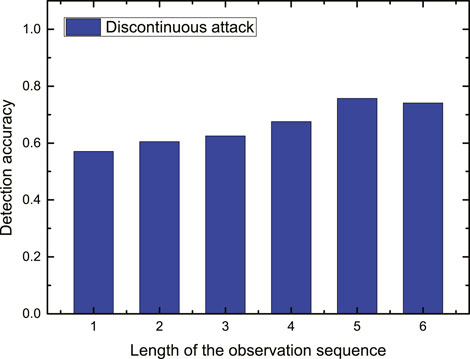
FIGURE 7. Detection accuracy at different m under discontinuous attacks.
5 Conclusion
In this study, we propose an LSTM-based false data injection attack detection approach for dynamic state estimation in a smart grid. We propose a neural network model that utilizes the LSTM network to extract the previous observations to determine the current state estimation. We transform a malicious data injection attack detection into supervised learning and train the proposed deep neural network for classification. We conduct extensive experiments to illustrate the effectiveness of proposed detection method and investigate the impact of attack amplitudes and model parameters on detection accuracy. The simulation results demonstrate that the proposed detection approach outperforms BPNN-imp-based approach and BPNN-based approach in detection accuracy.
Data availability statement
Publicly available datasets were analyzed in this study. These data can be found here: https://www.mathworks.com/matlabcentral/fileexchange/72085-matpower.
Author contributions
FZ: conceptualization, methodology, software, investigation, formal analysis, writing—original draft. QY (corresponding author): conceptualization, funding acquisition, resources, supervision, writing—review and editing.
Funding
The work was supported in part by the National Key Research and Development Program of China under Grant 2019YFB1704103, in part by the National Science Foundation of China under Grants 61973247, 61673315 and 62173268, in part by the Fundamental Research Funds for the Central Universities under Grant xzy022021050.
Conflict of interest
The authors declare that the research was conducted in the absence of any commercial or financial relationships that could be construed as a potential conflict of interest.
Publisher’s note
All claims expressed in this article are solely those of the authors and do not necessarily represent those of their affiliated organizations, or those of the publisher, the editors and the reviewers. Any product that may be evaluated in this article, or claim that may be made by its manufacturer, is not guaranteed or endorsed by the publisher.
References
Chakhchoukh, Y., Lei, H., and Johnson, B. K. (2019). Diagnosis of outliers and cyber attacks in dynamic pmu-based power state estimation. IEEE Trans. Power Syst. 35, 1188–1197. doi:10.1109/tpwrs.2019.2939192
Cintuglu, M. H., Mohammed, O. A., Akkaya, K., and Uluagac, A. S. (2016). A survey on smart grid cyber-physical system testbeds. IEEE Commun. Surv. Tutorials 19, 446–464. doi:10.1109/comst.2016.2627399
Connolly, L. Y., Lang, M., and Wall, D. S. (2019). Information security behavior: A cross-cultural comparison of Irish and us employees. Inf. Syst. Manag. 36, 306–322. doi:10.1080/10580530.2019.1651113
Dayaratne, T., Salehi, M., Rudolph, C., and Liebman, A. (2022). False data injection attack detection for secure distributed demand response in smart grids,” in 2022 52nd Annual IEEE/IFIP International Conference on Dependable Systems and Networks (DSN), Baltimore, MD, USA, June 27–30, 2022, 367–380. doi:10.1109/DSN53405.2022.00045
Deng, R., Xiao, G., and Lu, R. (2015). Defending against false data injection attacks on power system state estimation. IEEE Trans. Ind. Inf. 13, 198–207. doi:10.1109/tii.2015.2470218
Ding, Y., and Liu, J. (2017). “Real-time false data injection attack detection in energy internet using online robust principal component analysis,” in 2017 IEEE Conference on Energy Internet and Energy System Integration (EI2), Beijing, China, November 26–28, 2017, 1–6. doi:10.1109/EI2.2017.8245663
Fan, W., and Li, Y. (2009). “Accuracy analysis of sigma-point kalman filters,” in 2009 Chinese control and decision conference (IEEE), 2883.
Gers, F. A., Schmidhuber, J., and Cummins, F. (2000). Learning to forget: Continual prediction with lstm. Neural Comput. 12, 2451–2471. doi:10.1162/089976600300015015
Giani, A., Bitar, E., Garcia, M., McQueen, M., Khargonekar, P., and Poolla, K. (2011). “Smart grid data integrity attacks: Characterizations and counter measures,” in 2011 IEEE International Conference on Smart Grid Communications (SmartGridComm), Brussels, Belgium, October 17–20, 2011, 232–237. doi:10.1109/SmartGridComm.2011.6102324
Guan, Y., and Ge, X. (2017). Distributed attack detection and secure estimation of networked cyber-physical systems against false data injection attacks and jamming attacks. IEEE Trans. Signal Inf. Process. Netw. 4, 48–59. doi:10.1109/tsipn.2017.2749959
Hu, Z., Wang, Y., Tian, X., Yang, X., Meng, D., and Fan, R. (2015). “False data injection attacks identification for smart grids,” in 2015 Third International Conference on Technological Advances in Electrical, Electronics and Computer Engineering (TAEECE), Beirut, Lebanon, April 26–May 1, 2015, 139–143. doi:10.1109/TAEECE.2015.7113615
James, J., Hou, Y., and Li, V. O. (2018). Online false data injection attack detection with wavelet transform and deep neural networks. IEEE Trans. Ind. Inf. 14, 3271–3280. doi:10.1109/tii.2018.2825243
Karimipour, H., and Dinavahi, V. (2017). Robust massively parallel dynamic state estimation of power systems against cyber-attack. IEEE Access 6, 2984–2995. doi:10.1109/access.2017.2786584
Kurt, M. N., Ogundijo, O., Li, C., and Wang, X. (2018a). Online cyber-attack detection in smart grid: A reinforcement learning approach. IEEE Trans. Smart Grid 10, 5174–5185. doi:10.1109/tsg.2018.2878570
Kurt, M. N., Yılmaz, Y., and Wang, X. (2018b). Distributed quickest detection of cyber-attacks in smart grid. IEEE Trans. Inf. Forensic. Secur. 13, 2015–2030. doi:10.1109/tifs.2018.2800908
Lee, I., and Lee, K. (2015). The internet of things (iot): Applications, investments, and challenges for enterprises. Bus. horizons 58, 431–440. doi:10.1016/j.bushor.2015.03.008
Li, S., Yılmaz, Y., and Wang, X. (2014). Quickest detection of false data injection attack in wide-area smart grids. IEEE Trans. Smart Grid 6, 2725–2735. doi:10.1109/tsg.2014.2374577
Nielsen, M. A. (2015). Neural networks and deep learning, 25. San Francisco, CA, USA: Determination press.
Rahman, M. A., and Mohsenian-Rad, H. (2013). False data injection attacks against nonlinear state estimation in smart power grids in 2013 IEEE Power & Energy Society General Meeting (IEEE), Vancouver, BC, July 21–25, 2013, 1–5. doi:10.1109/PESMG.2013.6672638
Rahman, M. A., and Mohsenian-Rad, H. (2012). “False data injection attacks with incomplete information against smart power grids,” in 2012 IEEE Global Communications Conference (GLOBECOM) (IEEE), Anaheim, CA, USA, December 3–7, 2012, 3153–3158. doi:10.1109/GLOCOM.2012.6503599
Sandberg, H., Teixeira, A., and Johansson, K. H. (2010). “On security indices for state estimators in power networks,” in First workshop on secure control systems (SCS) Stockholm.
Sutskever, I., Vinyals, O., and Le, Q. V. (2014). “Sequence to sequence learning with neural networks,” in 27th Advances in Neural Information Processing Systems (NIPS 2014), Montreal, Canada, December 7–14, 2014. doi:10.5555/2969033.2969173
Taha, A. F., Qi, J., Wang, J., and Panchal, J. H. (2016). Risk mitigation for dynamic state estimation against cyber attacks and unknown inputs. IEEE Trans. Smart Grid 9, 886–899. doi:10.1109/tsg.2016.2570546
Ünal, F., Almalaq, A., Ekici, S., and Glauner, P. (2021). Big data-driven detection of false data injection attacks in smart meters. IEEE Access 9, 144313–144326. doi:10.1109/ACCESS.2021.3122009
Yang, Q., An, D., Min, R., Yu, W., Yang, X., and Zhao, W. (2017). On optimal pmu placement-based defense against data integrity attacks in smart grid. IEEE Trans. Inf. Forensic. Secur. 12, 1–1750. doi:10.1109/tifs.2017.2686367
Keywords: smart grid, false data injection attack, dynamic state estimation, Kalman filter, deep learning
Citation: Zhang F and Yang Q (2022) False data injection attack detection in dynamic power grid: A recurrent neural network-based method. Front. Energy Res. 10:1005660. doi: 10.3389/fenrg.2022.1005660
Received: 28 July 2022; Accepted: 12 August 2022;
Published: 15 September 2022.
Edited by:
Hanlin Zhang, Qingdao University, ChinaCopyright © 2022 Zhang and Yang. This is an open-access article distributed under the terms of the Creative Commons Attribution License (CC BY). The use, distribution or reproduction in other forums is permitted, provided the original author(s) and the copyright owner(s) are credited and that the original publication in this journal is cited, in accordance with accepted academic practice. No use, distribution or reproduction is permitted which does not comply with these terms.
*Correspondence: Qingyu Yang, eWFuZ3Fpbmd5dUBtYWlsLnhqdHUuZWR1LmNu