 Daohong Wei1*
 Huawei Li
 Yan Ren
94% of researchers rate our articles as excellent or good
Learn more about the work of our research integrity team to safeguard the quality of each article we publish.
Find out more
ORIGINAL RESEARCH article
Front. Energy Res., 21 September 2022
Sec. Sustainable Energy Systems
Volume 10 - 2022 | https://doi.org/10.3389/fenrg.2022.1004277
Hydrogen production using solar energy is an important way to obtain hydrogen energy. However, the inherent intermittent and random characteristics of solar energy reduce the efficiency of hydrogen production. Therefore, it is necessary to add an energy storage system to the photovoltaic power hydrogen production system. This paper establishes a model of a photovoltaic power generation hydrogen system and optimizes the capacity configuration. Firstly, the mathematical model is modeled and analyzed, and the system is modeled using Matlab/Simulink; secondly, the principle of optimal configuration of energy storage capacity is analyzed to determine the optimization strategy, we propose the storage capacity configuration algorithm based on the low-pass filtering principle, and optimal time constant selection; finally, a case study is conducted, whose photovoltaic installed capacity of 30 MW, verifying the effectiveness of the proposed algorithm, analyzing the relationship between energy storage capacity and smoothing effect. The results show that as the cut-off frequency decreases, the energy storage capacity increases and the smoothing effect is more obvious. The proposed algorithm can effectively reduce the 1 h maximum power variation of PV power generation. In which the maximum power variation of PV generation 1 h before smoothing is 4.31 MW. We set four different sets of time constants, the maximum power variation of PV generation 1 h after smoothing is reduced to 0.751, 0.389, 0.078, and 0.04 MW, respectively.
Vigorously developing green, clean, and non-polluting energy has become the focus of research all over the world. In 2020, China clearly put forward the goals of “peak carbon dioxide emissions” by 2030 and “carbon neutral” by 2060, and vigorous development of clean energy is an important measure to achieve the double carbon goal (Liu et al., 2022). Due to the random and intermittent characteristics of solar energy, the traditional photovoltaic power generation has the phenomenon of abandoning light (Jurasz et al., 2018; Du et al., 2019; Li et al., 2021). The high development cost and low utilization rate of clean energy do not meet the needs of social development, therefore, people have begun to try to solve the problem of storage of surplus energy in the process of generating electricity from clean energy such as wind and light. At present, there are two most commonly used solutions, one is to use the energy storage system to stabilize the fluctuation of wind and solar output and reduce the rate of abandoning wind and light, and the other is to use hydrogen energy to store part of the energy. Hydrogen is the most environmentally friendly energy source with the highest calorific value of 142.836 MJ kg−1, making it an excellent medium that can be used to store energy. In 2022, China released a medium and long-term plan for the hydrogen energy industry (Chao and Tao, 2021), and carrying out PV power generation to produce hydrogen can effectively solve the problems of light abandonment and PV grid connection, which is of great significance to achieve the double carbon goal.
Experts and scholars at home and abroad have focused their research on multi-energy hybrid systems on energy sources such as hydro, wind and PV. Ren et al. (2022) established a scheduling model for small-capacity hydropower and large-capacity wind power photovoltaic power generation, and used the flexibility of small hydropower to smooth out wind and optical power output fluctuations. A multi-objective model based on complementary hydro-wind-pv power generation was constructed by (Wang et al., 2017) and (Yin et al., 2019), both with the objectives of maximizing power generation and minimizing output fluctuations, with differences in the solution algorithms. However, the ability to smooth the output power curve using the complementarity between hydro-wind-pv is limited, therefore, An et al. (2019) and Liu et al. (2019) incorporated energy storage devices in clean energy generation systems to further improve clean energy utilization and reduced the hazard of clean energy fluctuations to the grid. The cost of energy storage equipment is high, and for owners who seek to maximize profits, the capacity of energy storage equipment should be as small as possible while meeting the requirements of the power grid, so the configuration of energy storage capacity is critical. Hou et al. (2020)added an energy storage system on the basis of wind and solar energy, aimed at the total cost of the system, optimized the capacity of the hybrid power system, and analyzed the impact of different energy storage methods on the system cost. The optimal configuration of energy storage capacity can effectively improve the system economy, Wang et al. (2018),Li et al. (2019), and Wu et al. (2019) studied the capacity configuration of hybrid energy storage systems based on low-pass filtering methods. The above research mainly discusses how to smooth the new energy output curve, all based on the grid can be absorbed, when the grid can not consume new energy power, need a medium to store the excess energy, hydrogen energy is one of the medium.
There is a lot of research in the field of hydrogen energy and other renewable energy sources by domestic and foreign experts and scholars, but there are relatively few research projects targeting the coupling of hydrogen energy into other energy sources (Ulleberg, 2004). used control strategies as an entry point to study the importance of control strategies in PV-powered hydrogen energy systems. A realistic system of direct coupling of photovoltaic power generation to electrolytic water for hydrogen production was established and the operational results proved the practicality of the system (Clarke et al., 2009). Sopian et al. (2009) added a battery pack as a buffer on the basis of wind, light and hydrogen, and the system worked well, but the electrolyzer structure still needs to be improved to avoid hydrogen leakage. Studies of Castaneda et al. (2013) show that hybrid systems consisting of PV and batteries have the lowest cost, while hydrogen systems consisting of PV and hydrogen have the highest cost. Schnuelle et al. (2020) studied the key factors in the wind-photovoltaic hydrogen production system, such as hydrogen production efficiency and power utilization, which depend on the instantaneous power of the input signal and the ability of the electrolyzer to respond to these signals. Awasthi et al. (2011) carried out a dynamic modeling of the PEM electrolyzer, and the results of the model showed that the operating temperature and pressure have opposite effects on the performance, and the electrolyzer must operate at the set temperature and pressure values. Park et al. (2006) constructed a solar hydrogen production system, the electrolyzer uses solid polymer electrolyte, and compared the simulation situation with the actual operation situation, and the results are consistent. Xiao et al. (2020) investigated wind electrolytic hydrogen storage systems, where wind power can sell electricity to the electricity market or convert the electricity from both languages to hydrogen through hydrogen production, but wind power needs to undergo AC-DC conversion before it can be used for hydrogen production. Using hydrogen energy as a storage medium to store part of the energy that cannot be consumed by the grid can further improve the utilization rate of new energy, and the stored hydrogen energy can be used as an accident backup to further improve the stability of the grid.
Research on new energy-coupled hydrogen production systems is in full swing, in which there are still problems in energy coupling, storage system capacity configuration, low-pass filtering strategy time constant selection, etc. Dufo-Lopez and Bernal-Agustín (2008) introduced diesel power generation system in PV-wind power-hydrogen production-storage system, which can improve system stability to some extent, but also leads to CO2 emissions, most new energy hydrogen production systems do not include traditional power generation methods in order to reduce carbon emissions. For this reason, Khalilnejad and Riahy (2014) modeled the scenic hydrogen production system without considering the installation of an energy storage system. Although the natural complementarity of the scenery can be used to reduce the abandonment phenomenon to some extent, the system would be more complete by adding an energy storage system. Low-pass filtering is a common method for capacity configuration optimization, Zhu et al. (2020) and Bocklisch (2015) used low-pass filtering methods to smooth the wind-pv output curve to determine the capacity of the energy storage system, but none of them discussed the selection of time constants. This paper constructs a PV power generation hydrogen production system based on the characteristics of PV power generation to achieve zero carbon, and proposes a storage capacity optimization strategy based on the low-pass filtering principle to achieve the maximum utilization of PV. In this system, PV power generation does not need AC-DC conversion, and hydrogen is produced directly, and the energy storage system is used to smooth the PV output curve and reduce light abandonment. In the time constant selection, the time constants are optimized according to Chinese national standards, and the system capacity is configured under four time constants.
1) The mathematical model of the system is analyzed and modeled, and the PV power generation-storage - hydrogen production model is established and its operation mode is discussed.
2) The low-pass filtering principle is analyzed, the time constants are optimized, and the storage capacity algorithm to meet the energy demand of the leveling process is proposed on its basis.
3) The raw irradiance of 8760 h at a site is input into the model to generate 8760 h of PV power data, and the low-pass filtering strategy is used to verify the effectiveness of the energy storage capacity optimization strategy proposed in this paper.
4) Analyzed the relationship between smoothing effect and energy storage capacity.
The rest of this paper is organized as follows. Section 2 analyzes the mathematical models of the PV power generation system, electrolytic water hydrogen production, and hydrogen storage system in the system, and then establishes the simulation model. Section 3 analyzes the low-pass filtering principle, then proposes the storage capacity algorithm to meet the energy demand of the leveling process, and finally optimizes the filtering time constants. Section 4 presents the system overview, then analyzes the effectiveness of PV output fluctuations, and finally analyzes the relationship between the smoothing efficiency and energy storage capacity. In the last section, a summary of the work done in this paper is presented.
The PV power generation and hydrogen production hybrid energy storage system includes PV power generation system, electrolytic water hydrogen production, hydrogen storage tank, energy storage system, and other subsystems. The system structure diagram is shown in Figure 1. The electrical energy output from PV power generation is transmitted to the DC bus, which acts as an energy exchange center to provide electrical energy to the electrolytic water hydrogen production system, the energy storage system performs power leveling, and finally, the electrolytic water hydrogen production system completes the conversion of electrical energy to hydrogen energy. The models in this chapter are modeled and simulated using Matlab/Simulink.

FIGURE 1. System structure diagram.
In order to be able to correctly establish the mathematical model of the PV cell and facilitate the later analysis, it is assumed that the current generated by the photoelectric effect will not change when the irradiance is at a stable value, i.e., it can be equated to an ideal current source with a current value of
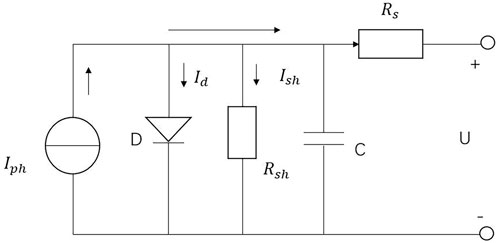
FIGURE 2. PV module equivalent circuit.
According to KCL:
Where,
The P-N junction voltage and current satisfy:
Where,
According to KVL:
Substituting Eqs. 2, 3 into (1):
Since the value of
Assume that in the open-circuit state,
At room temperature it can be considered that
According to the set open circuit condition, substituting into Eq. 6 can get:
Since
Since in practical use, the environmental factors cannot be determined as a constant value. Changes in the surrounding environment will have a certain impact on the work of PV cells, and to be closer to people’s daily working environment, certain corrections to the environmental factors are needed (Jiang et al., 2010). The correction scheme is as follows:
where,
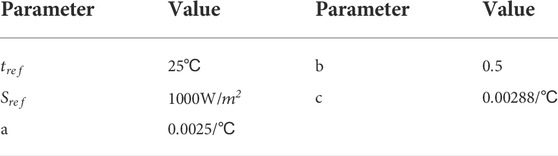
TABLE 1. PV module related parameters.
Based on the modified parameters, the PV model is constructed as shown in Figure 3. The parameters to be input are irradiance and temperature. The U-P characteristic curves and U-I characteristic curves at different temperatures are shown in Figure 4. From Figure 4A, it can be seen that there is a maximum value of voltage and the current growth in the PV output characteristic curves at different temperatures.
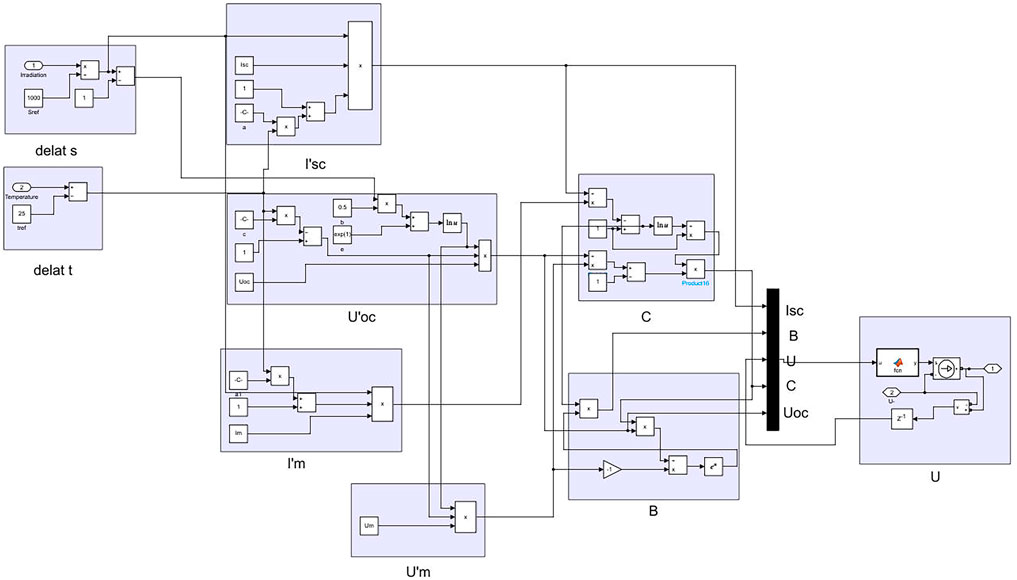
FIGURE 3. PV power generation system model.
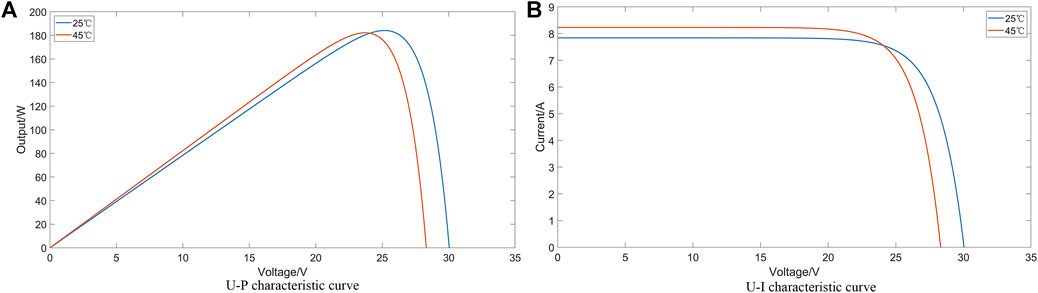
FIGURE 4. (A) U-P characteristic curve at 25°C and 45°C and (B) U-I characteristic curve at 25°C and 45°C.
The hydrogen production model of water electrolysis is regarded as a DC load. The higher the input current, the higher the hydrogen production rate (Mahrous et al., 2011). The U-I characteristic equation of the electrolytic cell is (Koundi and El Fadil, 2019):
where,
Among them, the electrolyzer hydrogen generation rate is:
Where,
The simulation model shown in Figure 5 is established according to the U-I characteristic equation of the electrolyzer described in Eq. 16. The hydrogen production rate model of its sub-module is established according to Eqs 17, 18, as shown in Figure 6. The parameters required in the modeling process are shown in Table 2. According to the built model of hydrogen production from water electrolysis, the U-I characteristic curve of the electrolytic cell at different temperatures is measured by simulation as shown in Figure 7. It can be seen from the figure that as the electrolysis temperature increases, the electrolysis voltage decreases.
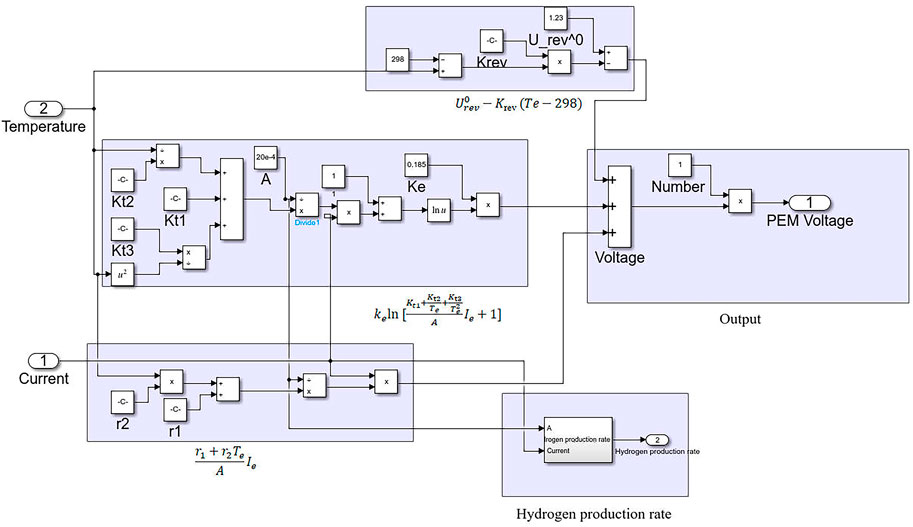
FIGURE 5. Electrolytic water to hydrogen model.
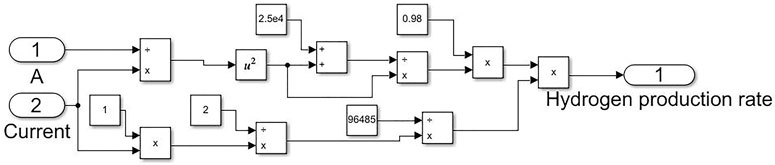
FIGURE 6. Hydrogen production rate model.
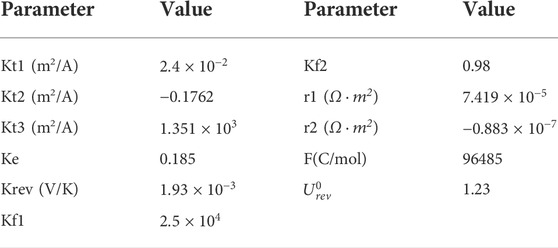
TABLE 2. Parameters related to hydrogen production from electrolytic water.
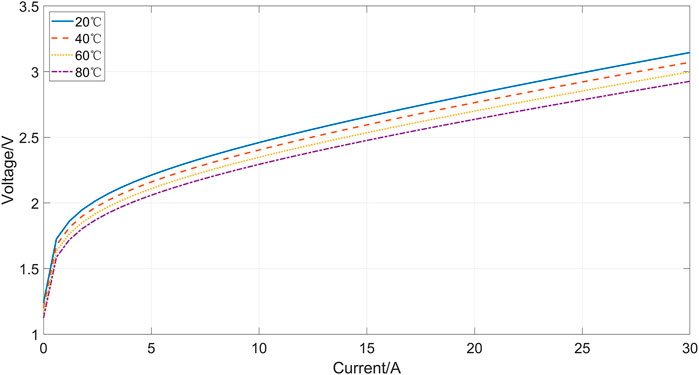
FIGURE 7. U-I characteristic curve of electrolytic cell at different temperatures.
The hydrogen storage model is an ideal pressure model. The hydrogen produced by the electrolyzer is fed into the hydrogen storage tank by the compressor doing work.
Where,
A model of the hydrogen storage tank as shown in Figure 8 is built according to the mathematical model described in Eq. 19.
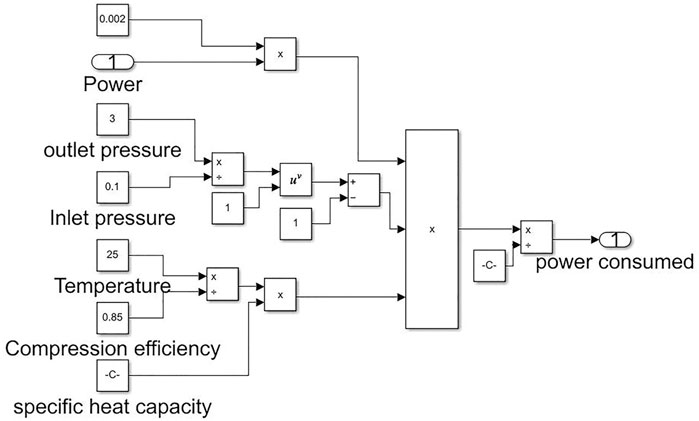
FIGURE 8. Hydrogen storage tank model.
The model of each component of the above system is encapsulated, and the overall model of the system after encapsulation is shown in Figure 9, with the main structure of the PV power module, PEM electrolytic water module, and hydrogen storage tank module.
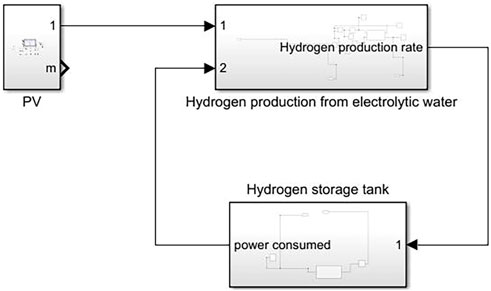
FIGURE 9. System overall structure model.
In the low pass filter circuit, the low-frequency signal is easier to pass than the high-frequency signal. Using this principle to remove the high-frequency signal in PV power generation can reduce the power variation rate of PV power generation, remove part of the burr on the power output curve, and smooth out the output power.
Mathematical model of low pass filter (Wang et al., 2018):
where,
In smoothing the PV power output fluctuation,
Solve for
The power absorbed by the energy storage system is:
From Eqs 22, 23, we can find out the grid-connected PV power
Before the PV power smoothing control, the frequency of the high-frequency component of the total PV power to be filtered, i.e., the cut-off frequency
At the end of k control cycles, the energy absorbed by the energy storage system is:
where,
The capacity
A clearer representation is shown in Figure 10.
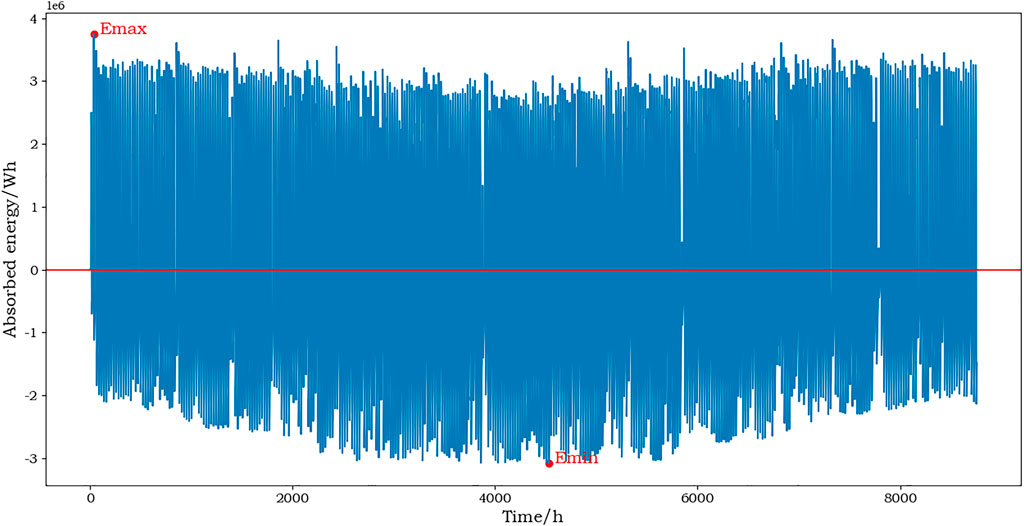
FIGURE 10. Schematic diagram of energy storage capacity calculation.
Chinese National Standard GB/T 19964-2012 ″Technical Provisions for Photovoltaic Power Plant Access to Electric Power System” gives the active power change rate of photovoltaic power plant not more than 10% of the installed capacity per minute. This is used as the target for filtering time constant optimization.
Define the rate of change of grid-connected power as
Where,

FIGURE 11. Flow chart of time constant optimization calculation.
The basic data of a PV plant used in the simulation example are shown in Table 3.
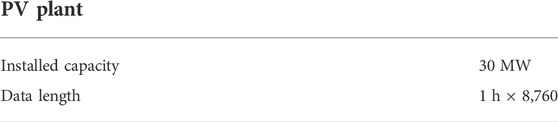
TABLE 3. Basic data of a PV plant.
The irradiance data of a certain place in a certain year are shown in Figure 12. It can be seen from the figure that the irradiation intensity is relatively high in summer and autumn, and the maximum irradiation intensity is 1108 W m−2 at 5,318 h. The figure shows the random, intermittent, and fluctuating characteristics of PV power generation, which must be smoothed to meet the demand of the power system, otherwise the phenomenon of light abandonment will occur, leading to energy waste.
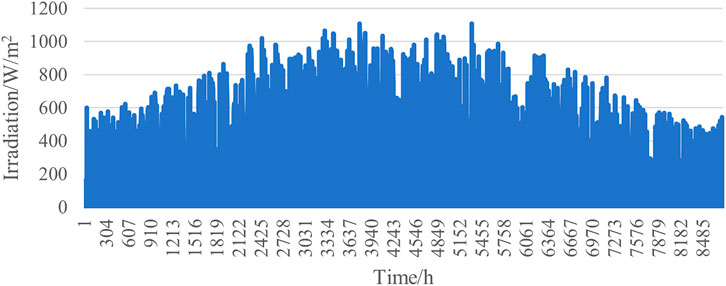
FIGURE 12. Irradiance of a site in a year.
A case simulation is conducted with 1 year of actual irradiation intensity data from a PV plant at a certain location to verify the effectiveness of the low-pass filtering strategy and to analyze the relationship between energy storage capacity and smoothing effect. The optimized code and images in this chapter are performed on Python.
Define the 1-h maximum power change rate as γ:
where
According to the simulation model constructed in Chapter 2, the 8760 h irradiance is used as the system input, and the photovoltaic power output curve before and after smoothing is shown in Figure 13, in which the two horizontal pictures are a group (e.g., Figures 13A,B), the picture on the left represents the overall effect map (e.g., Figure 13A), and the picture on the right represents the partially enlarged map (e.g., Figure 13B) in the period time of 3,800 h-4200 h. The four groups of pictures respectively represent the photovoltaic power output curves before and after the smoothing when the cut-off frequency
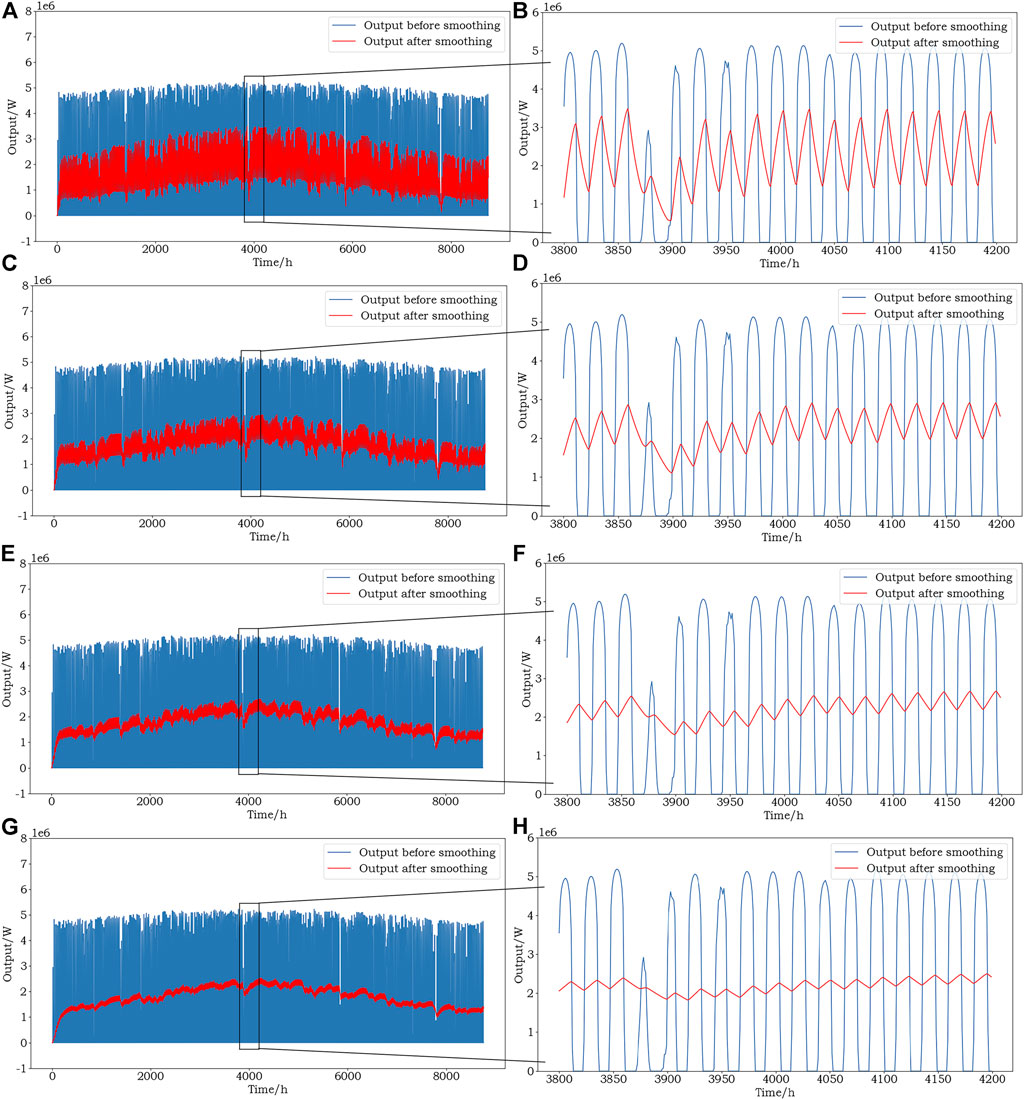
FIGURE 13. (A) shows the PV power output curve before and after smoothing at fc = 1/80 min, and (B) shows the partial enlargement. (C) shows the PV power output curve before and after smoothing at fc = 1/3 h, and (D) shows the partial enlargement. (E) shows the PV power output curve before and after smoothing at fc = 1/6 h, and (F) shows the partial enlargement. (G) shows the PV power output curve before and after smoothing at fc = 1/12 h, and (H) shows the partial enlargement.
When
In the four sets of test data, in Figures 13A,C,E,G, it can be clearly seen that the smoothed photovoltaic power generation power has obvious smoothing effect compared with the original data, and the corresponding local enlarged image (Figures 13B,D,F,H) can show this result more clearly.
From the analysis of the above simulation results, it can be seen that the proposed low-pass filtering-based PV power fluctuation smoothing control strategy can effectively smooth the PV power fluctuation according to the pre-set smoothing target, to achieve the desired smoothing effect.
The variation of PV power generation before and after smoothing is shown in Figure 14, where two pictures in the horizontal direction are a group (e.g., Figures 14A,B), the picture on the left side indicates the overall effect picture (e.g., Figure 14A), and the picture on the right side indicates the local enlarged picture in the time period of 3,800 h-4200 h (e.g., Figure 14B). The four sets of pictures indicate the amount of PV power change before and after smoothing at cutoff frequency
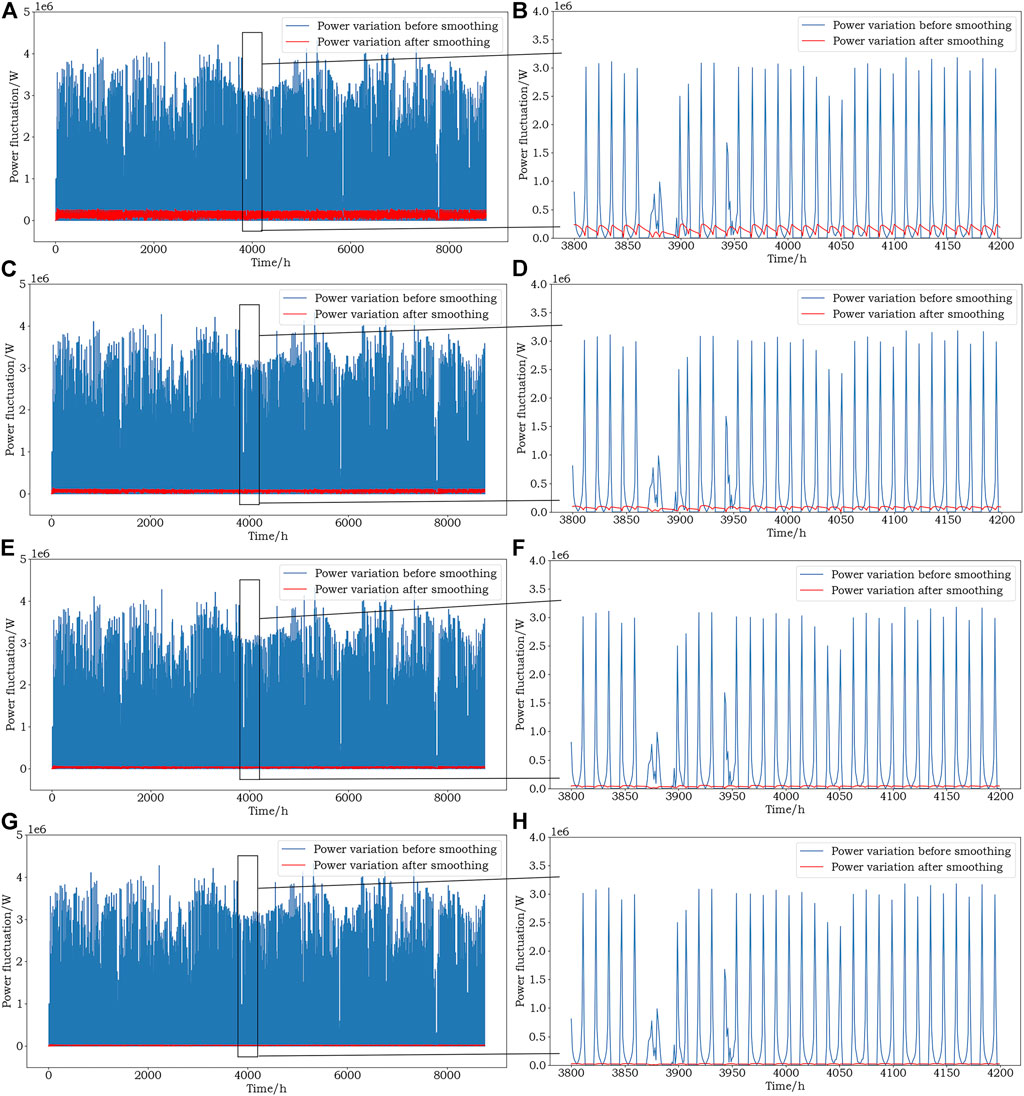
FIGURE 14. (A) shows the change in power generated by PV at fc = 1/80 min, (B) shows the partial enlargement. (C) shows the change in power generated by PV at fc = 1/3 h, (D) shows the partial enlargement. (E) shows the change in power generated by PV at fc = 1/6 h, (F) shows the partial enlargement. (G) shows the change in power generated by PV at fc = 1/12 h, (H) shows the partial enlargement.
From Figures 14A,C,E,G, it can be seen that the variation of photovoltaic power generation after different cut-off frequencies is also different, and the basic rule is that with the decrease of cut-off frequency, the change of photovoltaic power generation power reduce.
When the cut-off frequency
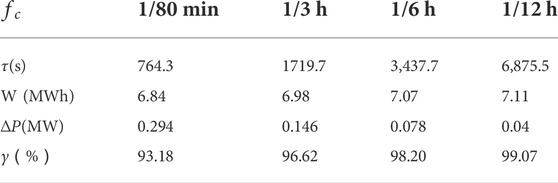
TABLE 4. Calculated results after smoothing.
It can be seen from Table 4 that as the cut-off frequency decreases, i.e., the time constant increases, the 1 h maximum power variation of PV power after smoothing gradually decreases, and the 1 h maximum power variation rate percentage increases continuously, while the required energy storage capacity also becomes larger and larger.
In this case, when
The maximum power variation of photovoltaic power generation in 1 h before smoothing is 4.31 MW. After the 4 sets of cut-off frequencies are smoothed, the maximum power variation of 1 h is reduced to 0.294, 0.146, 0.078 and 0.04 MW respectively. The corresponding energy storage capacities are 6.84 MWh, 6.98 MWh, 7.07 MWh and 7.11 MWh respectively (Table 4). It can be seen that with the increase of the value of the time constant, the smaller the rate of change of the power injected into the power system by photovoltaic power generation, the smoother the power output curve, and the better the effect of the energy storage system in smoothing the fluctuation of PV power, but the larger the energy storage capacity that needs to be installed, the higher the cost of energy storage. Therefore, the configuration of a reasonable energy storage system should comprehensively consider two factors, the stabilization effect and the cost.
In this paper, we propose a photovoltaic power generation-energy storage—hydrogen production system, model and simulate the system, propose an optimal allocation strategy for energy storage capacity based on the low-pass filtering principle, and finally use the one-year light intensity data of a certain place for arithmetic simulation. Some key conclusions can be summarized as follows.
1) The capacity configuration of the energy storage system in the system is analyzed, the low-pass filtering principle is used to smooth the PV power output curve, the energy storage capacity algorithm to meet the energy demand of the smoothing process is proposed, and finally the energy storage capacity and the smoothing effect at different time constants are analyzed.
2) The low pass filtering principle is used to smooth the output curve of photovoltaic power generation, and the difference between the maximum and minimum energy shortages before and after smoothing is used as the capacity of the energy storage system. The time constant is optimized and selected, the selection standard is that the rate of change of the active power of the photovoltaic power station does not exceed 10% of the installed capacity per minute, the calculation results show that when the time constant is greater than 750 s, this standard is satisfied. Define the maximum power change rate γ in 1 h, the larger the γ value, the better the smoothing effect.
3) According to the analysis results of the example, as the cutoff frequency decreases, the time constant increases gradually, the energy storage capacity and the corresponding γ value also increase, and the smoothing effect is more obvious. For example, when the cutoff frequency is 1/80 min, the corresponding time constant is 764.3 s, the energy storage capacity is 6.84 MWh, and the γ value is 93.18%; when the cutoff frequency is 1/12 h, the corresponding time constant is 6,875.5 s, and the energy storage capacity is 6,875.5 s, the capacity is 7.11 MWh, and the γ value is 99.07%.
4) This paper mainly provides an energy storage capacity allocation method, but does not make an accurate calculation of the energy storage system capacity. In the next step, according to this method, the system economy, the loss of power supply probability (LPSP) will be comprehensively considered to accurately calculate the capacity of the energy storage system.
The data that support the findings of this study are available from the corresponding author upon reasonable request.
DW: supervision, conceptualization, writing—review and editing. HL: methodology, writing—original draft, simulination. YR: visualization, formal analysis, writing—original draft. XY: overall revision of the paper. LW: data curation, validation, software. KJ: investigation, resources, simulination.
The authors acknowledge financial support from the Henan Province Key R & D and Promotion Project (Science and Technology Research) (Grant No. 212102311054), the Training Program for Young Key Teachers in Colleges and Universities of Henan Province (Grant No. 2019GGJS097), the Key Scientific Research Projects of Colleges and Universities in Henan Province (Grant No. 17A480006) and Zhengzhou Science and Technology Collaborative Innovation Special Project, Research on Water System Connectivity in Realizing Rural Revitalization Strategy in Water Resources (Approval No. 19).
Author LW was employed by Power China Northwest Engineering Corporation Limited.
The remaining authors declare that the research was conducted in the absence of any commercial or financial relationships that could be construed as a potential conflict of interest.
All claims expressed in this article are solely those of the authors and do not necessarily represent those of their affiliated organizations, or those of the publisher, the editors and the reviewers. Any product that may be evaluated in this article, or claim that may be made by its manufacturer, is not guaranteed or endorsed by the publisher.
An, Y., Zhao, Z., Wang, S., Huang, Q., and Xie, X. (2019). Coordinative optimization of hydro-photovoltaic-wind-battery complementary power stations. CSEE J. Power Energy Syst. 6 (2), 410–418.
Aouali, F. Z., Becherif, M., Tabanjat, A., Emziane, M., Mohammedi, K., Krehi, S., et al. (2014). Modelling and experimental analysis of a PEM electrolyser powered by a solar photovoltaic panel. Energy procedia. 62, 714–722. doi:10.1016/j.egypro.2014.12.435
Awasthi, A., Scott, K., and Basu, S. (2011). Dynamic modeling and simulation of a proton exchange membrane electrolyzer for hydrogen production. Int. J. hydrogen energy 36 (22), 14779–14786. doi:10.1016/j.ijhydene.2011.03.045
Bocklisch, T. (2015). Hybrid energy storage systems for renewable energy applications. Energy Procedia 73, 103–111. doi:10.1016/j.egypro.2015.07.582
Castaneda, M., Cano, A., Jurado, F., Sánchez, H., and Fernández, L. M. (2013). Sizing optimization, dynamic modeling and energy management strategies of a stand-alone PV/hydrogen/battery-based hybrid system. Int. J. hydrogen energy 38 (10), 3830–3845. doi:10.1016/j.ijhydene.2013.01.080
Chandel, T. A., Yasin, M. Y., and Mallick, M. A. (2019). Modeling and simulation of photovoltaic cell using single diode solar cell and double diode solar cell model. Int. J. Innov. Technol. Explor. Eng.(IJITEE) 8 (10).
Chao, L., and Tao, L. (2021). Key technologies and development status of hydrogen energy utilization under the background of carbon neutrality. Power Gener. Technol. 42 (2), 207.
Clarke, R., Giddey, S., Ciacchi, F., Badwal, S., Paul, B., and Andrews, J. (2009). Direct coupling of an electrolyser to a solar PV system for generating hydrogen. Int. J. hydrogen energy 34 (6), 2531–2542. doi:10.1016/j.ijhydene.2009.01.053
Dey, B. K., Khan, I., Mandal, N., and Bhattacharjee, A. (2016). “Mathematical modelling and characteristic analysis of Solar PV Cell,” in 2016 IEEE 7th annual information Technology, electronics and mobile communication conference (IEMCON) (IEEE), 1–5.
Du, Y., Song, B., Duan, H., Tsvetanov, T. G., and Wu, Y. (2019). Multi-renewable management: Interactions between wind and solar within uncertain technology ecological system. Energy Convers. Manag. 187, 232–247. doi:10.1016/j.enconman.2019.01.032
Dufo-Lopez, R., and Bernal-Agustín, J. L. (2008). Multi-objective design of PV–wind–diesel–hydrogen–battery systems. Renew. energy 33 (12), 2559–2572. doi:10.1016/j.renene.2008.02.027
Hou, H., Xu, T., Wu, X., Wang, H., Tang, A., and Chen, Y. (2020). Optimal capacity configuration of the wind-photovoltaic-storage hybrid power system based on gravity energy storage system. Appl. energy 271, 115052. doi:10.1016/j.apenergy.2020.115052
Jiang, Y., Qahouq, J. A. A., and Batarseh, I. (2010). “Improved solar PV cell Matlab simulation model and comparison,” in 2010 IEEE international symposium on circuits and systems (ISCAS) (IEEE), 2770–2773.
Jurasz, J., Dąbek, P. B., Kaźmierczak, B., Kies, A., and Wdowikowski, M. (2018). Large scale complementary solar and wind energy sources coupled with pumped-storage hydroelectricity for Lower Silesia (Poland). Energy 161, 183–192. doi:10.1016/j.energy.2018.07.085
Khalilnejad, A., and Riahy, G. (2014). A hybrid wind-PV system performance investigation for the purpose of maximum hydrogen production and storage using advanced alkaline electrolyzer. Energy Convers. Manag. 80, 398–406. doi:10.1016/j.enconman.2014.01.040
Koundi, M., and El Fadil, H. (2019). “Mathematical modeling of PEM electrolyzer and design of a voltage controller by the SMPWM approach,” in 2019 international conference on power generation systems and renewable energy technologies (PGSRET) (IEEE), 1–6.
Li, J., Chen, S., Wu, Y., Wang, Q., Liu, X., Qi, L., et al. (2021). How to make better use of intermittent and variable energy? A review of wind and photovoltaic power consumption in China. Renew. Sustain. Energy Rev. 137, 110626. doi:10.1016/j.rser.2020.110626
Li, X., Zhou, Q., Qiu, Y., and Hou, Y. (2019). “Capacity configuration method of hybrid energy storage system for stand-alone photovoltaic generation system,” in 2019 IEEE 3rd advanced information management, communicates, electronic and automation control conference (IMCEC) (IEEE), 1704–1709.
Liu, Z., Deng, Z., He, G., Wang, H., Zhang, X., Lin, J., et al. (2022). Challenges and opportunities for carbon neutrality in China. Nat. Rev. Earth Environ. 3 (2), 141–155. doi:10.1038/s43017-021-00244-x
Liu, Z., Zhang, Z., Zhuo, R., and Wang, X. (2019). Optimal operation of independent regional power grid with multiple wind-solar-hydro-battery power. Appl. energy 235, 1541–1550. doi:10.1016/j.apenergy.2018.11.072
Mahrous, A., Sakr, I., Balabel, A., and Ibrahim, K. (2011). Experimental investigation of the operating parameters affecting hydrogen production process through alkaline water electrolysis. Int. J. Therm. Environ. Eng. 2 (2), 113–116. doi:10.5383/ijtee.02.02.009
Park, M., Lee, D.-H., and Yu, I.-K. (2006). PSCAD/EMTDC modeling and simulation of solar-powered hydrogen production system. Renew. energy 31 (14), 2342–2355. doi:10.1016/j.renene.2005.12.001
Ren, Y., Yao, X., Liu, D., Qiao, R., Zhang, L., Zhang, K., et al. (2022). Optimal design of hydro-wind-PV multi-energy complementary systems considering smooth power output. Sustain. Energy Technol. Assessments 50, 101832. doi:10.1016/j.seta.2021.101832
Schnuelle, C., Wassermann, T., Fuhrlaender, D., and Zondervan, E. (2020). Dynamic hydrogen production from PV & wind direct electricity supply–Modeling and techno-economic assessment. Int. J. Hydrogen Energy 45 (55), 29938–29952. doi:10.1016/j.ijhydene.2020.08.044
Sopian, K., Ibrahim, M. Z., Daud, W. R. W., Othman, M. Y., Yatim, B., and Amin, N. (2009). Performance of a PV–wind hybrid system for hydrogen production. Renew. Energy 34 (8), 1973–1978. doi:10.1016/j.renene.2008.12.010
Ulleberg, Ø. (2004). The importance of control strategies in PV–hydrogen systems. Sol. Energy 76 (1-3), 323–329. doi:10.1016/j.solener.2003.09.013
Wang, H., Wang, T., Xie, X., Ling, Z., Gao, G., and Dong, X. (2018). Optimal capacity configuration of a hybrid energy storage system for an isolated microgrid using quantum-behaved particle swarm optimization. Energies 11 (2), 454. doi:10.3390/en11020454
Wang, X., Mei, Y., Kong, Y., Lin, Y., and Wang, H. (2017). Improved multi-objective model and analysis of the coordinated operation of a hydro-wind-photovoltaic system. Energy 134, 813–839. doi:10.1016/j.energy.2017.06.047
Wu, T., Shi, X., Liao, L., Zhou, C., Zhou, H., and Su, Y. (2019). A capacity configuration control strategy to alleviate power fluctuation of hybrid energy storage system based on improved particle swarm optimization. Energies 12 (4), 642. doi:10.3390/en12040642
Xiao, P., Hu, W., Xu, X., Liu, W., Huang, Q., and Chen, Z. (2020). Optimal operation of a wind-electrolytic hydrogen storage system in the electricity/hydrogen markets. Int. J. Hydrogen Energy 45 (46), 24412–24423. doi:10.1016/j.ijhydene.2020.06.302
Yin, X., Cheng, L., Wang, X., Lu, J., and Qin, H. (2019). Optimization for hydro-photovoltaic-wind power generation system based on modified version of multi-objective whale optimization algorithm. Energy Procedia 158, 6208–6216. doi:10.1016/j.egypro.2019.01.480
Zhu, H., Shi, L., and Wu, F. (2020). “Optimal allocation of energy storage capacity for stabilizing wind power fluctuation,” in 2020 12th IEEE PES asia-pacific power and energy engineering conference (APPEEC) (IEEE), 1–5.
PV photovoltaic
LPSP loss of power supply probability
DC direct current
Parameters
diode, A
K Boltzmann constant, J K−1
conditions, W m−2
electrolyzer surface area m2
storage system, W
System, Wh
storage system, Wh
System, Wh
power
rate
power before smoothing, W
Keywords: PV, hydrogen, simulination, lowpass filter, time constant optimization
Citation: Wei D, Li H, Ren Y, Yao X, Wang L and Jin K (2022) Modeling of hydrogen production system for photovoltaic power generation and capacity optimization of energy storage system. Front. Energy Res. 10:1004277. doi: 10.3389/fenrg.2022.1004277
Received: 27 July 2022; Accepted: 22 August 2022;
Published: 21 September 2022.
Edited by:
Siamak Hoseinzadeh, Sapienza University of Rome, ItalyReviewed by:
Abolfazl Ahmadi,Copyright © 2022 Wei, Li, Ren, Yao, Wang and Jin. This is an open-access article distributed under the terms of the Creative Commons Attribution License (CC BY). The use, distribution or reproduction in other forums is permitted, provided the original author(s) and the copyright owner(s) are credited and that the original publication in this journal is cited, in accordance with accepted academic practice. No use, distribution or reproduction is permitted which does not comply with these terms.
*Correspondence: Daohong Wei, aHNzZ2psQDE2My5jb20=; Yan Ren, cmVueWFuQG5jd3UuZWR1LmNu
Disclaimer: All claims expressed in this article are solely those of the authors and do not necessarily represent those of their affiliated organizations, or those of the publisher, the editors and the reviewers. Any product that may be evaluated in this article or claim that may be made by its manufacturer is not guaranteed or endorsed by the publisher.
Research integrity at Frontiers
Learn more about the work of our research integrity team to safeguard the quality of each article we publish.