 Shijie Yang1
 Ruofu Xiao
 Ran Tao
- 1College of Water Resources and Civil Engineering, China Agricultural University, Beijing, China
- 2Beijing Engineering Research Center of Safety and Energy Saving Technology for Water Supply Network System, Beijing, China
- 3College of Engineering, China Agricultural University, Beijing, China
- 4Dongfang Electric Machinery Co, Ltd, Deyang, China
Large vaned-voluted centrifugal pump is a general machine used for large-scale water diversion. As a vane-type hydraulic machinery, it also has the ability of reversible operation. With the introduction of policies to reduce carbon emissions, the proportion of unstable new energy use has increased. The existing large centrifugal pump unit can realize the function of reverse power transfer. For peak shaving and valley filling of power grid, it has high feasibility and economy. In this paper, a large vaned-voluted centrifugal pump is simulated numerically, it is external characteristics and flow state under positive and negative rotation are obtained, its performance is predicted by best efficiency point method, and it is found that pump reversal can run at the optimum efficiency point with higher flow rate and head. Error analysis is carried out for different formulas. The flow energy dissipation (FED) of different flow rates under positive and negative rotation is analyzed. It is found that the main energy loss locates on suction side of blade, inlet and outlet part of blade and tail part of guide blade head. By comparing the flow energy dissipation distribution under the same flow conditions with positive and reverse rotation, it is found that the high energy loss area of blade mainly exists in inlet and outlet part of blade in pump mode. The high energy loss area of the blades in turbine mode mainly exists in the inlet part of the blades. This study is of great significance to the operation of low-carbon power grid assisted by existing reservoirs and hydraulic machinery.
Introduction
Although the world’s electricity output has increased significantly, most developing countries still lack power supply and other forms of renewable and clean energy. According to the data of the International Energy Agency (IEA), 1.4 billion people in the world do not have electricity. Sub-Saharan is the most affected region, but the region has a variety of renewable and clean energy sources that can produce various forms of energy, such as hydropower (Kaunda, et al., 2014; Deambi, 2011). With the rapid consumption of fossil fuels and environmental pollution in the past few years, many utilities have changed their power generation sources to renewable energy (Saxena, 2006). The intensive development of large clean and renewable energy bases such as wind, nuclear, solar and hydropower in China, as well as the intelligent construction of the national grid, require the construction of a large number of power stations to regulate the grid. Energy conservation and emission reduction in all links of the life cycle of water conservancy projects are particularly important. In clean energy, wind energy covers a large area, is unstable and uncontrollable, and the power generation efficiency is affected by the season; However, the time limit of light energy is very serious, the flexibility is not enough, and the risk of nuclear energy is high. Therefore, choosing hydropower for power supply and storage is a very good choice to replace fossil fuels (Budris, 2009). In order to realize the feedback of the energy network and reduce the equipment cost, the pump can be used as a turbine (PAT) for power generation. Now in rural power supply, there are Micro Hydropower Plants (MHP) based on pumps as turbines, which are well used in micro hydropower schemes (Paish, et al., 2002; Jain and.Singal, 2009).
In addition, compared with the direct use of hydraulic turbines, the pump reverse turbine has the following advantages: First, it has a wide range of industrial applications. And the design, production and manufacturing of pumps of various sizes are quite mature, which can effectively balance the hydraulic performance and economic cost (Williams A, 1996; Motwani, et al., 2013); Second, the pump is small in size and simple in structure. As a turbine, the pump has no regulating mechanism, and its flow regulation is mainly achieved by setting regulating valves in the inlet and outlet pipelines. Therefore, it has the advantages of small volume, convenient regulation, easy installation, easy operation and easy maintenance; Third, compared with hydraulic turbines, there are more types of pumps, and the range of flow and head during operation is wider. Moreover, the investment cost of traditional hydraulic turbines is relatively high, and the investment payback period can even be as long as 15 years. For the same capacity, the investment payback period of PAT can be shortened to 2 years (Ranjitka, et al., 2006), but the counterpart is that they are subject to a strongly variable discharge, with a possible significant global efficiency reduction. If the turbine is inside aqueducts, there is also the need to maintain the original head jump (Sinagra, et al., 2017; Sammartano, et al., 2017). On the basis of sufficient power resources, the use of pump reversal as a turbine can also play the role of peak load regulation and frequency regulation to cope with the instability of the power grid system. Since the device is not always in operation, the effect of reduced efficiency is not obvious.
There have been a lot of theoretical, experimental and numerical studies on the reverse rotation of pump as a hydraulic turbine. PAT’s early investigation attempt began in the 1930s and has attracted much attention in recent decades. Raman’s (2013) experimental research has proved that compared with the pump mode, the pump operation under the hydraulic turbine mode requires higher lift and flow. However, the centrifugal pump can operate well as a hydraulic turbine without any mechanical problems. Agostinelli and Shafer (2013) have tested many pumps in water wheel mode for many years, and concluded that when the pump operates in water wheel mode, its mechanical operation is stable and quiet; It is peak efficiency is the same as the pump mode; The head and flow at the best efficiency point are higher than the pump mode, and the power output is higher than the pump input power at the best efficiency. Orchard and Klos (2009) provided information about the application and advantages of pumps as turbines. The application of PAT in the water industry was discussed in detail.
However, there are also some problems with large pumps as turbines: the reverse rotation of the pump as a turbine is not considered in the manufacture of the pump, and the manufacturer usually does not provide the performance of the pump under the turbine working condition when leaving the factory. When the energy parameters (flow, head) are given, Therefore, accurately predicting the performance of water pumps in turbine mode is the most important and difficult problem. Early attempts to predict PAT performance using BEP are based on two assumptions: 1) the best efficiency in turbine mode is approximately equal to the best efficiency in pump mode; 2) The turbine output power is the same as the pump input power (Williams, 1994). Another assumption is that the flow ratio of turbine and pump is equal to the head ratio of turbine and pump. Childs (1962) obtained the relationship between flow and head in turbine and pump mode. Huang et al. (2017) adopts the rotor volute matching principle to consider the influence of flow. Yang et al. (2012) Carried out PAT performance prediction research, adopted three methods: theoretical, numerical and experimental methods, proposed a theoretical prediction method based on pump mode, and compared it with other theoretical, numerical and experimental methods. In recent years, a performance prediction method based on model loss has been introduced, which has achieved success in pump (Derakhshan and Nourbakhsh, 2008; Liu, et al., 2019). There is another method based on polynomial fitting to calculate the performance under full flow (Fecarotta, et al., 2016; Jain, et al., 2015). Among them, BEP and model loss methods are based on theoretical analysis, which requires basic pump geometry knowledge. While using specific speed method and polynomial fitting method requires statistical fitting, which requires sufficient data as samples.
At the same time, another concern of the reverse pump turbine is its flow analysis and efficiency improvement optimization. Rodrigues et al. (2003) Compared the numerical results of the centrifugal pump with a specific speed of 24.5, partitioned the flow state inside PAT, and modified it to optimize the hydraulic performance of PAT. Rawal and Kshirsagar (2007) conducted numerical simulation of PAT to determine the losses in different components. It was found that the losses in the impeller were relatively small compared with those in the shell in the pump mode; However, in the case of PAT, it is found that the loss distribution is opposite, that is, the loss in the shell is less than that in the impeller. Fernandez et al. (2010) used sliding grid technology to conduct unsteady CFD analysis of centrifugal pump PAT to consider the influence of blade tongue interaction on local flow. A tangential velocity component was observed at the impeller outlet, which caused the fluid to rotate in the direction of impeller rotation at low flow rate and in the opposite direction at high flow rate. Barrio et al. (2011) used fluent to analyze the internal flow of the centrifugal pump, which is equipped with seven twisted reverse blades in pump and turbine mode. In turbine mode, internal recirculation in the impeller is observed under non rated flow, and a large area of reflux is found in the impeller channel. Sedlar et al. (2009) carried out numerical analysis on the intermediate stage of radial multistage PAT and found that there was no large separation of flow under design conditions; However, under off design conditions, it is very important to find the highly curved part of the stator channel and the guide vane rotor blade interaction region. Nowadays, in pump mode and turbine mode, the current pump turbine has high efficiency (higher than 90%) at the design point or rated conditions, and the flow pattern is also very smooth, which means that the loss reduction based on flow pattern analysis is no longer effective, the second law of thermodynamics (SLT) is of great significance for finding irreversible energy conversion. Many studies have applied SLT based on computational fluid dynamics (CFD) to the flow of turbomachinery. For reversible pump turbines, especially under the high-efficiency conditions of frequent operation, SLT can be used to track, visualize and eliminate FED (Jia and Liu, 2014; Zeinalpour and Mazaheri, 2015; Kluxen, et al., 2016). Among them, entropy production rate is one of the effective methods for FED quantitative analysis. Yu et al. used entropy generation method to visualize the energy transfer of the simulation results 108 of Francis turbine at different flow velocities (Yu, et al., 2021; Yu, et al., 2022). Gong et al. (2013) Studied the energy characteristics of hydraulic turbines by using entropy generation theory, and pointed out the locations of high hydraulic losses of different components (Gong, et al., 2013). Feng et al. And Zhao et al. Analyzed the FED under relatively low-speed flow. Effectively predicted and visualized the flow energy loss mode and high FED position (Zhao, et al., 2019; Feng, et al., 2020).
Many scholars have carried out theoretical, experimental and Numerical Research on PAT selection calculation, optimization design, stability control, force characteristics, loss distribution and cavitation. Nowadays, the difficulty of PAT is to find the turbine characteristics of the pump and select the proper pump for a specific location. In addition, most of the research on reverse-running pump is carried out on the basis of numerical simulation. It is difficult to test the reverse-running pump in actual test. In the future, how to find a simpler, faster and more applicable prediction method for reverse operation characteristics is the primary task. In terms of PAT performance optimization improvement, different researchers have found that modification of impeller blade rounded corners is the most promising. In addition, the structure of the unit can be improved, such as setting vanes at draft tube bends to improve partial load performance and to expand the application range. In summary, the future work of PAT will focus on pump selection, impeller modification, draft tube modification, cavitation analysis, water hammer research, etc.
The research object of this paper is the large vaned-voluted centrifugal pump. The volute layout can save space, its volute can drain and reduce the flow circulation, and the guide vane can also play a certain role in draining, reducing the reflux and improving the efficiency. But more importantly, the guide vane can support the overall unit structure and ensure the strength and reduce the radial force. After the performance of the model machine is converted by the accurate similar theory, the reliable operation characteristics of the real machine size unit can be obtained. On the basis of theoretical and experimental research, the existing large centrifugal pump units can be reversed to realize peak regulation and valley filling of power grid, and achieve carbon peak and carbon neutralization target better and faster. Therefore, using the existing large-scale centrifugal pump as a water turbine for power generation is also a topic worthy of study.
In this paper, the external characteristic curve and internal flow state of positive and negative rotation of large vaned-voluted centrifugal pump are obtained, and the external characteristic of pump operating condition is compared with the test data. In consideration of the difficulty of the reverse test, the data of the reverse operation of the pump obtained by accurate simulation is taken as the standard data. Error analysis and comparison of several performance prediction formulas are carried out, and the formulas with better universality and higher accuracy are summarized. The main energy loss parts under positive and negative rotation are obtained, and the causes are analyzed.
Research object and calculation model
Research object
The research object is a large vaned-voluted centrifugal pump model. The real size of the pump is 3.75 times that of the model machine. The number of blades of the pump is nine and the number of guide vanes is 12. The inlet diameter of the model machine is 0.28 m, the outlet diameter is 0.56 m, the rated speed is 1,000 r/min, and the design flow of the model machine is 0.247 kg/s. The optimal flow measured by the model machine test is Q = 0.237 kg/s, the head is H = 47.33 m, and the efficiency is η = 90.1%. The structural diagram of the large vaned-voluted centrifugal pump is shown in Figure 1.
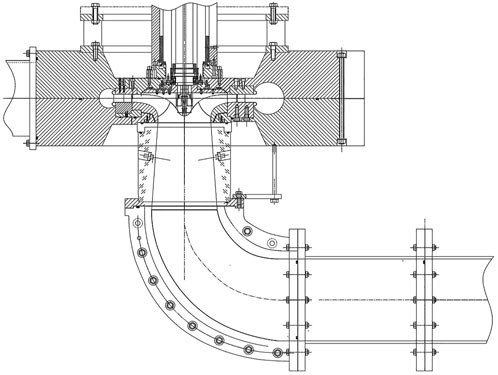
FIGURE 1. Structural drawing of large vaned-voluted centrifugal pump.
Experimental device
The Schematic map of the test rig is shown in the Figure 2, and its main parameters are shown in Table 1. Test Instrument parameters are shown in Table 2. The test site is shown in the Figure 3. PXI bus system is used for data acquisition and testing. The measurement of various parameters of the test is carried out with corresponding sensors, which are connected to the computer-controlled interface, a computer-centered data acquisition and processing system is formed. The water head is the total pressure difference between the inlet and outlet sections of the model, in which the static pressure difference (static head) of the inlet and outlet sections is measured by differential pressure sensor. The dynamic head part is calculated by the test flow and the area of the inlet and outlet pressure measurement section. The flow measurement and calibration adopts the electromagnetic flowmeter to measure the flow, the inner diameter of the flowmeter is 300 mm, and the output signal is the frequency signal, it can measure the flow in both positive and negative directions. The electromagnetic flowmeter is calibrated in situ by volume method with a correction pool. The main torque measurement is carried out by dynamometer motor and load sensor. The load sensor is calibrated in situ with electric weighting device and standard weight. Each standard weight is 20 kg, and the weight is verified every year. The rotation speed is measured by connecting the encoder with the generator shaft. The encoder is directly installed at the shaft end of the dynamometer motor, and 1,024 pulses are output per revolution. The rotation speed can be measured by pulse counting. Install the sensor at the working position, adjust the rotation speed of the unit to be stable, calibrate it by comparing the measured rotation speed frequency with a verified high-precision frequency meter, or check the rotation speed with a stroboscope. Energy test was carried out to determine the relationship between head H (m), shaft power p (kw), efficiency η and flow Q (m3/s) under positive rotating condition. Under the pump working condition, the system resistance is changed by changing the regulating valve in the high-pressure side pipeline system at a constant speed, so as to adjust the over-flow of the unit to form different test working condition points. Data collection is carried out when the operating condition is stable. The real machine operates under the condition of 1,480 r/min. According to the unit operation requirements, this test adopts the constant speed test method, and the test speed is n = 1,000 r/min. During the test, rotation speed fluctuation Δn≤±0.2%∘
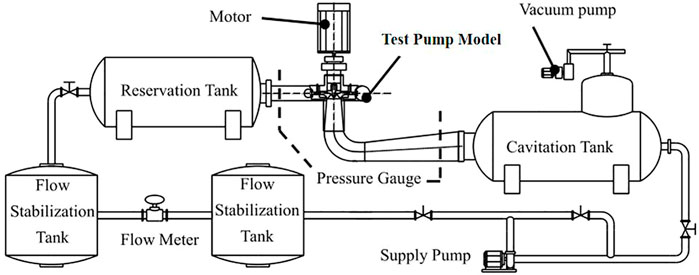
FIGURE 2. Schematic map of the test rig.
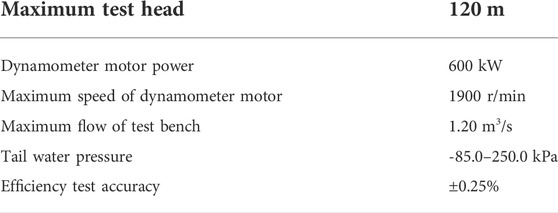
TABLE 1. Main parameters of the test bench.
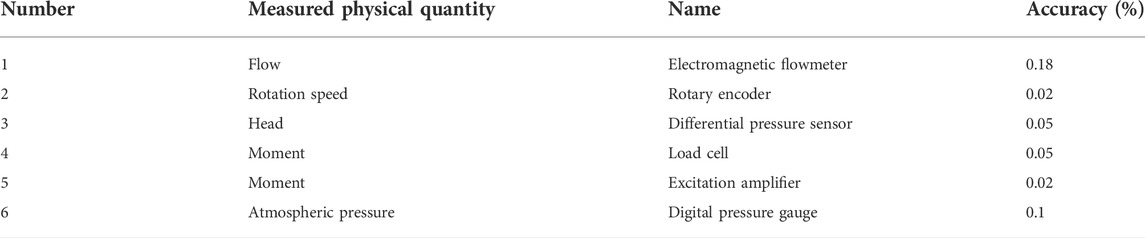
TABLE 2. Test instrument parameters.
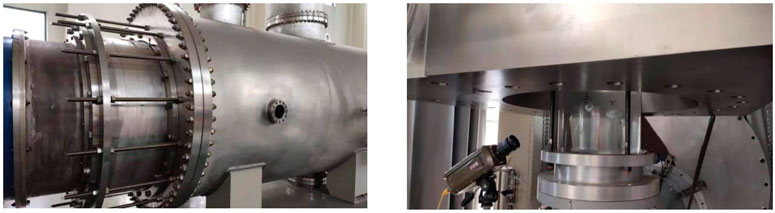
FIGURE 3. Experimental device.
The main parameters to be measured during the energy test include lift, flow, speed, shaft power, etc. the measurement method of each parameter is measured according to the parameter measurement method of Hydraulic Machinery General test bench, and calculated according to the following formula:
1) Pump head H
where Δp is the static pressure difference between the pressure measuring sections at the inlet and outlet of the pump is measured by the differential pressure sensor (Pa), Vd is the average velocity of outlet pressure measurement section (m/s), Vd =Q/Ad (Q is the test flow, m3/s), Vs is the average velocity of inlet pressure measurement section (m/s), Vs =Q/As, ρ is test water density (kg/m3), g is Gravitational acceleration (m/s2).
2) Power transmitted by pump to liquid Pu
where Q is the test flow m3/s, H is Test net head(m), ρ is test water density (kg/m3), g is Gravity acceleration of test bench.
3) Pump shaft power Pa
where M is torque on pump shaft (Nm), n is test speed (r/min).
4) Pump efficiency ηP
Numerical simulation settings
The numerical calculation fluid domain includes the inlet section (draft tube), rotating impeller, fixed guide vane and water pressure chamber (annular volute). The overall structure and grid division of the pump are shown in Figure 4.
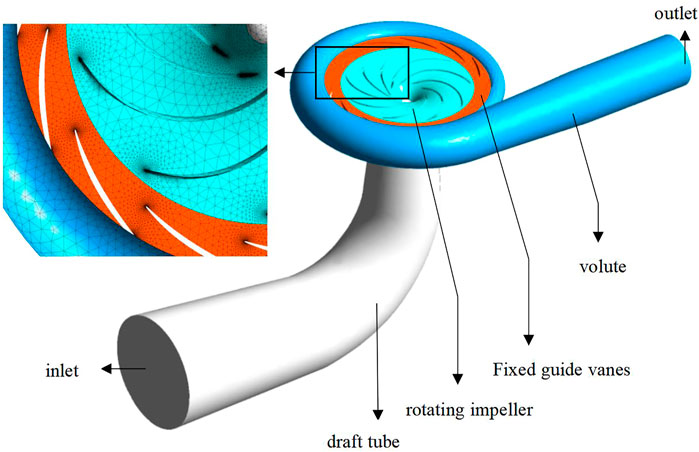
FIGURE 4. Pump calculation domain.
The turbulence model adopts SST k-ω Turbulence Model (Menter, 1994; Menter, et al., 2003) for steady simulation. The number of iteration steps is 2000. Each solid wall is treated as a no slip wall. The interface is connected by GGI, and the reference pressure is set to 101.325 kPa. The fluid medium is liquid water at 25°C at room temperature, regardless of heat transfer. In the pump mode, the draft tube is set as the mass flow inlet, the turbulence intensity at the inlet boundary is 5%, the volute is set as the outlet, and the outlet boundary condition adopts the average static pressure outlet, the relative pressure is 0 Pa. The convergence standard is that the root mean square residuals of continuity equation and momentum equation are less than 1.0 × 10⁻⁵. The overall grid is hexahedral grid. The GCI criterion based on Richardson extrapolation is used to check the convergence of the grid, as shown in the Table 3. On the premise of ensuring grid independence, considering the complicated internal flow state of impeller and guide vane, in order to obtain more accurate calculation results, there are many grids of impeller and guide vane, with the number of grids of impeller being 4.03 million and that of guide vane being 3.37 million. However, the volute and the inlet have little influence on the internal flow state, so there are fewer grids. The number of grids in the volute is 160,000, and the number of grids in the inlet is 70,000, which can save some resources in the calculation without affecting the accuracy of the results. The final total number of grids is 7.63 million. The grid data of each part are shown in the following Table 4:

TABLE 3. Grid independence check.
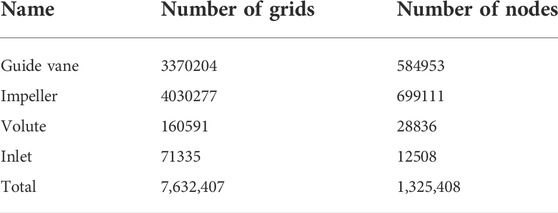
TABLE 4. Number of grids per section.
Analysis of performance characteristics of positive and reverse inversions
Performance characteristic curve
Using the above model for numerical calculation, the inlet and outlet/rotation direction under reverse rotation is opposite to that under forward rotation, and finally the external characteristic curve under forward and reverse rotation of the pump is obtained, as shown in Figure 5. At the same time, the external characteristics under forward rotation are compared with the test data. The analysis shows that under the optimal flow condition, the simulation value of the model pump mode head is 47.42 m, the test head is 47.33 m, and the relative error is 0.19%; The simulated efficiency is 92.00%, the experimental efficiency is 90.10%, and the relative error is 2.11%; The power simulation value is 119.71 kW, the test power is 121.58 kW, and the relative error is 1.54%. The relative error between the numerical simulation and the test results is not more than 5%, which proves that the calculation method used in this paper can accurately simulate the internal flow, and can effectively ensure the reliability of the analysis.
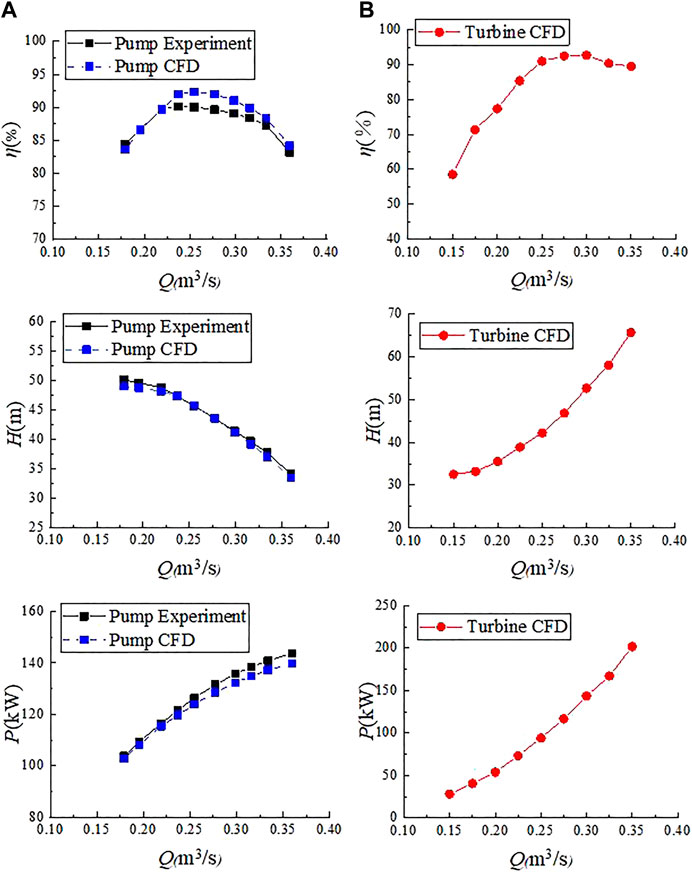
FIGURE 5. Performance characteristic curve Pump (A)/Turbine (B).
From the flow-efficiency diagram, we can see that the efficiency in the pump mode increases first and then decreases with the increase of flow, and there is a high-efficiency area in the direction of 0.95–1.15 times the design flow. In the turbine mode, the efficiency change law is roughly the same as that in the pump mode, but it can be clearly seen that the position of the high-efficiency area moves towards the direction of large flow by about 0.3 optimal flow, QbT≈1.3QbP. Comparing the two states of forward and reverse rotation, it can be seen that the maximum efficiency under the turbine mode is about 2–3% higher than that under the pump mode. In addition, it can be found that the head with the best efficiency under the pump condition is only about 80% of the best efficiency of the turbine, QbP/HbT≈0.8; From the flow-head diagram, we can see that in the pump mode, the head gradually decreases with the increase of flow, and the speed of head decline is faster and faster. The flow is small at high head, and the efficiency is slightly lower at this time. While in the turbine mode, the head gradually increases with the increase of flow, and the speed of head rise is faster and faster, and the flow is large at high head, and the efficiency of the turbine has not shown an obvious downward trend at this time. Therefore, compared with the pump, the pump in reverse mode can run better under large flow and obtain higher efficiency; From the flow-power relation diagram, we can see that the power in the pump mode increases gradually with the increase of flow, and the power increases more and more slowly. For pumps, Pη = ρgQH, with the increase of flow rate, the power increases and the head decreases, so the efficiency of the pump decreases significantly. In the turbine mode, the power increases gradually with the increase of flow rate, but unlike the pump mode, the power increases faster and faster. For turbines, p = ρgQHη, In the case of large flow, both the head and power increase, but the head increase is much faster than the power increase, and the gap between the increase speeds becomes larger and larger, so the efficiency of the turbine mode decreases gradually and the decrease speed becomes faster and faster. The curves show that the pump-operated turbine can operate with higher head and output at higher flow rates. However, the power of the turbine cannot increase indefinitely, there will be a significant decrease in efficiency under larger flow, and the bearing capacity of the motor needs to be considered.
Performance prediction analysis
Considering that the inversion of large vaned-voluted centrifugal pump is rare, and in order to guarantee the inversion efficiency, this paper chooses the BEP performance prediction method with better universality and stronger theory to analyze. When the centrifugal pump is inverted to operate as a turbine, the experimental study shows that the pump as a turbine can operate at the optimum efficiency point (BEP) with higher flow and head. Define the flow and head conversion coefficients Q and h at the BEP between the pump and turbine modes. Conversion coefficients 1) and 2) are not limited by statistical/empirical range, performance data (such as BEP flow rate and pressure head) or detailed 3D geometry in pump mode, so they have high versatility and practicability. Domestic and international scholars have put forward a series of performance prediction formulas based on BEP method as shown in Table 5:

TABLE 5. BEP method performance prediction formulas.
The performance prediction data of the large vaned-voluted centrifugal pump are obtained by different methods. The error of the prediction value is defined by Formula 7. Where
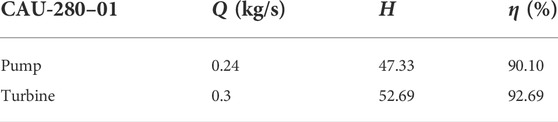
TABLE 6. BEP Point performance characteristic data.
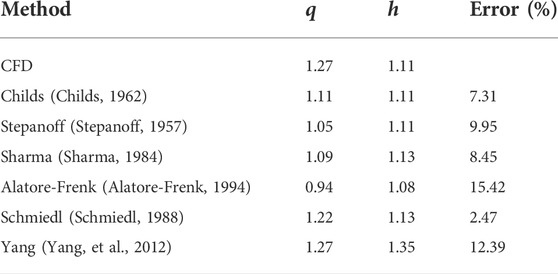
TABLE 7. CAU-280-01 performance prediction data and errors.
In addition, the errors of CAU-280–01, GDD80-20, GD100-21 (Huang, et al., 2017) and other performance prediction formulas for positive and negative rotation of two pumps with specific speed are compared. The specific speed calculation formula is shown in formula (8), the specific speed of three types of pumps is shown in Table 8, and the external characteristics data of the other two pumps are shown in Tables 9, 10, the final error of specific speed is shown in Figure 6. We can see that Schmiedl’s (1988) predictions are within 10% of the pump error at medium and higher specific speeds and provide a method for predicting errors within 10% for three types of pumps, so it can be applied to centrifugal pumps of different sizes and specific speeds.
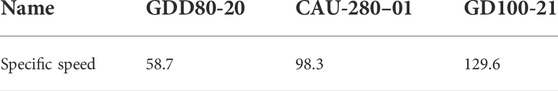
TABLE 8. Pump Specific speed.
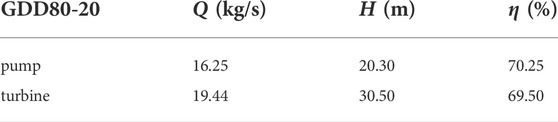
TABLE 9. GDD80-20 BEP point performance characteristic data.
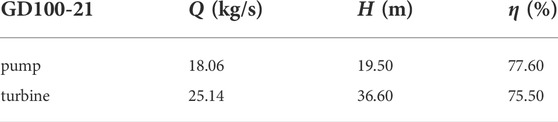
TABLE 10. GD100-21 BEP Point performance characteristic data.
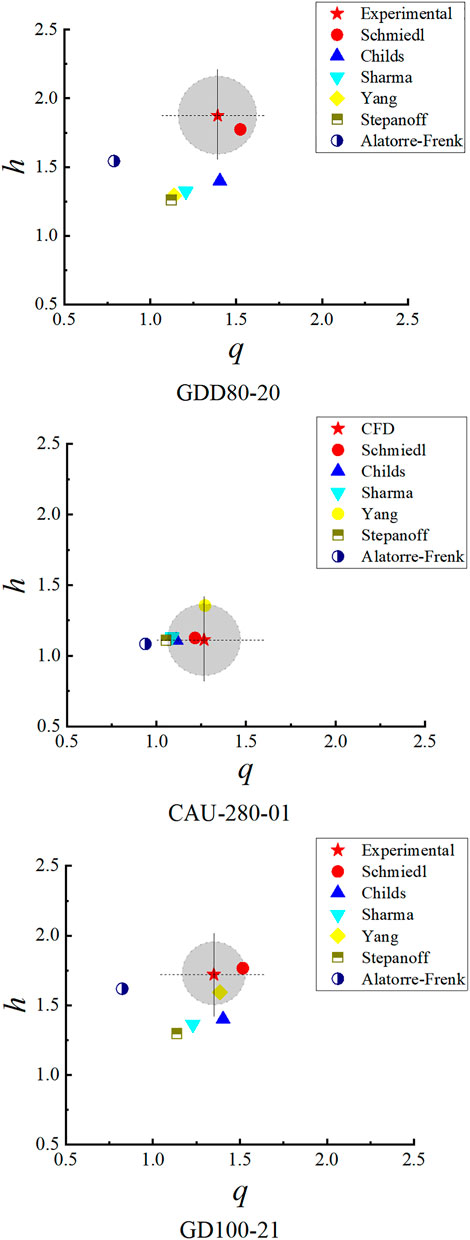
FIGURE 6. Error analysis of performance prediction formulas.
Forward and reverse internal flow analysis
Velocity and pressure distribution in forward and reverse inversions
In order to analyze the internal flow characteristics under pump positive and reverse operating conditions, the flow lines and velocity distributions under small flow (0.179 m3/s, 0.196 m3/s), optimum flow (0.237 m3/s), large flow (0.277 m3/s, 0.299 m3/s), and reverse operating small flow (0.2 m3/s, 0.25 m3/s), optimum flow (0.3 m3/s), and large flow (0.35 m3/s, 0.4 m3/s) are given as shown in Figures 7, 8. In order to better analyze the internal flow characteristics of the pump in the case of forward and reverse rotation, the dimensionless parameters of pressure and velocity are defined:
where p is the pressure and pref is the pressure at the draft tube inflow/outflow boundary (pump mode inflow and turbine mode outflow); v is speed, ω is the angular velocity at which the impeller rotates, r2 is the outer radius of the impeller.
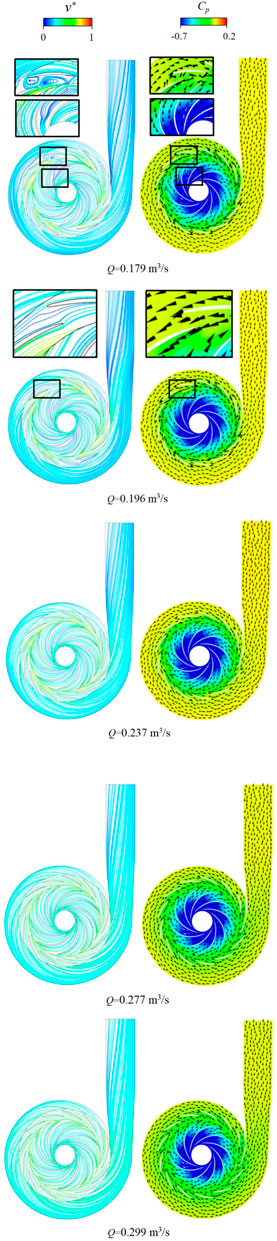
FIGURE 7. Streamline and pressure velocity distribution of pump mode.
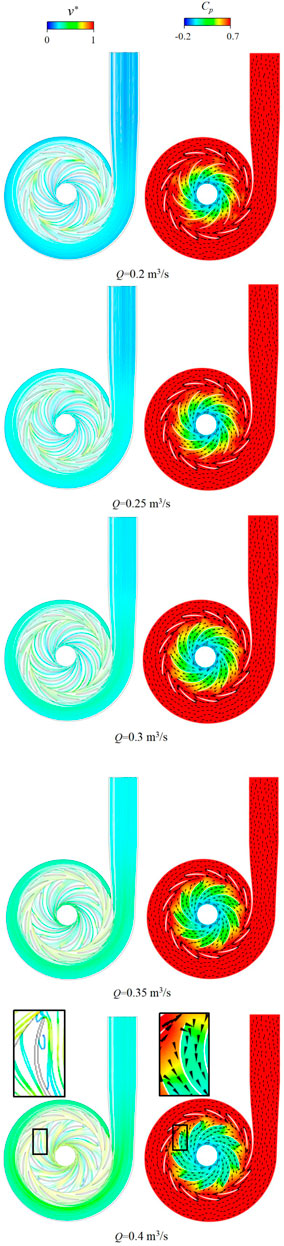
FIGURE 8. Streamline and pressure velocity distribution of turbine mode.
From the streamline and pressure distribution diagram of the pump mode (Figure 7), it can be seen that with the increase of flow rate, the flow speed inside the pump gradually increases, the pressure distribution in the pump is smooth and uniform. Under the condition of small flow rate (0.179 m3/s, 0.196 m3/s), there is a vortex in the internal flow, which appears between the clearances of fixed guide vanes. This may be due to insufficient development of flow at small flow rate, and the return flow of liquid occurs when the direction of flow does not match the direction of the vanes. This leads to the appearance of stall vortices and the full development of flow under design flow and large flow conditions, so that the overall flow is stable and uniform.
From the turbine mode streamline and pressure distribution diagram (Figure 8), we can see that there is no smooth separation of flow in the pump at small flow rate (0.2 m3/s, 0.25 m3/s) and optimum flow rate. The pressure distribution is uniform. The impeller flow appears vortex at large flow rate (0.4 m3/s), which mainly appears on the suction side of the outer edge of the blade. This may be due to the separation of stall vortexes and flow occurring when the direction of the pump reverse acting as the turbine does not match the direction of the blade under high flow rate.
Forward and reverse internal FED analysis
Based on the simulation results, there is a method to characterize FED, which is entropy production rate (EPR). EPR can be divided into two parts: loss item εloss and dissipation item εdisp:
where T is temperature,
For better analysis, dimensionless coefficients are defined ε’, as shown in the Formula 16, the ε′ distribution is shown in Figures 9, 10.
From the FED distribution diagram under the pump mode, we can see that the high loss areas under five different flow conditions mainly appear on the suction side of the blade and the inlet and outlet fillets of the blade. The value of ε′ of the inlet and outlet fillets of the blade is more than 5, while the value of ε′ of the suction side of the blade is between 3 and 4, slightly lower than the inlet and outlet loss value of the blade. The overall high loss area distribution of the guide vane under different flow conditions is greater than the high loss area distribution in the impeller, the value of ε′ of guide vane is mainly distributed in the fillet of guide vane.
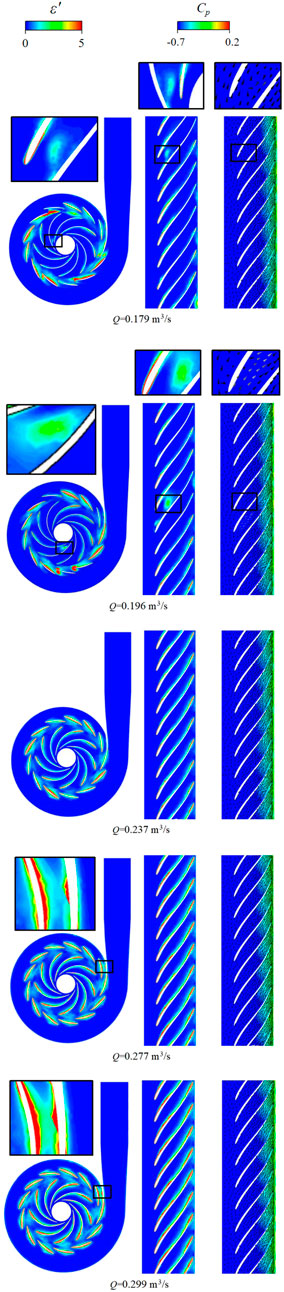
FIGURE 9. FED distribution of pump mode.
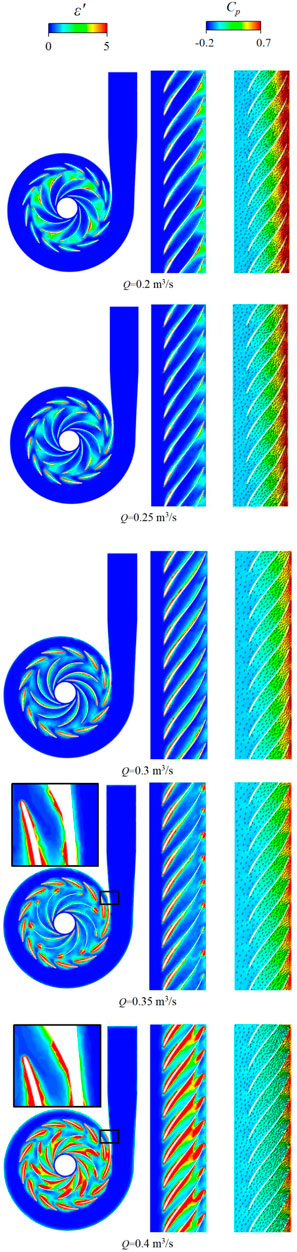
FIGURE 10. FED distribution of turbine mode.
Under the flow rate of 178 m3/s in the pump mode, it can be found that there is a small energy loss between the blade gaps, and the value of ε′ is about 1–2. As the flow rate increases to 195 m3/s, the value of ε′ increases to 2–3. Compared with the velocity pressure vector diagram, we can infer that the energy loss may be caused by insufficient flow development and liquid impacting the blade at small flow, and the position of energy loss is constantly changing with the rotation of the impeller. There is basically no energy loss near the design flow, and the flow is stable and uniform. With the further increase of the flow, there is a small energy loss between the blade gaps when the high flow 298 m3/s is reached, and the value of ε′ is about 1, but it is not obvious in the blade loss diagram, it shows that although there is a slight capacity loss at this time, it can be ignored. And the energy loss under large flow may be caused by flow separation and vortex caused by the mismatch between the incoming flow direction and the blade direction.
From the FED distribution diagram under the turbine mode, we can see that in the case of small flow and large flow, the high loss area is widely distributed. In the case of small flow (0.2 m3/s, 0.25 m3/s), the high loss area of the impeller is mainly distributed on the suction side of the impeller blade, and the value of ε′ is between three and 4. In addition, there is a small range of energy loss at the blade inlet. In the case of large flow (0.35 m3/s, 0.4 m3/s), the high loss area is also mainly distributed on the suction side of the impeller blade, and the range of the high loss area of the impeller inlet under large flow is significantly larger than that under small flow. We can also notice that there is a small range of high energy loss near the wall of the spiral case stay ring under the condition of large flow. The high energy loss of the guide vane under different flows is at the corner of the guide vane and the value of ε′ is more than 5. The average value of ε′ of large flow is slightly higher than that of small flow, this is because the loss caused by excessive flow impact and mismatching of incoming flow direction and blade direction under large flow is greater than that caused by insufficient flow development under small flow.
FED analysis of the same flow rate with positive and reverse inversions
In order to compare the performance of positive and negative rotation, two conditions of flow approximation (300 m3/s) are selected for comparison. The FED position is shown in Figures 11, 12. It can be seen that the high FED mode in pump mode appears in the following five positions:
1) Section of the stay ring near volute
2) Head and tail of guide vane
3) Runner crown and gap
4) Suction side of runner blade
5) Runner blade inlet and outlet fillet

FIGURE 11. Q = 300 m3/s FED distribution of pump.
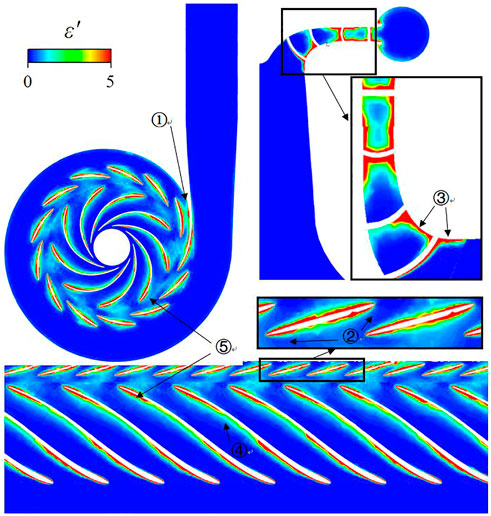
FIGURE 12. Q = 300 m3/s FED distribution of turbine.
We can see that the value of ε′ at positions 1, 2, 3 and 5 is greater than 5, while the value of ε′ at position 4 is about 2∼3. These high energy loss positions have two main characteristics that near wall or in the wake region. In the turbine mode, high energy loss appears in the following five positions:
1) Section of the stay ring near volute
2) Head and tail of guide vane
3) Runner crown and gap
4) Suction side of runner blade
5) Runner blade inlet fillet
Similarly, we can see that the value of ε′ at positions 1, 2, 3 and 5 is greater than 5, while the value of ε′ at position 4 is about 2∼3. These high energy loss positions have two main characteristics that near wall or in the wake region. Comparing the positive and negative rotation, it can be found that the high energy loss area of the blade in the pump mode mainly exists in the inlet and outlet part of the blade, while the high energy loss area of the blade in the turbine mode mainly exists in the inlet part of the blade. The distribution law of the rest of the energy loss is basically the same.
Vortex rope analysis of turbine modes
Considering the common vortex rope phenomena in turbine, the larger flow rate (0.45 m3/s, 0.5 m3/s) of the model in turbine mode is simulated and the whole flow rate (0.3 m3/s, 0.35 m3/s, 0.4 m3/s, 0.45 m3/s, 0.5 m3/s) is obtained, ε′ distribution and pressure velocity distribution are shown in Figure 13. From the diagram, we can see that there is no obvious vortex rope in the draft tube near the design flow rate (0.3 m3/s), which indicates that the flow condition is good and the efficiency is high at this time. When the flow rate is more than 0.4 m3/s, there is obvious vortex rope in the draft tube. Compared with the pressure velocity distribution diagram, it can be seen that the pressure changes more and more obviously with the increase of flow rate and the high pressure zone gradually increases. However, the velocity distribution becomes more and more chaotic and the chaotic area gradually spreads to the entire draft tube. Even at 0.5 m3/s flow rate, obvious flow separation and vortices appear at the draft tube outlet.
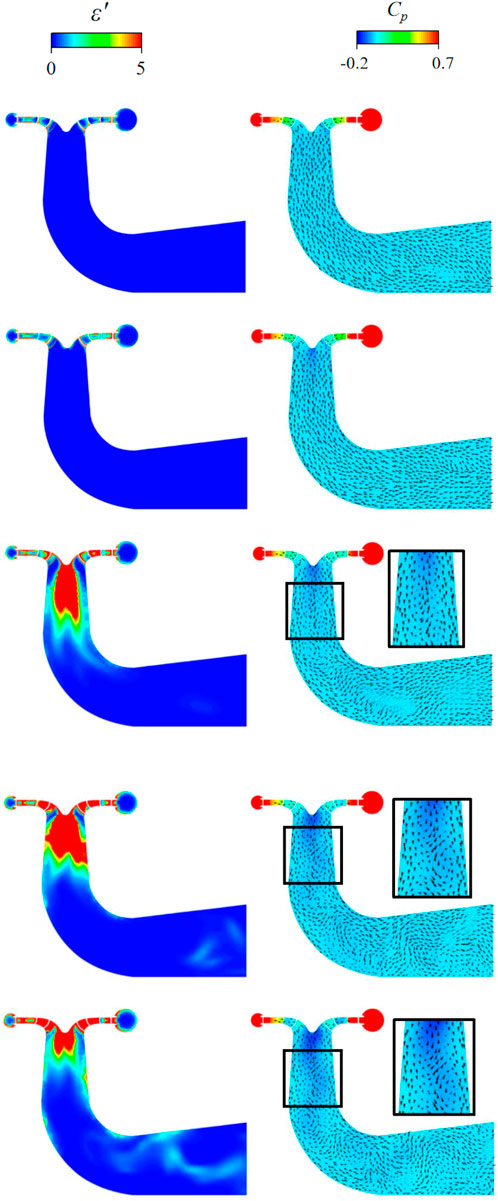
FIGURE 13. Vortex rope schematic diagram under high flow conditions of turbine mode.
Conclusion
In this paper, the forward and reverse rotation performance of large vaned-voluted centrifugal pump is studied by numerical simulation, and the following conclusions are obtained:
1) The positive and reverse characteristics of large vaned-voluted centrifugal pump at different flow rates were studied, and its positive and reverse external characteristics curves were obtained. It was found that the efficiency of BEP point under two operating conditions of positive and reverse rotation of large vaned-voluted centrifugal pump is not significantly different, but the pump reverse can be operated at the BEP point with higher flow rate and head. Generally speaking, QT≈1.3QP at BEP point. The head of BEP point under pump condition is only about 80% of the optimum efficiency of turbine, HbP/HbT≈0.8. On the basis of the above equations, we can quickly estimate the flow and head of the pump reversal as the approximate optimum efficiency point from the performance of the pump, which will be helpful to the practical application selection of pump reversal and the subsequent test. In terms of power, the power of turbine mode under the same flow rate is much larger than that of pump mode, which means that pump reversal can achieve good power generation effect. However, in practical application, power can not be unlimited with the increase of flow rate, considering the load and adaptability of generator, so as to avoid safety problems. On the basis of the above equations, we can quickly estimate the flow and head of the pump reversal as the approximate optimum efficiency point from the performance of the pump, which will be helpful to the practical application selection of pump reversal and the subsequent test.
2) Based on BEP method, through comparative analysis of performance prediction formulas, the error ranges of different reverse performance prediction formulas are obtained. For pumps with lower specific speed, only the error of Schmiedl’s (1998) method is within 10%. Except Alatore-Frenk (1994) and Yang’s (2012) methods, the errors between the methods and the pumps with medium specific speed are within 10%. In the case of high specific speed, only (Schmiedl 1998) and (Yang’s 2012) methods are within the error range. Generally speaking, the errors of (Schmiedl’s 1998) method in different specific speed pumps are within 10%, while the errors of other performance prediction formulas in different specific speed pumps cannot be guaranteed to be less than 10%. This shows that Schmiedl’s 1998 method can provide reliable performance prediction for pumps with medium to high specific speed. The performance of PAT can be preliminarily obtained by directly using this prediction formula before the test and simulation, which avoids unnecessary simulation and experiment to a certain extent, and the performance prediction formula is not affected by the size and performance characteristics of the unit, and has better universality. Meanwhile, in the future research on the performance prediction of pump reverse rotation as a hydraulic turbine, A prediction method suitable for a wider range than the rotational speed and with higher accuracy is obtained.
3) Internal flow under positive and reverse rotation conditions was simulated, pressure distribution, velocity distribution and distribution of entropy production rate were obtained. In terms of speed and pressure, it can be found that the flow in pump mode is stable and uniform under design flow and large flow conditions, while in low flow conditions, there are vortexes between the clearances of fixed guide vanes and slight flow disorder between impeller vanes, which is due to insufficient flow development under small flow conditions. In the turbine mode, the flow is stable and uniform under small flow rate and design flow rate, while in the case of large flow, vortexes appear in the impeller flow, mainly on the suction side of the outer edge of the blade. This is because the stall vortexes and flow separation occur when the inflow direction of the pump is reversed as the turbine does not match the direction of the blade under large flow rate. We can focus on the improvement of impeller blades to optimize the flow and improve the performance in the future.
4) In terms of FED distribution, it is found that the high energy loss of the impeller in pump mode mainly occurs at the suction side of the blade and the fillet part of the blade inlet and outlet, and there is a small energy loss in the blade clearance under large and small flow conditions. In the hydraulic turbine mode, it can be seen that the high energy loss area is significantly expanded compared with the pump mode, and the high energy loss area of the impeller is mainly distributed at the suction side of the impeller blade and the fillet of the blade flow inlet. In addition, the forward and reverse FED distribution under the approximate flow is also compared, and it is found that the high energy loss area of the blade in the pump mode mainly exists at the inlet and outlet of the blade, the high energy loss area of the blade in the turbine mode mainly exists in the inlet part of the blade. It is also found that in the case of large flow, the vortex band distribution becomes more and more extensive with the increase of flow, and the influence on the flow is more obvious. The above energy loss will lead to the decrease of unit efficiency and unstable operation. In actual operation, it is necessary to focus on the operation status of the above positions. This also provides some ideas for the transformation of impeller blades. The suction side and fillet of blades are optimized to obtain the optimal blade inlet angle and wrap angle, even considering the application of long and short blades. In addition, the inlet angle, outlet angle, number of blades, blade profile and other parameters of the guide vane also have a certain impact on the performance of the hydraulic turbine.
Data availability statement
The original contributions presented in the study are included in the article/supplementary material, further inquiries can be directed to the corresponding author.
Author contributions
SY: Conceptualization, Methodology, Writing- Original draft preparation, Investigation. PL: Conceptualization, Investigation, Writing- Original draft preparation. ZL: Conceptualization, Investigation, Writing- Original draft preparation. RX: Methodology, Investigation, Validation. DZ: Validation, Investigation. KL: Validation, Investigation. RT: Writing- Reviewing and Editing.
Funding
The authors would like to acknowledge the financial support of National Natural Science Foundation of China. This study is funded by National Natural Science Foundation of China grant number 52079142.
Conflict of interest
KL was employed by the company Dongfang Electric Machinery Co, Ltd.
The remaining authors declare that the research was conducted in the absence of any commercial or financial relationships that could be construed as a potential conflict of interest.
Publisher’s note
All claims expressed in this article are solely those of the authors and do not necessarily represent those of their affiliated organizations, or those of the publisher, the editors and the reviewers. Any product that may be evaluated in this article, or claim that may be made by its manufacturer, is not guaranteed or endorsed by the publisher.
References
Agostinelli, A., and Shafer, L. (2013). Centrifugal pumps as hydraulic turbines. Power fluids. 7 (3), 5–7.
Alatorre-Frenk, C. (1994). Cost minimisation in micro-hydro systems using pumps-asturbines. Coventry, UK: University of Warwick.
Barrio, R., Fernandez, J., Blanco, E., Parrondo, J., and Marcos, A. (2011). Performance char-acteristics and internal flow patterns in a reverse-running pump–turbine. Proc. Institution Mech. Eng. Part C J. Mech. Eng. Sci. 226, 695–708. doi:10.1177/0954406211416304
Childs, S. (1962). Convert pumps to turbines and recover HP. Hydrocarb. Process. Pet. Refin. 41, 173–174.
Deambi, S. (2011). Ipcc special report: On renewable energy sources and climate change mitigation. Sol. Q. 3 (4), 13–25.
Derakhshan, S., and Nourbakhsh, A. (2008). Theoretical, numerical and experimental investigation of centrifugal pumps in reverse operation. Exp. Therm. Fluid Sci. 32, 1620–1627. doi:10.1016/j.expthermflusci.2008.05.004
Fecarotta, O., Carravetta, A., Ramos, H. M., and Martino, R. (2016). An improved affinity model to enhance variable operating strategy for pumps used as turbines. J. Hydraulic Res. 54 (3), 332–341. doi:10.1080/00221686.2016.1141804
Feng, X., Qiu, B., and Wang, Y. (2020). Optimizing parallel pumping station operations in an open-channel water transfer system using an efficient hybrid algorithm. Energies 13, 4626. doi:10.3390/en13184626
Fernandez, J., Barrio, R., Blanco, E., Parrondo, J. L., and Marcos, A. (2010). Numerical investiga-tion of a centrifugal pump running in reverse mode. Proc. Institution Mech. Eng. Part A J. Power Energy 224, 373–381. doi:10.1243/09576509JPE757
Gong, R. Z., Wang, H. J., Chen, L. X., Li, D. Y., and Zhang, H. C. (2013). Application of entropy production theory to hydro-turbine hydraulic analysis. Sci. China Technol. Sci. 56 (7), 1636–1643. doi:10.1007/s11431-013-5229-y
Huang, S., Qiu, G., Su, X., Chen, J., and Zou, W. (2017). Performance prediction of a centrifugal pump as turbine using rotor-volute matching principle. Renew. Energy 108, 64–71. doi:10.1016/j.renene.2017.02.045
Jain, S. V., and Singal, S. K. (2009). Design of water conductor system for ultra low head hydropower project – A case study. In: Proceedings of the international conference on advances in mechanical engineering, April 11-12, 2015, Zhengzhou.
Jain, S. V., Swarnkar, A., Motwani, K. H., and Patel, R. N. (2015). Effects of impeller diameter and rotational speed on performance of pump running in turbine mode. Energy Convers. Manag. 89, 808–824. doi:10.1016/j.enconman.2014.10.036
Jia, W., and Liu, H. (2014). Loss sources analysis of shroud leakage flow in highly-loaded turbine. J. Propul. Technol. 35 (1), 33–42. doi:10.13675/j.cnki.tjjs.2014.01.017
Kaunda, C. S., Kimambo, C. Z., and Nielsen, T. K. (2014). A technical discussion on microhydropower technology and its turbines. Renew. Sustain. Energy Rev. 35, 445–459. doi:10.1016/j.rser.2014.04.035
Kluxen, R., Behre, S., Jeschke, P., and Guendogdu, Y. (2016). Loss mechanisms of interplatform steps in a 1.5- stage axial flow turbine. J. Turbomach. 139 (3), 031007. doi:10.1115/1.4034848
Liu, M., Tan, L., and Cao, S. (2019). Theoretical model of energy performance prediction and BEP determination for centrifugal pump as turbine. Energy 172, 712–732. doi:10.1016/j.energy.2019.01.162
Menter, F. R., Kuntz, M., and Langtry, Rb. (2003). Ten years of industrial experience with the SST turbulence model. Turbul. 4, Heat Mass Transf. 4, 625–632.
Menter, F. R. (1994). Two-equation eddy-viscosity turbulence models for engineering applications. AIAA J. 32, 1598–1605. doi:10.2514/3.12149
Motwani, K., Jain, S., and Patel, R. (2013). Cost analysis of pump as turbine for pico hydropower plants – A case study. Procedia Eng. 51, 721–726. doi:10.1016/j.proeng.2013.01.103
Orchard, B., and Klos, S. (2009). Pumps as turbines for water industry. World Pumps 8, 22–23. doi:10.1016/S0262-1762(09)70283-4
Paish, O. (2002). Micro-hydropower: Status and prospects. Proc. Institution Mech. Eng. Part A J. Power Energy 216, 31–40. doi:10.1243/095765002760024827
Raman, N., Hussein, I., Palanisamy, K., and Foo, B. (2013). An experimental investigation of pump as turbine for micro hydro application. IOP conference series: Earth and environmental science. IOP Conf. Ser. Earth Environ. Sci. 16, 012064. doi:10.1088/1755-1315/16/1/012064
Ranjitkar, G., Huang, J., and Tung, T. (2006). Application of micro-hydropower technology for remote regions. EIC Clim. Change Technol. 2006, 1–10. doi:10.1109/EICCCC.2006.277207
Rawal, S., and Kshirsagar, J. T. (2007). Numerical simulation on a pump operating in a turbine mode, Kirloskar Brothers India Limited. In: Proceedings of the twenty-third international pump users symposium, 1 May 1986, USA. doi:10.21423/R1WD5C
Rodrigues, A., Singh, P., Williams, A., Nestmann, F., and Lai, E. (2003). Hydraulic analysis of a pump as a turbine with CFD and experimental data. In: IMechE seminar computational fluid dynamics for fluid machinery, 18 November, 2003, London, UK
Sammartano, V., Filianoti, P., Sinagra, M., Tucciarelli, T., Scelba, G., and Morreale, G. (2017). Coupled hydraulic and electronic regulation of cross-flow turbines in hydraulic plants. J. Hydraul. Eng. 143 (1), 04016071.1–04016071.8. doi:10.1061/(asce)hy.1943-7900.0001226
Saxena, P. (2006). Overview of small hydro power development in India. Dehradun: Himalayan small Hydro Power Summit.
Sedlar, M., Soukal, J., and Komarek, M. (2009). CFD analysis of middle stage of multistage pump operating in turbine regime. Eng. Mech. 16 (9), 413–421.
Sharmaa, R. K. (1984). Small hydroelectric projects-use of centrifugal pumps as turbines. Bangalore, India: Kirloskar Electric Co.
Sinagra, M., Sammartano, V., Morreale, G., and Tucciarelli, T. (2017). A new device for pressure control and energy recovery in water distribution networks Water. Switz. 9, 309. doi:10.3390/w9050309
Stepanoff, A. J. (1957). Centrifugal and axial flow pumps, design and applications. New York: John Wiley & Sons.
Williams, A. A. (1994). The turbine performance of centrifugal pumps: A comparison of prediction methods. Proc. Institution Mech. Eng. Part A J. Power Energy 208, 59–66. doi:10.1243/pime_proc_1994_208_009_02
Williams, A. (1996). Pumps as turbines for low cost micro hydro power. Renew. Energy 9, 1227–1234. doi:10.1016/0960-1481(96)88498-9
Yang, S.-S., Derakhshan, S., and Kong, F.-Y. (2012). Theoretical, numerical and experimental prediction of pump as turbine performance. Renew. Energy 48, 507–513. doi:10.1016/j.renene.2012.06.002
Yu, A., Tang, Y., Tang, Q., Cai, J., Zhao, L., and Ge, X. (2022). Energy analysis of Francis turbine for various mass flow rate conditions based on entropy production theory. Renew. Energy 183, 447–458. doi:10.1016/j.renene.2021.10.094
Yu, A., Tang, Y., Zhou, D., and Liu, J. (2021). Numerical investigation of the energy evaluation in a Francis turbine based on an advanced entropy production model. Int. Commun. Heat Mass Transf. 129, 105755. doi:10.1016/j.icheatmasstransfer.2021.105755
Zeinalpour, M., and Mazaheri, K. (2015). Entropy minimization in turbine cascade using continuous adjoint formulation. Eng. Optim. 48 (2), 213–230. doi:10.1080/0305215x.2014.998663
Keywords: BEP point, performance prediction, flow analysis, energy loss, pump as turbine
Citation: Yang S, Li P, Lu Z, Xiao R, Zhu D, Lin K and Tao R (2022) Comparative evaluation of the pump mode and turbine mode performance of a large vaned-voluted centrifugal pump. Front. Energy Res. 10:1003449. doi: 10.3389/fenrg.2022.1003449
Received: 27 July 2022; Accepted: 29 August 2022;
Published: 26 September 2022.
Edited by:
Mostafa S. Shadloo, Institut national des sciences appliquées de Rouen, FranceReviewed by:
Tullio Tucciarelli, University of Palermo, ItalyAnna Stoppato, University of Padua, Italy
Copyright © 2022 Yang, Li, Lu, Xiao, Zhu, Lin and Tao. This is an open-access article distributed under the terms of the Creative Commons Attribution License (CC BY). The use, distribution or reproduction in other forums is permitted, provided the original author(s) and the copyright owner(s) are credited and that the original publication in this journal is cited, in accordance with accepted academic practice. No use, distribution or reproduction is permitted which does not comply with these terms.
*Correspondence: Ruofu Xiao, eHJmQGNhdS5lZHUuY24=