 Éowyn Lucas
 Lihao Han
 Ian Sullivan
 Harry A. Atwater
 Chengxiang Xiang
- Department of Engineering and Applied Science, California Institute of Technology, Pasadena, CA, United States
Photoelectrochemical (PEC) water-splitting systems have the unique ability to produce renewable hydrogen directly from sunlight, independent of the electrical grid. These systems are therefore appealing technological options for resilient long-term energy storage. Ion selective membranes, such as monopolar and bipolar membranes, are a vital component of PEC water-splitting systems. These membranes allow for ionic conduction between the cathode and anode chambers, separation of products, and improved catalyst environments for reactions. In order to measure key properties and to study the performance of these ion exchange membranes, it is imperative to develop a robust testing protocol that can be used across the field. This paper introduces two standard electrochemical cells designed to directly measure ion transport properties in monopolar and bipolar membranes. The first electrochemical cell uses commercially available Pt disk electrodes to preform electrochemical impedance spectroscopy (EIS) and reliably measure through-plane conductivity of monopolar membranes. The second electrochemical cell uses four-point measurements with Luggin capillaries and a series of membrane configurations to perform current density-voltage and Faradaic efficiency (FE) measurements for water dissociation (WD) reactions on bipolar membranes. The cell designs and techniques laid out below allow for accurate measurement of ion transport parameters in ion exchange membranes, direct comparison of membranes being developed across the field, and in turn, greater advancements in ion exchange membranes and PEC water-splitting systems.
1 Introduction
As our world shifts towards a renewable energy future, it is imperative to develop new technological solutions across many industrial sectors (i.e., energy, transportation, chemical production, etc.). One such technology is photoelectrochemical (PEC) water splitting systems, which allow for renewable production of hydrogen (H2) using solar irradiation as the primary source of energy. Hydrogen is an important commodity chemical used for power generation, transportation, ammonia and methanol production, petroleum refining and many other industrial applications (Abergel et al., 2021). In 2020, the global demand for H2 was 90 Mt, with approximately 80% of this hydrogen produced through the reforming of fossil fuels, a process which produces CO2 as a byproduct and was responsible for 2.5% of global energy and industry CO2 emissions (Abergel et al., 2021). Hydrogen is now considered to be a centerpiece for renewable fuel production and decarbonization of multiple sectors in our society, therefor, the demand for renewable hydrogen has increased rapidly in recent years. PEC water splitting systems provide a clean alternative in which renewable sunlight powers the electrochemical separation of water into H2 and O2 (Walter et al., 2010; Nocera, 2012; Cox et al., 2014; Xiang et al., 2016; Spitler et al., 2020; Cheng et al., 2021; Hamdani and Bhaskarwar, 2021; Segev et al., 2022). With electrolysis currently making up only 0.03% of the global H2 production, these technologies have significant room for growth (Abergel et al., 2021).
Lowering cell voltage and improving product separation are essential elements in developing efficient, robust and safe PEC water-splitting systems. For practical deployment of large-scale PEC water-splitting systems, a robust method that can prevent diffusive and convective crossover of H2 and O2 is critically important to ensure the system stays below the flammability limit of 4% H2 in O2 mixture in a dynamic operation (Russel, 2011; Roger et al., 2017; Ardo et al., 2018). The low operating current densities of PEC water splitting systems relative to water electrolysis systems have more stringent requirements for product separations (Berger et al., 2014). Ion exchange membranes with the proper thickness and permeability can provide product separation and minimize crossovers (Haussener et al., 2012; Ardo et al., 2018; Cheng et al., 2021; Welch et al., 2021). This separation barrier, however, must be ionically conductive, as to maintain charge balance across the cell. It is also crucial to improve the efficiency and economic feasibility of PEC systems by lowering the overall cell voltage. The use of membranes in the system for product separation adds to the overall cell voltage, therefore, increasing the conductivity of these membranes is key to their development (Haussener et al., 2012; Fountaine et al., 2016; Ardo et al., 2018). As described further below, the use of ion exchange membranes can also lead to improved catalyst environments, further reducing the cell voltage and creating ideal environments for Earth abundant catalysts for both the oxygen evolution reaction (OER) and the hydrogen evolution reaction (HER) (Haussener et al., 2012; McDonald et al., 2014; Vermaas et al., 2015; Chabi et al., 2017; Oener et al., 2020, 2021; Thiele et al., 2020).
Ion exchange membranes consist of polymers containing ionizable functional groups that allow for the selective transport of cations in cation exchange membranes (CEMs) and anions in anion exchange membranes (AEMs) (Xu, 2005; Ran et al., 2017; Luo et al., 2018). Monopolar membranes (CEMs or AEMs) are used in PEC systems to carry ionic currents from one electrochemical cell chamber to another and prevent H2 and O2 crossovers (Haussener et al., 2012; Ardo et al., 2018; Spitler et al., 2020; Cheng et al., 2021; Welch et al., 2021). Bipolar membranes (BPM) consist of a cation exchange layer (CEL) laminated to an anion exchange layer (AEL), usually with a water dissociation (WD) catalyst at the junction between the CEL and AEL. Under reverse bias, enhanced WD due to the presence of a catalyst and a large electric field occurs at the junction between the CEL and AEL. H+ ions then travel selectively through the CEL, while OH− ions travel selectively through the AEL, creating separate acidic and basic streams on either side of the BPM (Xu, 2005; Ran et al., 2017; Giesbrecht and Freund, 2020). When implemented into PEC systems, BPMs allow for sustained large pH gradients (0–14) between the cathode and anode chamber. The pH of the catholyte and anolyte can therefore be independently optimized for Earth abundant catalysts for HER, which is kinetically more feasible under acidic conditions, and OER, which is kinetically more feasible under alkaline conditions (Haussener et al., 2012; McDonald et al., 2014; Vargas-Barbosa et al., 2014; Vermaas et al., 2015; Luo et al., 2016a; Vermaas and Smith, 2018; Bui et al., 2020; Giesbrecht and Freund, 2020; Oener et al., 2020, 2021; Yan and Mallouk, 2021).
For continued advancement of ion exchange membranes, it is important to develop consistent benchmarking protocols to measure ion transport properties in these CEMs, AEMs, and BPMs. We describe the development of electrochemical cells and measurement techniques that directly probe ion transport in ion exchange membranes via electrochemical impedance spectroscopy (EIS), current density-voltage measurements, and Faradaic efficiency (FE) measurements for WD reactions. One of the most important parameters of ion exchange membranes in PEC water-splitting applications is the through-plane conductivity (Fountaine et al., 2016; Xiang et al., 2016; Ran et al., 2017; Luo et al., 2018). To reliably measure the through-plane conductivity in these membranes, a custom cell was designed and fabricated, in which the membrane is pressed between two Pt disk electrodes and electrochemical impedance spectroscopy (EIS) was performed (Figure 1A). Although some important information can also be drawn from EIS of BPMs, (Wilhelm et al., 2001; Blommaert et al., 2019; Chen et al., 2020) the more important and fundamental parameters for understanding ion transport through a BPM and water dissociation efficiency at the BPM junction are voltage drop across the BPM and FE for H+ and OH− production (Wilhelm et al., 2002; Chabi et al., 2017; Shen et al., 2017; Vermaas and Smith, 2018; Chen et al., 2020; Blommaert et al., 2021). To most effectively measure these parameters, a custom electrodialysis flow cell with embedded Luggin capillaries was developed (Figures 1B,C). Both the EIS and the electrodialysis custom cells described in this paper are designed to overcome losses due to electrolyte resistance, which is the main limitation of many testing methods. Beyond providing a testing environment for developing a deeper understanding of ion transport in ion exchange membranes, consistently using these types of systems and following the protocols laid out in this paper will allow for the direct comparison of membranes across many devices in the PEC community and in turn further advancements in the field.
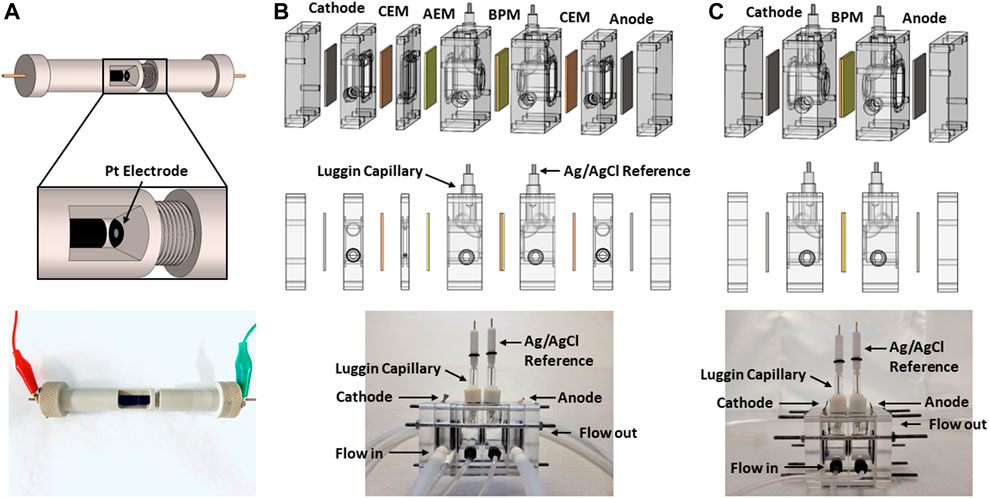
FIGURE 1. Custom cell for EIS measurements (A) and custom electrodialysis flow cell for testing BPMs (B,C). (B) shows five chamber configuration and (C) showed two chamber configuration.
2 Procedure and methods
2.1 Step-by-step procedure
Prior to testing, all membranes are stored in a clean, dry environment to prevent warping and degradation. Once ready for testing, membranes are pretreated according to their product instructions and stored in DI water or relevant electrolyte for exchange to the desired transport ion (i.e., H+, OH−, Na+, Cl−, etc.). Pretreatment procedures depend on the type of membrane being investigated and are discussed further in Section 2.1.1. When working with ion exchange membranes it is important to note that they are delicate and easy to damage while handling. To avoid damage, handle gently and avoid contact with sharp objects. Damaged membranes can lead to invalid results due to leakage through pinholes or tears.
2.1.1 Step-by-step procedure for electrochemical impedance spectroscopy measurements of cation exchange membranes and anion exchange membranes
To measure the conductivity of CEMs and AEMs, a rapid electrochemical impedance spectroscopy (EIS) through-plane conductivity measurement and analysis technique was developed, in which two Pt disk electrodes (2 mm in diameter) were aligned with each other and pressed against the membrane materials during the measurements. A custom measurement tool (Figure 1A) was developed that allows for the controlled tightening of the Pt disk electrodes to minimize any contact resistance between the metal/membrane interface, as well as losses due to electrolyte resistance present in most electrochemical cells. Please reach out to point of contact to obtain CAD files for this custom EIS measurement cell.
In preparation for testing, CEM samples are preheated in a 70°C degree water bath for ∼30 min, and soaked in the desired electrolyte (i.e., acid for H+ conductivity measurement, or NaCl for Na+ conductivity measurement) for at least 24 h. AEM samples are prepared in the same way and soaked in a relevant electrolyte (i.e., base for OH− conductivity measurement, or NaCl for Cl− conductivity measurement) for at least 24 h. The membranes are then cut into a strip large enough to completely cover the 2 mm diameter Pt electrode area when being installed in the custom cell. The pretreated and cut membrane is then installed in the slot of the cell, and the cell is tightened until the membrane contacts both Pt electrodes.
Once the membrane is loaded in the cell, the electrodes are connected to a potentiostat using two-electrode EIS measurements. A typical frequency range between 100 kHz and 1 MHz and an AC amplitude of 10 mV are applied during the EIS measurements to obtain the high frequency characteristics of the ion exchange membranes. For membrane conductivity >1 mS·cm−1, the high frequency response shows a linear response in the Nyquist plot (Bard and Faulkner, 2011). A Debye circuit model is used to evaluate the through-plane conductivity of the membrane (Bard and Faulkner, 2011). This method allows for rapid evaluation of ion conductivity of the synthesized membrane. The Zreal value is the membrane resistance (Rb) when -Zimag = 0 ohm in the Nyquist plot figure. Conductivity can be determined from this bulk resistance using Eq. 1, where σ is conductivity, L is the distance between the contacting electrodes, and A is the area of the membrane. See results in Section 4.1 for an example of the technique and data fitting.
2.1.2 Step-by-step procedure for voltage and faradaic efficiency measurements of bipolar membranes
To benchmark BPMs by measuring voltage drop and FE for generation of H+ and OH− via WD reaction, a custom electrochemical flow cell with embedded Luggin capillaries was developed (Figures 1B,C). Please reach out to point of contact to obtain CAD files for this custom electrochemical cell. The Luggin capillaries in the cell allow for the minimization of losses due to iR drop in the electrolyte and the multiple chambers and flow system allow for direct monitoring of the pH on either side of the BPM. The five-chamber cell depicted in Figure 1B is the ideal configuration if pH and FE measurements are desired. In this configuration, since the ions in the center chamber are contained by the outer AEM and CEMs, H+ and OH− produced via WD can be directly measured using titration or a pH meter. These calculations are discussed later in the paper. In the two-chamber configuration, depicted in Figure 1C, for every H+/OH− made from WD, an H+/OH− is consumed at its respective electrode. Therefore, although direct measurements of co-ion crossover such as ICP analysis can be performed (Luo et al., 2016b), this configuration is not ideal for measuring pH and FE. This two-chamber configuration, however, is designed for maintaining a steady-state pH differential between the catholyte and anolyte, therefore, studying how HER and OER perform with specific catalysts in acidic and basic environments, respectively (Sun et al., 2016; Zhou et al., 2016).
As with monopolar membranes, bipolar membranes are pretreated for best results when testing. For the case of BPMs, the CEM and AEM are pretreated before constructing the full membrane. CEMs and AEMs are pretreated as described in Section 2.1.1. Fully constructed BPMs are stored in DI water or relevant electrolyte. These pretreated and wetted BPMs are then ready for testing in the custom electrodialysis cell.
The electrodialysis cell consists of multiple layers, shown in Figures 1B,C. The following steps should be taken to construct either cell configuration. Copper tape is applied as leads on the anode and cathode. Both electrodes, as well as pretreated BPM, CEMs, and AEM are stacked into the custom electrodialysis cell, as indicated in Figures 1B,C. The cell is then screwed together until hand tight, to prevent leaking. Ag/AgCl reference electrodes are placed in the Luggin capillaries and potentiostat leads are attached to the two reference electrodes, anode, and cathode in a four-point measurement configuration. Finally, the tubing is attached to pumps and the following flow configuration is set up. 1 M Na2SO4, NaOH, or KOH is flowed through the outer electrode chamber chambers in the five-chamber configuration, 0.5 M NaCl is flowed through the chambers on either side of the BPM in both cell configurations (e.g., the acid chamber and base chamber), and 3 M NaCl is flowed through between the AEM and CEM chamber (e.g., the dilute chamber) in the five-cell configuration. For the electrode chambers, the electrolyte is fed from one chamber directly into the next and then recirculated using a flow rate on the order of 10–20 ml/min. Instead of the water-splitting reaction at the electrodes, redox couples, such as ferro/ferricyanide can also be used for electrode reactions (Digdaya et al., 2020). The 3 M NaCl is recirculated through the dilute chamber, also using a similar or faster flow rate, as to not deplete all of the ions in solution and to maintain the conductivity of the solution. In the acid and base chambers, 0.5 M NaCl flows through both chambers individually, without recirculating. A pump with accurate flow rate (usually on the order of 0.1–1 ml/min) control is used for the chambers on either side of the BPM, so that FE can be calculated as explained later in this section.
Once the cell is constructed, chronopotentiometry measurements are taken by applying a specific current across the anode and cathode and measuring the voltage between the two reference electrodes. Measurements are often started at 0 A and increased step-wise from there. For each step, the current is held at a constant value until a steady voltage is reached (∼10–30 min). This voltage is then recorded and current density-voltage plots are constructed from this data.
Also of importance in understanding the performance of a BPM is the pH obtained on either side of the BPM, which allows for calculation of the Faradaic efficiency (FE) of H+ and OH− produced. FE of H+ and OH− generation and transport through the BPM is dependent on current density, due to co-ion crossover being more dominate at lower current densities, before WD takes over. To obtain FE for a given BPM, the BPM is pretreated and cell constructed as described above. A selected current is then applied across the cell and 0.5 M NaCl is flowed through the chambers on either side of the BPM at a specified flow rate (chosen based on the desired final pH value). The cell is allowed 10–30 min for the voltage to stabilize and then a few mL of the out flow from the chambers on either side of the BPM (acidic stream and basic stream) is collected. It is best to collect multiple samples over time to determine any error present in measurements and note if the pH is shifting with time. Once the acid and base stream samples are collected, the best method to determine the H+/OH− concentration, and in turn the pH, is titration of a known buffer. A pH probe can also be used, however, these probes tend to lose accuracy at extreme pH values, whereas titrations will remain accurate at all pH values. For the FE values shown in the results of this paper, a pH probe was used for measurements at low currents (≤10 mA) and titration was performed for measurements at high currents (>10 mA).
Titrations are performed by titrating the unknown acid or base sample into a known buffer. For the results presented in this paper, a phosphate buffer with a pKa of 7.21 was made using KH2PO4 and K2HPO4. The corresponding buffer reactions are given in Eq. 2 (acid) and Eq. 3 (base). When making the buffer solution, all salts were dried before being weighed and the molarity is determined based on the pH values to be measured. For each titration, a specific amount of buffer is measured into a beaker with a stir bar and placed on a stir plate. A pH probe is then submerged in the buffer and an auto log of the pH over time is started. The acid or base sample with unknown concentration is then slowly added to the buffer using a pump with an accurate flow rate. The titration is monitored by watching the change in pH and observing when the equivalence point occurs. Once the titration is complete, pH vs. time is plotted and the derivative is taken to determine at what time the equivalence point occurs. The amount of time to the equivalence point along with the flow rate is used to determine the volume of unknown sample added to the buffer. If access is available, an automatic titration system can also be used. Once the equivalence point and volume of sample added are determined, Eqs 4–6 along with the molar mass of the phosphate salts are then used to calculate the H+/OH− concentration.
Once the pH, H+, or OH− values have been determined, via titration or a pH probe, Eqs 7–18 can be used to calculate FE (Digdaya et al., 2020).
In the above equations,
2.2 Data collection, analysis, and records management
2.2.1 Data collection, analysis, and record management of electrochemical impedance spectroscopy measurements for cation exchange membranes and anion exchange membranes
All data was collected through Gamry Instruments Framework software and analyzed using OriginLab. Example plots made in OriginLab can be seen in Figure 2 in Section 4.1. A standard naming system for each sample should be developed and the following information should be recorded for each saved file: date, sample name, electrolyte type and concentration, and sample thickness. Determined resistances should then be recorded for each sample, from which conductivity can be calculated.
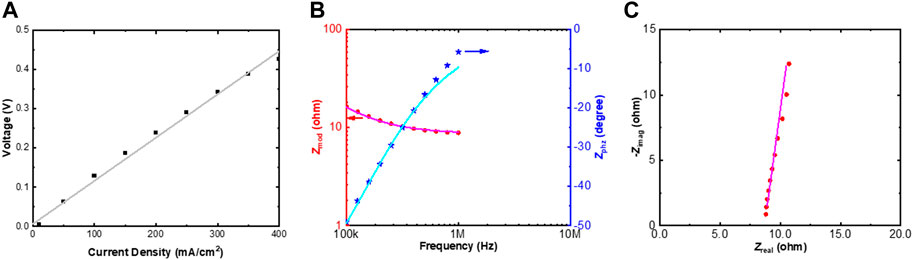
FIGURE 2. Current-voltage plot, with linear fit, for Nafion 117 (cation exchange membrane), using electrodialysis flow cell (A). Bode plot (B) and Nyquist plot (C) with a Debye model fit for Nafion N117 in 0.5 M H2SO4.
2.2.2 Data collection, analysis, and record management of voltage and faradaic efficiency measurements for bipolar membranes
All data was collected through EC-lab software and analyzed using OriginLab. Example plots made in OriginLab are shown in Figure 3 in Section 4.2. A standard naming system should also be developed for all samples in these experiments and the following information should be recorded for each saved file: date, sample name, electrolyte type and concentration, and flow rate. Applied currents and measured voltages are then recorded as well as titration and pH measurements. This is the raw data that can then be used for current-voltage and FE plot.
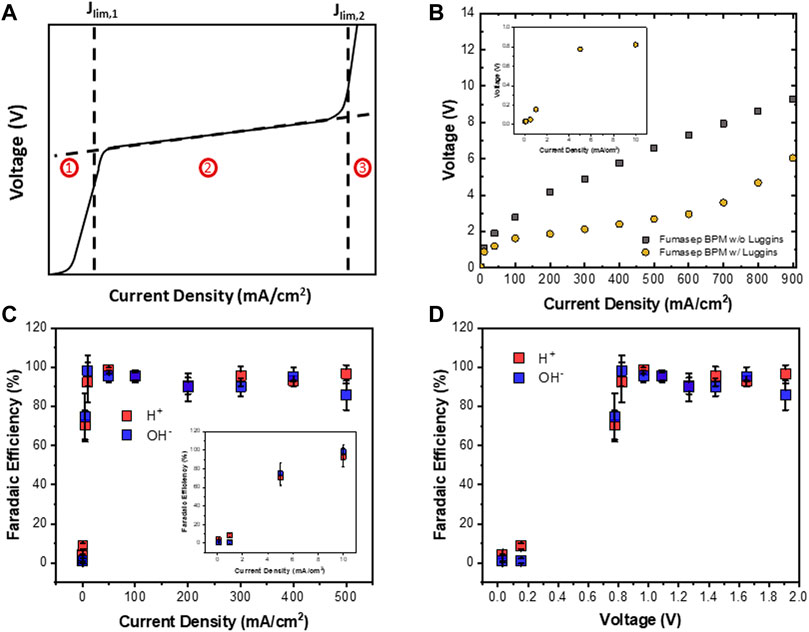
FIGURE 3. Typical current voltage profile for a bipolar membrane under reverse bias (A). Current-voltage (B), Faradaic efficiency of H+ and OH− vs. current density (C), and Faradaic efficiency of H+ and OH− vs. voltage (D) plots for a commercial Fumasep bipolar membrane tested in custom electrodialysis flow cell (flow rate: 1 ml/min).
2.3 Equipment and supplies
2.3.1 Electrochemical impedance spectroscopy cell materials/chemicals
Membranes (CEM, AEM). Chemicals for pretreating membranes (HCl, KOH, NaCl, etc.). DI water.
2.3.2 Hardware for electrochemical impedance spectroscopy cell
Customized pressing cell resistant to the electrolyte (PEEK). Potentiostat with capability of EIS measurement (e.g., Gamry Reference 620 potentiostat). Electrical lead cables 2 working electrodes with 2 mm in diameter Pt coated in the center of the tip (CHI102P by CH Instruments Inc.).
2.3.3 Software for electrochemical impedance spectroscopy cell
Potentiostat software (e.g., Gamry Instruments Framework). Bode plot, Nyquist plot, and Debye model fitting software (e.g., Gamry Echem Analyst). Data analysis and figure plotting software (e.g., Microsoft Office, OriginLab).
2.3.4 Electrodialysis cell materials/chemicals
Membranes (CEM, AEM, BPM). Chemicals for pretreating membranes (HCl, KOH, NaCl, etc.). Electrolyte in the desired concentration (e.g., 0.5 M H2SO4, 0.5 M NaCl, 3 M NaCl). DI water.
2.3.5 Hardware for electrodialysis cell
Customized electrodialysis cell resistant to the electrolyte (Acrylic). Customized Luggin capillaries (custom made in glass shop). Potentiostat with the capabilities of four-point chronopotentiometry measurement (e.g., Biologic Potentiostat). Electrical lead cables Pt coated Ti foil for anode and cathode.
2.3.6 Software for electrodialysis cell
Potentiostat software (e.g., EC-lab). Data analysis and figure plotting software (e.g., Microsoft Office, OriginLab).
2.3.7 Materials for measuring [H+] and [OH−]
pH meter (Hanna instruments desktop pH meter). pH meter calibration solutions. Software for logging pH over time (Hanna desktop pH meter software). Pump that allows for accurate set flow rate (syringe pump or peristaltic pump). Stir plate/stir bar. Phosphate salts (KH2PO4 and K2HPO4). DI water.
2.4 Units, nomenclature, and definitions
mA/cm2—standard units for current density. V—standard for voltage. M—standard for concentration (mol/L). FE—Faradaic efficiency, percent of current (e-) going toward producing desired product. BPM—Bipolar membrane. CEM/CEL—Cation exchange membrane/cation exchange layer. AEM/AEL—Anion exchange membrane/anion exchange layer.
3 Quality control and quality assurance
3.1 Calibration and standardization
3.1.1 Calibration and standardization of electrochemical impedance spectroscopy measurements for cation exchange membranes and anion exchange membranes
Common and well-studied membranes, such as Nafion, should be used as standards in the EIS cell. The same procedures laid out in Section 2.1 can be used to test these standard membranes. Specifications about the conductivity of these standard membranes are typically given by the company from which they were purchased. Conductivities obtained using the EIS cell should be comparable to the conductivities given by the membrane companies. If this is the case, these standards can then be used to compare against new membranes being tested in the EIS cell. Results for Nafion 117 (Fuel Cell Store) testing in the custom EIS cell are also given in Section 4.1 and can be used as a standard for calibrating new systems.
3.1.2 Calibration and standardization of voltage and faradaic efficiency measurements for bipolar membranes
Commercial BPMs, such as the Fumasep FBM (Fumasep BPM, Fuel Cell Store), should be used as a standard in the custom electrodialysis cell. Chronopotentiometry and pH measurements can be taken as described in Section 3.2 for the Fumasep BPM. Examples of the expected resulting current voltage and faradaic efficiency plots are shown in Figure 3. If results match these plots, then the cell is working correctly and can be used to test and compare new membranes.
For pH measurements and titrations, the pH probe should be calibrated daily, using standard buffer solutions. The pump for titrations should also be calibrated to determine an accurate flow rate.
3.2 Common issues and troubleshooting
When troubleshooting membrane systems, the first step is to test a standard commercial membrane, such as the ones described in Section 3.1.1 and Section 3.1.2. This will help to determine if the error is coming from the testing environment or the membrane itself. If the data collected from the standard membrane looks accurate compared to other published results, then likely the issue is with the new membrane being tested. In this case, try making a new sample and seeing if the error occurs again.
3.2.1 Common issues and troubleshooting of electrochemical impedance spectroscopy measurements for cation exchange membranes and anion exchange membranes specifics
It is important to make sure that membranes remain fully wetted through testing and cover the entire electrode surface. To avoid dehydration of the membrane, they should be stored in solution until just before testing and tested immediately after loading into the EIS cell. It is also important to avoid over tightening the custom EIS cell, as this can lead to inaccurate results due to compression of the membrane. The cell should be tightened until the Pt electrodes are contacting the membrane on either side, but no farther. If improbable results are obtained, try rewetting the membrane and loading it back into the cell.
3.2.2 Common issues and troubleshooting of voltage and faradaic efficiency measurements for bipolar membranes
When assembling the electrodialysis cell and initially filling the chambers with electrolyte, it is important to make sure that no bubbles are trapped on the surface of the BPM or at the tip of the reference electrodes within the Luggin capillaries. Trapped bubbles in these locations can lead to increased voltage values that are not representative of the actual voltage across the BPM. If bubbles are seen at the surface of the BPM, tilt and shake the cell until the bubbles are removed. A pipette with electrolyte solution can also be used to push bubbles out of the capillaries and away from the BPM surface.
The Ag/AgCl reference electrodes contain porous frits which are immersed in electrolyte and can be prone to leaking and voltage drifting. It is important to frequently test these reference electrodes against a standard reference electrode (for instance, the standard hydrogen electrode, SHE). Faulty reference electrodes can significantly alter the voltage measured across the BPM, giving inaccurate results.
It is also important to note that even though the Luggin capillaries reduce much of the losses due to iR drop in the electrolyte, some loss will remain. For the best results using Luggin capillaries, it is recommended that the tip of the Luggin capillary is placed no closer than a distance of 2d, where d is the diameter of the Luggin tip, from the surface of the BPM (Biani, 2003). The Luggins should also be placed toward the top of the BPM active area to block as little of the surface as possible. These placement requirements will help avoid interference of the Luggin capillaries with the electric field at the surface of the BPM.
4 Results and discussion
4.1 Electrochemical impedance spectroscopy measurements for cation exchange membranes and anion exchange membranes results and discussion
As previously discussed, measurements performed in an electrochemical cell usually include un-compensated resistance due to the electrolyte surrounding a membrane. The measurement errors would be significant when the conductivity and the thickness of the electrolyte layers are comparable to membranes. Figure 2A shows a current voltage plot of a Nafion 117 CEM tested using Luggin capillaries in the electrodialysis cell pictured in Figure 1B. The linear fit shown by the line in gray follows Ohm’s Law (V = IR) and can therefore, ideally be used to calculate the conductivity of the monopolar membrane. However, even with the use of Luggin capillaries, when testing a monopolar membrane in a liquid electrolyte environment, the electrolyte resistance dominates and the measured conductivity is much lower than the intrinsic membrane conductivity. For example, when calculated from the slope in Figure 2A, a much lower conductivity of 16.6 mS·cm−1 was obtained due to the contribution from the un-compensated solution resistance. As a result, a custom EIS cell shown in Figure 1A was designed specifically to determine the conductivity of monopolar membranes without solution resistance losses. Figures 2B,C show the Bode plot and Nyquist plot results of the Nafion N117 CEM measured by the EIS technique in the custom cell and then fitted by the Debye electrochemical model within the high frequency range (typically between 100 kHz and 1 MHz). The pink curve in Figure 2C crosses the -Zimag = 0 ohm at Zreal = 8.683 ohm, meaning that the through-plane resistance of the Nafion N117 CEM is 8.683 ohm. After being normalized by the thickness, L (183 μm), and the cross-sectional area, A (), the through-plane conductivity σ of 67.09 mS·cm−1 was obtained. This conductivity value, unlike the one measured using Luggin capillaries in the electrodialysis cell, is more accurate and within the expect range for fully wetter Nafion 117 at room temperature (Wang et al., 2011; Thompson, 2014; Nafion N115, N117, N1110: Ion Exchange Materials, 2019).
Ideally, CEMs and AEMs can be developed with high conductivities such that they can be added to PEC water splitting cells to manage product separation without significantly increasing the voltage due to resistance in the cell. Conductivity measurements obtained through the methods exemplified here can be used to directly compare the efficiencies of membrane being studied for PEC systems.
4.2 Voltage and faradaic efficiency measurements for bipolar membranes results and discussion
A typical current density-voltage curve for a BPM contains three regions, as depicted in Figure 3A. In region 1, where the applied current is low, water dissociating is not yet prominent and co-ion crossover dominates. At the first limiting current (Jlim,1), H+ and OH− migration begins to dominate as the co-ions are flushed out of the membrane and WD at the junction occurs more rapidly. Eventually, migration of H+ and OH- is the prevailing source of current, leading to the plateau in region 2. Here, the current density-voltage relationship becomes ohmic and the small increase in voltage is due purely to the membrane resistance and residual resistance from the electrolyte. As the membrane is taken to higher currents, however, a second limiting current (Jlim,2) is observed. Jlim,2 occurs due to water transport limitations in the membrane. At this point, the rate of water transport through the CEL and AEL can no longer keep up with the rate of water dissociation at the junction, therefor, a sigmoidal increase in voltage is observed (region 3) (Strathmann et al., 1997; Krol et al., 1998; Blommaert et al., 2019; Giesbrecht and Freund, 2020; Hohenadel et al., 2021; Pärnamäe et al., 2021).
Observing where each of these regions occur for newly developed membranes will allow for deeper understanding of membrane performance and help advance BPM technologies. The value of Jlim,1 is an indication of the perspectivity (ability of the CEL to selectively transport cations and the AEL to selectively transport cations) of the CEL and AEL (Giesbrecht and Freund, 2020; Pärnamäe et al., 2021). Lower voltages and a more gradual slope in region 2 indicate more efficient water dissociation at the BPM junction and less resistance in the membrane, respectively. Lastly, the value of Jlim,2 can be used to determine the onset of water transport limitations.
Figure 3B shows a typical current density-voltage plot for a commercial Fumasep BPM. The importance of using Luggin capillaries was evidenced by comparing the two curves in Figure 3B. When Luggin capillaries were not employed, the voltages at higher current densities were much larger due to iR losses in the electrolyte (Vargas-Barbosa et al., 2014; Chen et al., 2020). When Luggin capillaries were used, the voltage was lowered significantly (Figure 3B). Although there may still be small iR losses due to the un-compensated solution resistance in these measurements, the polarization curves obtained with Luggin capillaries are much more indicative of the actual voltage across the BPM and allows for clear visualization of the three regimes laid out in Figure 3A. For the Fumasep BPM, Jlim,1 occurs at ∼5 mA/cm2 and Jlim,2 occurs at ∼500 mA/cm2. In these experiments, a sigmoidal curve is not observed at Jlim,2. This is due to the experimental design, in which the voltage measurement is taken after the current is held for 20 min. This does not allow time for the membrane junction to fully dry out and, therefore, the voltage is not yet at steady state. If demonstration of the sigmoidal curve is desired, these higher currents should be held for longer until steady state voltage is reached.
Figures 3C,D show the FE of H+/OH− vs. current density and voltage, respectively. At low current densities, the FE for both H+ and OH− is low, indicating that co-ion crossovers accounted for a significant portion of the measured current. In this region, the voltages are relatively low, as an insignificant amount of H+ and OH− is being transported thought the membrane. At current densities ≥10 mA/cm2, however, the FE for both H+ and OH− improved significantly and the measured current was dominated by the generation of H+ and OH− from water dissociation. An increase in voltage is also observed as WD begins. FE measurements provide greater insight into the amount of current being used toward co-ion crossover and leakage vs. transport of H+ and OH− from WD. Using these standard measurements will allow for the comparison of ion transport selectivity in new BPMs and in turn the efficiency of these new BPMs toward creating acidic and basic environments for HER and OER, respectively.
5 Conclusion
Understanding ion transport in monopolar and bipolar membranes is key for improving their performance in PEC water splitting systems, allowing for lower cell voltages, improved product isolations, and superior environments for Earth abundant HER and OER catalysts. This protocol paper describes two custom electrochemical cells designed for measuring ion transport in and performance of ion exchange membranes: an EIS cell perfected for determining conductivity of CEMs and AEMs and an electrochemical flow cell with Luggin capillaries for measuring voltage and FE of BPMs. The former is designed such that a membrane can be sandwiched directly between two Pt electrodes and the conductivity can be determined without the interference of electrolyte resistance. The latter is designed such that a direct measurement of voltage across the BPM can be obtained through reference electrodes placed in the Luggin capillaries, without iR drops due to the surrounding electrolyte. Two different designs, five-chamber and two-chamber, allow for ideal environments for measuring pH/FE and OER/HER performance in a bipolar membrane enhances water splitting cell, respectively. These direct measurements of voltage and FE are vital for understanding WD efficiency and co-ion crossover/leakage within a BPM. Applied across the field, these developments in testing systems and protocol will lead to easy comparison and advances in ion exchange membrane technology for PEC water splitting systems.
Data availability statement
The raw data supporting the conclusion of this article will be made available by the authors, without undue reservation.
Author contributions
ÉL: Designed the electrochemical cell for measuring ion transport in bipolar membranes described in this work. She took all measurments associated with this system. She was also the main author of the manuscript text and developed all final figures. LH: Designed the electrochemical cell for EIS measurements. He collected all data related to this system and contributed to the figures and writing of these sections of the manuscript. IS: Contributed significantly to the development of the titration system described in the test, as well as adding important edits and contributions to the manuscript text. HA: Advised EL in the development of the electrochemical testing systems and data collection/analysis. CX: Advised ÉL, LH, and IS in the development of the electrochemical testing systems and data collection/analysis and added significant revisions to the manuscript text.
Acknowledgments
The authors acknowledge the support from of the United States Department of Energy, Energy Efficiency and Renewable Energy (EERE) under contract number DE-EE0008092, and United States Department of Energy, Advanced Research Projects Agency–Energy (ARPA-e) under contract number DE-AR0001407.
Conflict of interest
The authors declare that the research was conducted in the absence of any commercial or financial relationships that could be construed as a potential conflict of interest.
Publisher’s note
All claims expressed in this article are solely those of the authors and do not necessarily represent those of their affiliated organizations, or those of the publisher, the editors and the reviewers. Any product that may be evaluated in this article, or claim that may be made by its manufacturer, is not guaranteed or endorsed by the publisher.
References
Abergel, T., Armijo, J., Bains, P., Bennett, S., Berghout, N., Bibra, E. M., et al. (2021). Global hydrogen review. Paris, France: International Energy Agency (IEA)
Ardo, S., Rivas, D. F., Modestino, M. A., Greiving, V. S., Abdi, F. F., Llado, E. A., et al. (2018). Pathways to electrochemical solar-hydrogen technologies. Energy Environ. Sci. 11, 2768–2783. doi:10.1039/c7ee03639f
Bard, A., and Faulkner, L. (2011). Electrochemical methods: Fundamentals and applications. 2nd Edition. New York: Wiley.
Berger, A., Segalman, R. A., and Newman, J. (2014). Material requirements for membrane separators in a water-splitting photoelectrochemical cell. Energy Environ. Sci. 7, 1468–1476. doi:10.1039/c3ee43807d
Biani, P. Z. C. N. F. F. de (2003). Inorganic electrochemistry: Theory, practice and application. Cambridge: RSC Publishing.
Blommaert, M. A., Aili, D., Tufa, R. A., Li, Q., Smith, W. A., and Vermaas, D. A. (2021). Insights and challenges for applying bipolar membranes in advanced electrochemical energy systems. ACS Energy Lett. 6, 2539–2548. doi:10.1021/acsenergylett.1c00618
Blommaert, M. A., Vermaas, D. A., Izelaar, B., In’T Veen, B., and Smith, W. A. (2019). Electrochemical impedance spectroscopy as a performance indicator of water dissociation in bipolar membranes. J. Mat. Chem. A 7, 19060–19069. doi:10.1039/c9ta04592a
Bui, J. C., Digdaya, I., Xiang, C., Bell, A. T., and Weber, A. Z. (2020). Understanding multi-ion transport mechanisms in bipolar membranes. ACS Appl. Mat. Interfaces 12, 52509–52526. doi:10.1021/acsami.0c12686
Chabi, S., Wright, A. G., Holdcroft, S., and Freund, M. S. (2017). Transparent bipolar membrane for water splitting applications. ACS Appl. Mat. Interfaces 9, 26749–26755. doi:10.1021/acsami.7b04402
Chen, Y., Wrubel, J. A., Klein, W. E., Kabir, S., Smith, W. A., Neyerlin, K. C., et al. (2020). High-performance bipolar membrane development for improved water dissociation. ACS Appl. Polym. Mat. 2, 4559–4569. doi:10.1021/acsapm.0c00653
Cheng, W., Calle, A., Atwater, H. A., Stechel, E. B., and Xiang, C. (2021). Hydrogen from sunlight and water: A side- by-side comparison between photoelectrochemical and solar thermochemical water-splitting. ACS Energy Lett. 6, 3096–3113. doi:10.1021/acsenergylett.1c00758
Cox, C. R., Lee, J. Z., Nocera, D. G., and Buonassisi, T. (2014). Ten-percent solar-to-fuel conversion with nonprecious materials. Proc. Natl. Acad. Sci. U. S. A. 111, 14057–14061. doi:10.1073/pnas.1414290111
Digdaya, I. A., Sullivan, I., Lin, M., Han, L., Cheng, W. H., Atwater, H. A., et al. (2020). A direct coupled electrochemical system for capture and conversion of CO2 from oceanwater. Nat. Commun. 11, 4412–4510. doi:10.1038/s41467-020-18232-y
Fountaine, K. T., Lewerenz, H. J., and Atwater, H. A. (2016). Efficiency limits for photoelectrochemical water-splitting. Nat. Commun. 7, 13706. doi:10.1038/ncomms13706
Giesbrecht, P. K., and Freund, M. S. (2020). Recent advances in bipolar membrane design and applications. Chem. Mat. 32, 8060–8090. doi:10.1021/acs.chemmater.0c02829
Hamdani, I. R., and Bhaskarwar, A. N. (2021). Recent progress in material selection and device designs for photoelectrochemical water-splitting. Renew. Sustain. Energy Rev. 138, 110503. doi:10.1016/j.rser.2020.110503
Haussener, S., Xiang, C., Spurgeon, J. M., Ardo, S., Lewis, N. S., and Weber, A. Z. (2012). Modeling, simulation, and design criteria for photoelectrochemical water-splitting systems. Energy Environ. Sci. 5, 9922–9935. doi:10.1039/c2ee23187e
Hohenadel, A., Gangrade, A. S., and Holdcroft, S. (2021). Spectroelectrochemical detection of water dissociation in bipolar membranes. ACS Appl. Mat. Interfaces 13, 46125–46133. doi:10.1021/acsami.1c12544
Nafion N115, N117, N1110: Ion Exchange Materials Nafion N115, N117, N1110: Ion exchange materials (2019). Available at: www.fuelcellstore.com.
Krol, J. J., Jansink, M., Wessling, M., and Strathmann, H. (1998). Behaviour of bipolar membranes at high current density water diffusion limitation. Sep. Purif. Technol. 14, 41–52. doi:10.1016/S1383-5866(98)00058-6
Liberti, A., and Light, T. S. (1962). Potentiometric determination of kw with the glass electrode. J. Chem. Educ. 39, 236–239. doi:10.1021/ed039p236
Luo, J., Vermaas, D. A., Bi, D., Hagfeldt, A., Smith, W. A., and Grätzel, M. (2016a). Bipolar membrane-assisted solar water splitting in optimal pH. Adv. Energy Mat. 6, 1600100–1600107. doi:10.1002/aenm.201600100
Luo, J., Vermaas, D. A., Bi, D., Hagfeldt, A., Smith, W. A., and Grätzel, M. (2016b). Bipolar membrane-assisted solar water splitting in optimal pH. Adv. Energy Mat. 6, 1600100. doi:10.1002/aenm.201600100
Luo, T., Abdu, S., and Wessling, M. (2018). Selectivity of ion exchange membranes: A review. J. Memb. Sci. 555, 429–454. doi:10.1016/j.memsci.2018.03.051
McDonald, M. B., Ardo, S., Lewis, N. S., and Freund, M. S. (2014). Use of bipolar membranes for maintaining steady-state pH gradients in membrane-supported, solar-driven water splitting. ChemSusChem 7, 3021–3027. doi:10.1002/cssc.201402288
Oener, S. Z., Foster, M. J., and Boettcher, S. W. (2020). Accelerating water dissociation in bipolar membranes and for electrocatalysis. Sci. (80-. ) 369, 1099–1103. doi:10.1126/science.aaz1487
Oener, S. Z., Twight, L. P., Lindquist, G. A., and Boettcher, S. W. (2021). Thin cation-exchange layers enable high-current-density bipolar membrane electrolyzers via improved water transport. ACS Energy Lett. 6, 1–8. doi:10.1021/acsenergylett.0c02078
Pärnamäe, R., Mareev, S., Nikonenko, V., Melnikov, S., Sheldeshov, N., Zabolotskii, V., et al. (2021). Bipolar membranes: A review on principles, latest developments, and applications. J. Memb. Sci. 617, 118538–118625. doi:10.1016/j.memsci.2020.118538
Ran, J., Wu, L., He, Y., Yang, Z., Wang, Y., Jiang, C., et al. (2017). Ion exchange membranes : New developments and applications. J. Memb. Sci. 522, 267–291. doi:10.1016/j.memsci.2016.09.033
Roger, I., Shipman, M. A., and Symes, M. D. (2017). Earth-abundant catalysts for electrochemical and photoelectrochemical water splitting. Nat. Rev. Chem. 1, 0003. doi:10.1038/s41570-016-0003
Segev, G., Kibsgaard, J., Hahn, C., Xu, Z. J., Cheng, W.-H., Xiang, C, et al. (2022). The 2022 solar fuels roadmap. J. Phys. D. Appl. Phys. 55, 323003. doi:10.1088/1361-6463/ac6f97
Shen, C., Wycisk, R., and Pintauro, P. N. (2017). High performance electrospun bipolar membrane with a 3D junction. Energy Environ. Sci. 10, 1435–1442. doi:10.1039/c7ee00345e
Spitler, M. T., Modestino, M. A., Deutsch, T. G., Xiang, C. X., Durrant, J. R., Esposito, D. V., et al. (2020). Practical challenges in the development of photoelectrochemical solar fuels production. Sustain. Energy Fuels 4, 985–995. doi:10.1039/c9se00869a
Strathmann, H., Krol, J. J., Rapp, H. J., and Eigenberger, G. (1997). Limiting current density and water dissociation in bipolar membranes. J. Memb. Sci. 125, 123–142. doi:10.1016/S0376-7388(96)00185-8
Sun, K., Liu, R., Chen, Y., Verlage, E., Lewis, N. S., and Xiang, C. (2016). A stabilized, intrinsically safe, 10% efficient, solar-driven water-splitting cell incorporating earth-abundant electrocatalysts with steady-state pH gradients and product separation enabled by a bipolar membrane. Adv. Energy Mat. 6, 1600379–1600387. doi:10.1002/aenm.201600379
Thiele, S., Mayerhöfer, B., McLaughlin, D., Böhm, T., Hegelheimer, M., and Seeberger, D. (2020). Bipolar membrane electrode assemblies for water electrolysis. ACS Appl. Energy Mat. 3, 9635–9644. doi:10.1021/acsaem.0c01127
Thompson, E. L. (2014). Behavior of proton exchange membrane fuel cells at sub-freezing temperatures. New York: University of Rochester.
Vargas-Barbosa, N. M., Geise, G. M., Hickner, M. A., and Mallouk, T. E. (2014). Assessing the utility of bipolar membranes for use in photoelectrochemical water-splitting cells. ChemSusChem 7, 3017–3020. doi:10.1002/cssc.201402535
Vermaas, D. A., Sassenburg, M., and Smith, W. A. (2015). Photo-assisted water splitting with bipolar membrane induced pH gradients for practical solar fuel devices. J. Mat. Chem. A 3, 19556–19562. doi:10.1039/c5ta06315a
Vermaas, D. A., and Smith, W. A. (2018). Advances in photoelectrochemical water splitting: Theory, experiment and systems analysis. London: Royal Society of Chemistry. doi:10.1039/9781782629863-00208
Walter, M. G., Warren, E. L., McKone, J. R., Boettcher, S. W., Mi, Q., Santori, E. A., et al. (2010). Solar water splitting cells. Chem. Rev. 110, 6446–6473. doi:10.1021/cr1002326
Wang, C., Li, N., Shin, D. W., Lee, S. Y., Kang, N. R., Lee, Y. M., et al. (2011). Fluorene-based poly(arylene ether sulfone)s containing clustered flexible pendant sulfonic acids as proton exchange membranes. Macromolecules 44, 7296–7306. doi:10.1021/ma2015968
Welch, Alex J., Digdya, Ibadillah A., Kent, Ron, Paul, Ghougassian, Atwater, Harry A., and Xiang, Chengxiang (2021). Comparative technoeconomic analysis of renewable generation of methane using sunlight, water, and carbon dioxide. ACS Energy Lett. 6, 1540–1549. doi:10.1021/acsenergylett.1c00174
Wilhelm, F. G., Van Der Vegt, N. F. A., Strathmann, H., and Wessling, M. (2002). Comparison of bipolar membranes by means of chronopotentiometry. J. Memb. Sci. 199, 177–190. doi:10.1016/S0376-7388(01)00696-2
Wilhelm, F. G., Van der Vegt, N. F. A., Wessling, M., and Strathmann, H. (2001). Chronopotentiometry for the advanced current-voltage characterisation of bipolar membranes. J. Electroanal. Chem. (Lausanne). 502, 152–166. doi:10.1016/S0022-0728(01)00348-5
Xiang, C., Weber, A. Z., Ardo, S., Berger, A., Chen, Y. K., Coridan, R., et al. (2016). Modeling, simulation, and implementation of solar-driven water-splitting devices. Angew. Chem. Int. Ed. 55, 12974–12988. doi:10.1002/anie.201510463
Xu, T. (2005). Ion exchange membranes: State of their development and perspective. J. Memb. Sci. 263, 1–29. doi:10.1016/j.memsci.2005.05.002
Yan, Z., and Mallouk, T. E. (2021). Bipolar membranes for ion management in (Photo)Electrochemical energy conversion. Acc. Mat. Res. 2, 1156–1166. doi:10.1021/accountsmr.1c00113
Zhou, X., Liu, R., Sun, K., Chen, Y., Verlage, E., Francis, S. A., et al. (2016). Solar-Driven reduction of 1 atm of CO2 to formate at 10% energy-conversion efficiency by use of a TiO2-protected III-V tandem photoanode in conjunction with a bipolar membrane and a Pd/C cathode. ACS Energy Lett. 1, 764–770. doi:10.1021/acsenergylett.6b00317
Keywords: ion tranport, ion exchange membrane, monopolar membrane, bipolar membrane, cation exchange membrane (CEM), anion exchange membrane (AEM), photoelectrocemical (PEC), photoelectrochemical water spitting
Citation: Lucas É, Han L, Sullivan I, Atwater HA and Xiang C (2022) Measurement of ion transport properties in ion exchange membranes for photoelectrochemical water splitting. Front. Energy Res. 10:1001684. doi: 10.3389/fenrg.2022.1001684
Received: 23 July 2022; Accepted: 12 August 2022;
Published: 14 September 2022.
Edited by:
Abdolali K. Sadaghiani, Sabancı University, TurkeyCopyright © 2022 Lucas, Han, Sullivan, Atwater and Xiang. This is an open-access article distributed under the terms of the Creative Commons Attribution License (CC BY). The use, distribution or reproduction in other forums is permitted, provided the original author(s) and the copyright owner(s) are credited and that the original publication in this journal is cited, in accordance with accepted academic practice. No use, distribution or reproduction is permitted which does not comply with these terms.
*Correspondence: Chengxiang Xiang, Y3h4QGNhbHRlY2guZWR1