 Min Ye
 Meng Wei1,2
 Qiao Wang
- 1National Engineering Laboratory for Highway Maintenance Equipment, Chang’an University, Xi’an, China
- 2Department of Mechanical Engineering, National University of Singapore, Singapore, Singapore
Accurate and reliable estimation of state of health (SOH) for lithium-ion batteries under slight overcharge voltage cycling has great significance for battery management systems. In this study, commercial lithium-ion phosphate batteries are investigated under slight overcharge voltage cycling. The aging mechanism is discussed based on incremental capacity analysis and differential voltage analysis. Moreover, the syncretic health indicator is obtained from the incremental capacity curves based on principal component analysis. Specifically, the capacity retention and Coulombic efficiency are analyzed under slight overcharge voltage cycling. The incremental capacity peaks (i.e., peak B and peak C) are discussed to extract potential health indicators, and a syncretic health indicator is adopted based on principal component analysis. Finally, the Gaussian process regression is established for accuracy SOH estimation with a 95% confidence interval under small data of slight overcharge cycling. In comparison with the traditional methods, the proposed method exhibits higher accuracy with a 95% confidence interval, and the error is limited to 3%.
1 Introduction
With the increasingly serious problems of energy shortage and environmental pollution, the development of electric vehicles (EVs) has widely attracted researchers all over the world (Hu et al., 2020). Lithium-ion batteries (LIBs) are applied in the EV field because of their long-term cycle life, high energy density, and no memory effect (Pang et al., 2020; Semeraro et al., 2022). Among commercial LIBs, lithium iron phosphate (LFP) and lithium nickel manganese cobalt oxide (NCM) batteries are most commonly applied to provide power for EVs (Reniers et al., 2019). Owing to the advantages of long-term cycle life and strong safety performance, the LFP batteries are focused. However, considering the voltage and capacity of actual use (i.e., EVs), hundreds and thousands of LFP cells are applied in series and parallel connections (Liu et al., 2022). With long-term cycling, the batteries exhibit different aging states, which may cause poor matching performance of charging for some cells (Juarez-Robles et al., 2020; Xiong et al., 2020). Therefore, the problem of slight overcharge voltage will occur. Considering the LFP batteries with slight overcharge voltage cycling, accurate and reliable state of health (SOH) estimation is essential for optimizing the battery management system (BMS).
With long-term cycling, the loss of active material and lithium-ion will cause capacity fading and power degeneration (Chen et al., 2022). The SOH is an important indicator to evaluate the aging state. Currently, the SOH estimation methods have been mainly divided into two categories: model-based methods and data-driven methods (Xiong et al., 2018; Liu F. et al., 2021; Khaleghi et al., 2022; Wu et al., 2022). Among them, the model-based methods mainly include electrochemical methods, empirical methods, and equivalent circuit methods. The aging model of the solid electrolyte interphase (SEI) layer is established for the electrochemical method (Tian et al., 2021; Wu et al., 2022). The electrochemical method can not only describe the complex electrochemical reaction but also provide an accurate aging model. However, the measurement of parameters in the electrochemical method requires specific equipment. Moreover, the solution of the electrochemical method is complex (Wu et al., 2021). The empirical data (i.e., impedance, internal resistance, and cycle) are used to establish the empirical estimation method. Due to the problem of divergence, the empirical method is limited (Li et al., 2021a; Vichard et al., 2021). The state estimation and measurement equation are built for the equivalent circuit method (i.e., Kalman filtering) (Wang et al., 2020; Wu et al., 2022). However, the accurate model of SOH is difficult to establish. In recent times, the data-driven method has been wildly applied for SOH estimation. This method can not only address the strongly nonlinear regression problems for accurate SOH estimation but also break the constraint of the model-based methods. The data-driven methods are trained from the experimental data to obtain the time series relationship with the health state, including neural networks, support vector machines (SVM), extreme learning machines (ELM), and Gaussian process regression (GPR) (Shu et al., 2020; Liu K. et al., 2021; Huang et al., 2022; Wei et al., 2022). Artificial neural networks (ANNs) are widely used in data-driven methods (i.e., back propagation neural network (BPNN), radial basis function neural network (RBFNN), and recurrent neural network (RNN)) (Ma et al., 2020; Wang et al., 2022). Owing to the simple structure, the BPNN avoids building the complex aging model. However, BPNN is shown with low estimation accuracy and high calculation cost. The RBFNN has three layers of forward neural network, and higher estimation accuracy is obtained. However, the computational efficiency of RBFNN is poor (Yao et al., 2022). The SVM is based on Vapnik–Chervonenkis dimension and structural risk minimization theories. Although the SVM method has good prediction performance, it is not suitable for dealing with high-dimensional nonlinear problems. Due to the advantage of nonparametric estimation, the GPR has the ability to deal with small samples and nonlinear problems (Richardson et al., 2017; Yang et al., 2018; Li et al., 2022).
Recently, the incremental capacity analysis (ICA) and differential voltage analysis (DVA) were selected to assess the health of the battery. Usually, the direct health indicators (i.e., internal resistance and capacity) are used for SOH estimation (Hu, 2022). However, those indicators are difficult to measure online with common sensors, which limits their application. Currently, the direct measurement parameters (i.e., voltage, current, and temperature) have attracted the attention of indirect health indicators (Zhu et al., 2020; Li et al., 2021b). The incremental capacity (IC) curves and differential voltage (DV) curves can reflect the oxidation reaction and phase transition for lithium-ion batteries (Li et al., 2020). The obvious peaks on the IC curve are transformed from the voltage plateau curves under a constant current charging/discharging approach. The commercial LFP cells were investigated based on the ICA method under different temperatures to explain the aging mechanisms (Dubarry et al., 2011). Meanwhile, the IC peaks were analyzed to extract health indicators for SOH estimation (Feng et al., 2013). Similarly, the ICA method combined with the GRA method was proposed for SOH estimation (Li et al., 2019). Considering the LFP cells with slight overcharge voltage cycling, the ICA and DVA are used for analyzing the phase transition and aging mechanism under slight overcharge voltage cycling. Based on the abovementioned analysis, the characteristics of IC curves are extracted for analyzing the aging mechanism and SOH estimation under slight overcharge voltage cycling.
In this article, the LFP batteries are investigated under slight overcharge voltage cycling (i.e., an upper cut-off voltage of 3.65, 3.75, and 3.80 V). The ICA and DVA are used for analyzing the phase transition process and aging mechanism. According to the IC curves of LFP batteries under slight overcharge cycling, the health indicators are extracted and correlations are analyzed between proposed health indicators and capacity. Finally, the GPR is proposed for accurate and reliable SOH estimation. Compared with the previous work, the innovations of this article are as follows:
1. The LFP batteries are investigated with slight overcharge voltage cycling, and the phase transition and aging mechanism are analyzed based on ICA and DVA.
2. The health indicators are extracted based on the IC peaks under slight overcharge cycling, and the syncretic health indicator is obtained.
3. The method of LFP batteries with slight overcharge is proposed based on GPR to obtain accuracy and reliable SOH estimation with a 95% confidence interval.
The organization of this study is as follows: the methods of LFP batteries with slight overcharge are drawn in Section 2. Results and discussion are shown in Section 3. Conclusions are drawn in Section 4.
2 Methods
2.1 Experimental test and analysis
To investigate the LFP batteries with slight overcharge cycling, the three commercial LFP cells were tested on the BT2000 battery test system at room temperature. The three 18650 LFP cells were used, which were named as No. 1, No. 2, and No. 3. Due to the long cycle life for LFP cells, the rate of charging and discharging is set as 1 C (i.e., 1.5 Ah). Specifically, those cells were rested for 10 min. The current charging with 1 C is set for No. 1, No. 2, and No. 3 until different upper cut-off voltages (i.e., 3.65, 3.75, and 3.80 V), respectively. Then, the constant voltage is set until the cut-off current is at 0.02 C. For the rest of 10 min, cells were discharged with constant current (i.e., 1 C) until the cut-off voltage (i.e., 2.3 V). Finally, the cycle was repeated until failure. The specific test flow is shown in Figure 1.
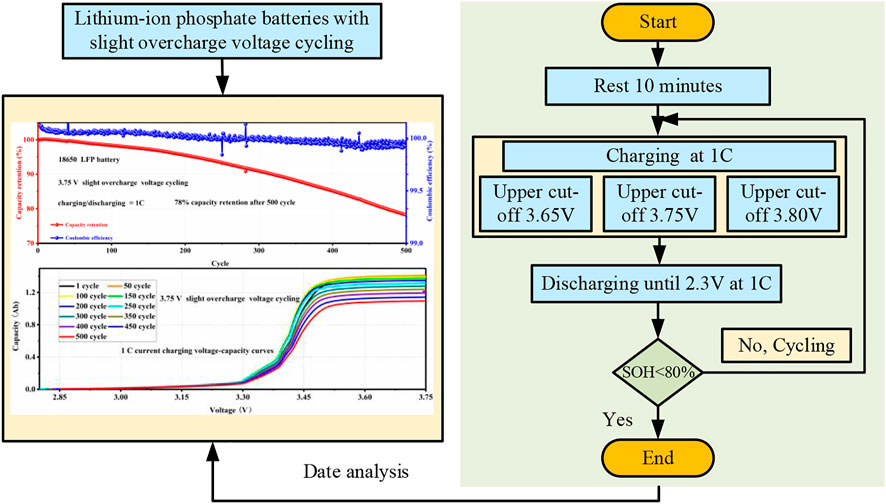
FIGURE 1. Specific test flow under slight overcharge.
To analyze the aging mechanism under slight overcharge voltage, the capacity retention, Coulombic efficiency, and capacity decay rate per 50 cycles are shown in Eq. 1–3. Then, the result of the experimental test is investigated based on ICA and DVA. IC and DV curves, as important means of battery non-destructive aging analysis, can reflect the oxidation reaction and phase transition of the battery during charging and discharging.
where
As shown in Figure 2, the capacity-voltage curve of the LFP battery is obtained under 3.75 V slight overcharge cycling. We can find that with the long-term cycling under overcharge voltage, the constant current charging time is significantly shortened as shown in Figure 2A, which indicates that the internal resistance increases with the long-term cycle. At the same time, the discharge capacity is shown in Figure 2B. We can see that after 300 cycles, the decay of capacity is significantly aggravated.
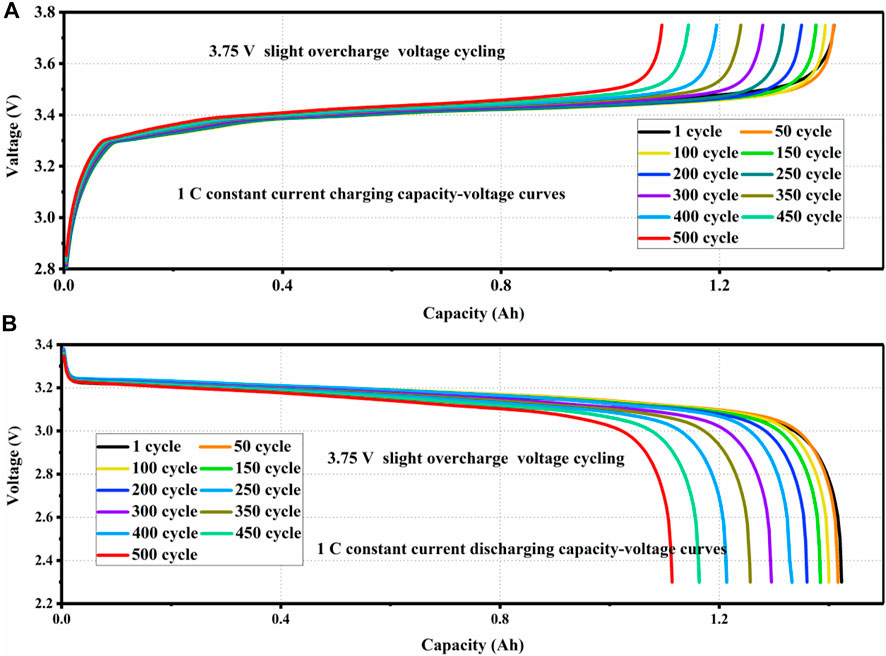
FIGURE 2. (A) Constant current charging capacity voltage curves and (B) constant current discharging capacity voltage curves.
As shown in Figure 3, after 2,300 cycles of normal upper cut-off charging voltage (i.e., 3.65 V) for the LFP battery, the capacity retention rate decreased to 80%. We can find that the long-term life is shown in the normal charging voltage at 1 C. At the same time, the Coulombic efficiency of the LFP cell shows a slight decline.
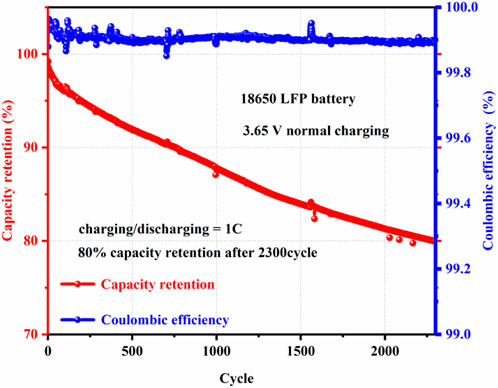
FIGURE 3. Capacity retention and Coulombic efficiency under normal charging voltage.
As shown in Figure 4A, after 500 cycles of 3.75 V slight overcharge for the LFP battery, the capacity retention decreased to 78%. It can be seen that the aging retention of the LFP battery is significantly accelerated after a 3.75 V slight overcharge voltage for the LFP battery. It shows that under the slight overcharge voltage cycling, the life of the battery is shortened by about 75%. At the same time, it can be seen that in the first 10 cycles of the LFP battery, considering the formation of a new LFP battery in the initial cycle process, the battery capacity increases slightly. According to the Coulombic efficiency in Figure 4A, it can be clearly seen that during the aging cycle of 3.75 V slight overcharge voltage for LFP cells, the Coulombic efficiency has a downward trend. Especially after 300 cycles, the Coulombic efficiency of the battery has an obvious decline trend. According to Figure 4B, the capacity retention of the LFP battery decreased to 77% after 500 cycles under 3.80 V slight overcharge voltage, which clearly shows that the Coulombic efficiency of the battery decreased significantly after 300 cycles. In summary, under the slight overcharge voltage cycling of the LFP battery (i.e., 3.75 V and 3.80 V), the life of the battery is shortened by about 75%.
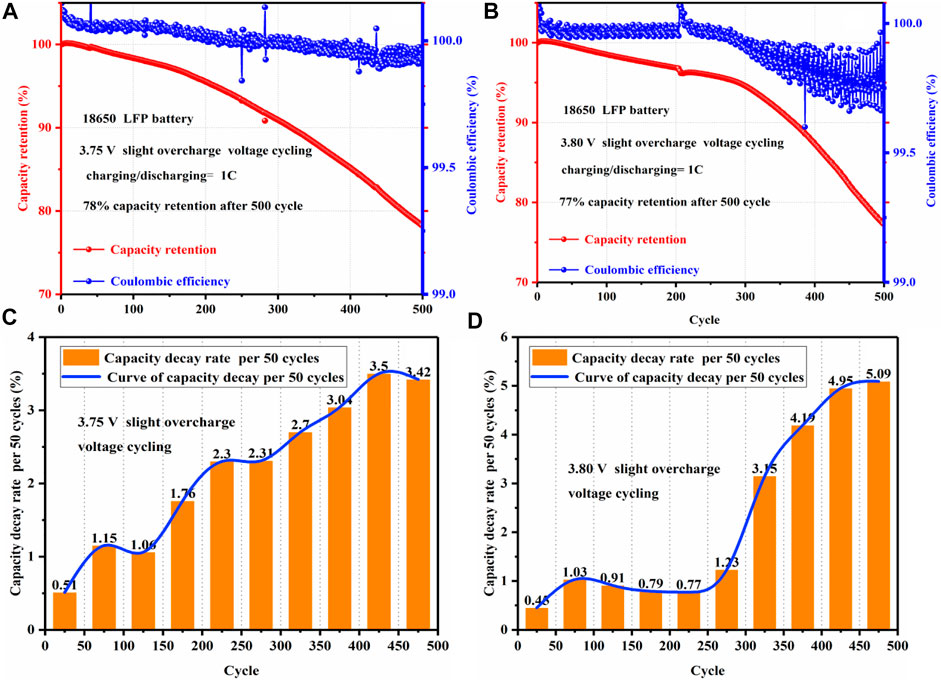
FIGURE 4. (A) Capacity retention and Coulombic efficiency under 3.75 V slight overcharge voltage, (B) capacity retention and Coulombic efficiency under 3.80 V slight overcharge voltage, (C) capacity decay rate per 50 cycles under 3.75 V slight overcharge voltage, and (D) capacity decay rate per 50 cycles under 3.80 V slight overcharge voltage.
According to the capacity decay rate of Figure 4C, it can be seen that after the first 50 cycles, the capacity decay rate of the battery is the lowest, about 0.51%, indicating that the slight overcharge voltage at the first 50 cycles has little impact on the life of LFP battery. With the increase of long-term cycling, the decay rate per 50 cycles tends to increase (i.e., about 1% to 2%) during the 50 to 300 cycles. During 300 to 500 cycles, the decay rate per 50 cycles is around 3%, and the maximum decay rate of 50 cycles is 3.5%. According to the aging decay rate of 3.80 V slight overcharge cycling for the LFP battery in Figure 4D, it is obvious that the decay rate of the battery is higher than 3% every 50 cycles at the end of 300 cycles, and the maximum decay rate per 50 cycles reaches 5.09%. In summary, the slight overcharge cycling of the LFP battery (i.e., 3.75 V and 3.80 V) significantly intensifies the aging rate of the battery, resulting in the life of the LFP battery being reduced by about 75%.
According to Figure 5A, the IC curve of constant current charging to a slight overcharge voltage (i.e., 3.75 V) at 1 C. Considering that the battery IC curve is disturbed by noise, the Gaussian filtering method is used to obtain a relatively smooth IC curve, in which the Gaussian template size is set as 24 and the standard deviation is set as 8.
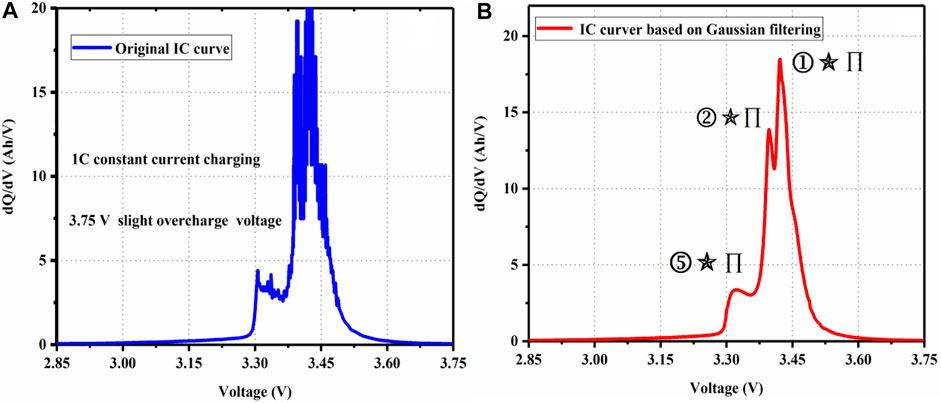
FIGURE 5. (A) Original IC curve under 3.75 slight overcharge voltage and (B) IC curve based on Gaussian filtering under 3.75 slight overcharge voltage.
The smooth IC curve is shown in Figure 5B, we can clearly see that the IC curve of the LFP battery has three obvious peaks under the slight overcharge voltage. The research shows that the three peaks of the LFP battery correspond to the specific combination of the positive and negative phase transition, and the LFP cathode material has a main phase transition platform (i.e., FePO4-LiFePO4) as the peak
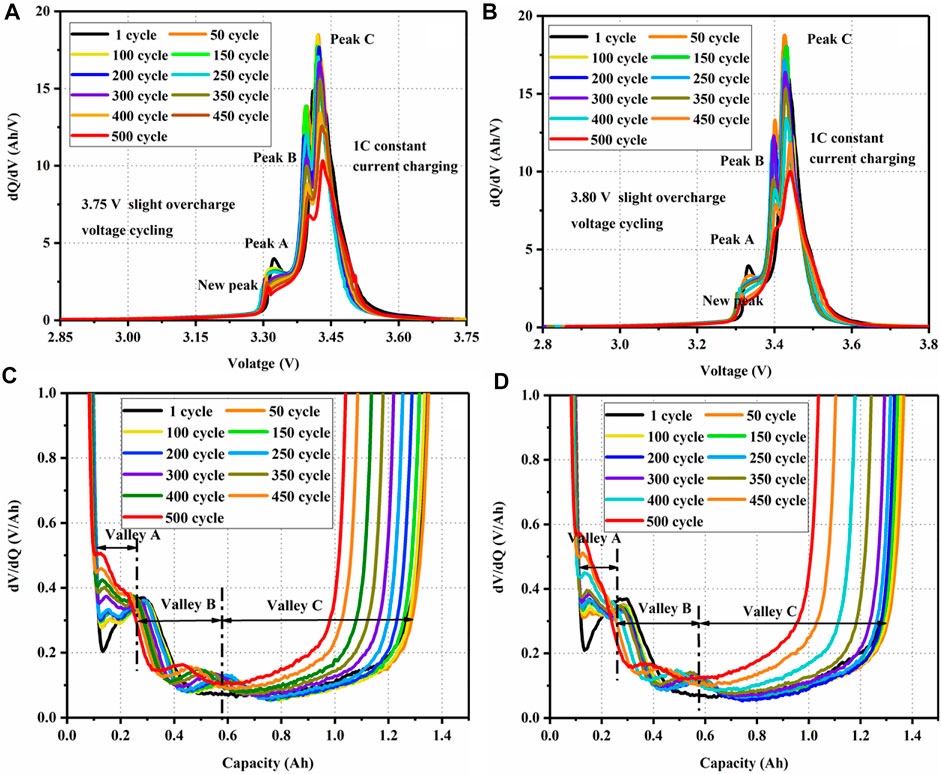
FIGURE 6. (A) IC curves under 3.75 V slight overcharge cycling, (B) IC curves under 3.80 V slight overcharge voltage cycling, (C) DV curves under 3.75 V slight overcharge voltage cycling, and (D) DV curves under 3.80 V slight overcharge voltage cycling.
During the slight overcharge cycling process for LFP cells, peak A has an obvious decline from the beginning cycles, which may be inferred from the formation cycles (Gao et al., 2017). The degeneration of peak B is inferred to be mainly caused by the loss of active material in the slight overcharge cycling. The decline of peak C is the most obvious, which is considered to be mainly caused by the irreversible loss of lithium ion (Ouyang et al., 2015). Especially after 300 cycles, the degeneration of peaks (i.e., peak B and peak C) is significantly increased. At the same time, the IC curves of slight overcharge cycling for LFP batteries showed a new peak, which inferred that the new phase or new reaction in the battery reaction process is caused by the destruction of electrode materials or the dissolution of metals.
In Figures 6C and D, it can be seen that there are three obvious valleys based on DVA. The valleys are marked as valley A, valley B, and valley C from low to high, respectively, corresponding to the areas of peak A, peak B, and peak C. DV curves can clearly reflect the corresponding relationship between battery capacity and valley. The state of charge (SOC) of the battery corresponding to valley A is about 10%, that of the battery corresponding to valley B is about 35%, and that of the battery corresponding to valley C is about 80%. It can be clearly seen that the areas of the three troughs have a declining trend with the intensification of the aging cycle. To sum up, it is considered that the loss of lithium is the main reason for battery degeneration, accompanied by the loss of active material. Meanwhile, the IC curves of slight overcharge cycling for LFP batteries showed a new peak.
2.2 Health indicators
Considering the uncontrollable discharge current during the actual use of the battery, the charging IC curve is selected to extract indirect health indicators. Based on the IC curves of the slight overcharge voltage cycling for LFP batteries, it can be seen that peak B and peak C decay seriously. Therefore, the charging IC curves (i.e., peak B and peak C) are selected for the extraction of health indicators.
As shown in Figure 7, the height of peak C and the area decrease, which indicates that the amount of lithium ion decreases. The peak C moves significantly to the right, indicating that the internal resistance is increasing with the long-term cycle. The half-width length of the peak C is related to the rate of redox reaction. The width of peak C becomes widened, which indicates that the rate of redox reaction decreases. The basic change trend of peak B is similar to that of peak C. In the early stages of slight overcharge voltage cycling, the change in peak B is not significant. This phenomenon infers that the loss of active material is not serious. Therefore, the height, area, position, and width of peaks C and B are extracted as potential health indicators. The grey relational analysis (GRA) is used to analyze the correlation between the SOH and the proposed potential health indicators. As shown in Table 1, the correlation coefficients between the proposed health factors and battery capacity degradation are strong under the aging of slightly overcharge voltage cycling for LFP batteries. It can be seen that the area, position, height, and width of the peaks have a good correlation with the SOH of the battery. Among them, the correlation of the area of peak C is the highest, which means that the loss of lithium has a strong correlation with capacity degradation. The correlations of peak B are lower than those of peak C. It is considered that the degradation of battery peak B is not significant during the initial cycle of slight overcharge cycling for LFP batteries.
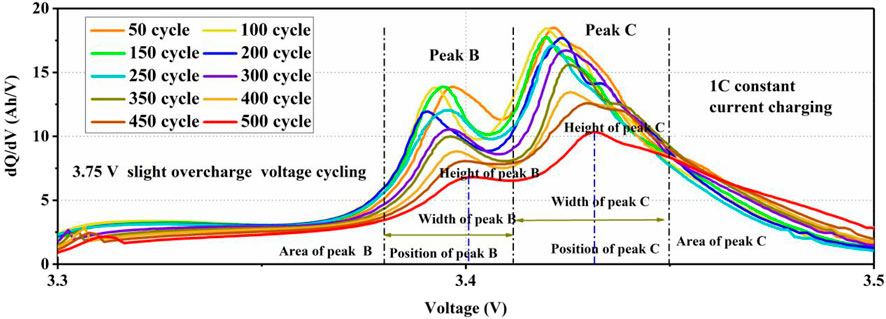
FIGURE 7. Extraction health indicators based on IC curves.
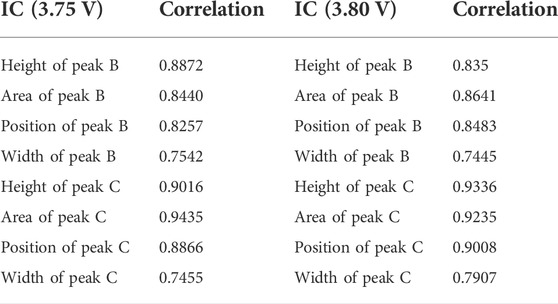
TABLE 1. Correlation between capacity and potential health indicators.
2.3 Syncretic health indicator
According to the GRA, the abovementioned eight characteristic parameters (i.e., peak B and peak C) are extracted as potential health indicators for SOH estimation for LFP batteries. Due to the small data samples under slight overcharge voltage (i.e., 3.75 and 3.80 V), machine learning methods are sensitive to redundant information. Therefore, the principal component analysis (PCA) is used to obtain a syncretic health indicator to reduce the dimension and noise. The specific algorithm steps of PCA are as follows:
Step 1. During the
Step 2. The covariance matrix
Step 3. The eigenvalues and eigenvectors of the correlation coefficient matrix are obtained.Step 4. The contribution rate
Step 5. The value of
2.4 Gaussian process regression
The GPR is introduced to obtain reliable and accurate SOH estimation for LFP batteries under slight overcharging cycling. The training samples are defined as
where
Among these, the noise is
Then, the posterior distribution of
where
Among these, the
Then, the Gaussian hyper-parameters are obtained, and the mean and variance values of estimation data are achieved. At the same time, the 95% confidence interval is calculated. For evaluating the estimation results, the root mean square error (RMSE), mean absolute error (MAE), and mean absolute percent error (MAPE) are used as follows in Eq. 18–20:
3 Results and discussion
The syncretic health indicator is extracted by ICA and PCA of LFP batteries under slight overcharge voltage cycling. The proposed health indicator and SOH are introduced to the GPR model for SOH estimation with a 95% confidence interval of sodium-ion batteries; 50% of the data is set as the training data, and the remaining 50% of the data is set as the test data.
Figure 8A represents the estimation result of SOH under 3.75 V slight overcharge voltage, and the error distribution is shown in Figure 8B. Figure 8C represents the estimation result of SOH under 3.80 V slight overcharge voltage, and the error distribution is shown in Figure 8D. The dark area in Figures 6A and C is the 95% confidence interval for SOH estimation. We can see that the estimated SOH is close to the real data, and the width of 95% confidence interval is narrow, which indicates that the SOH estimation has higher reliability. It can be seen in Figures 8B and D that the relative estimation error of SOH is within 3%.
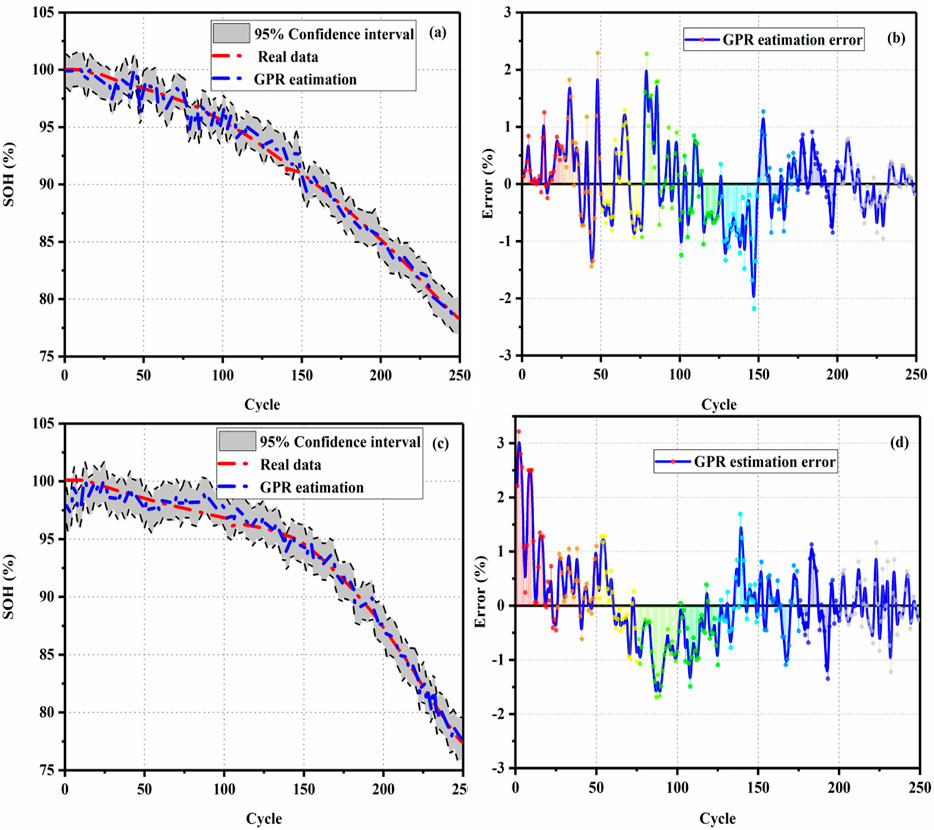
FIGURE 8. (A) SOH estimation under 3.75 V slight overcharge cycling, (B) error under 3.75 V slight overcharge voltage cycling, (C) SOH estimation under 3.80 V slight overcharge voltage cycling, and (D) error under 3.80 V slight overcharge voltage cycling.
To verify the robustness of the proposed method, the training data are set as 1/3 and 1/4, respectively, under 3.75 V slight overcharge voltage cycling. The rest of the data is set as the test data. The results of SOH estimation and errors are shown in Figure 9. The SOH estimation and error under 1/3 training data are shown in Figures 9A and B. The SOH estimation and error under 1/4 training data are shown in Figures 9C and D. The evaluation index of the result is shown in Figure 9E.
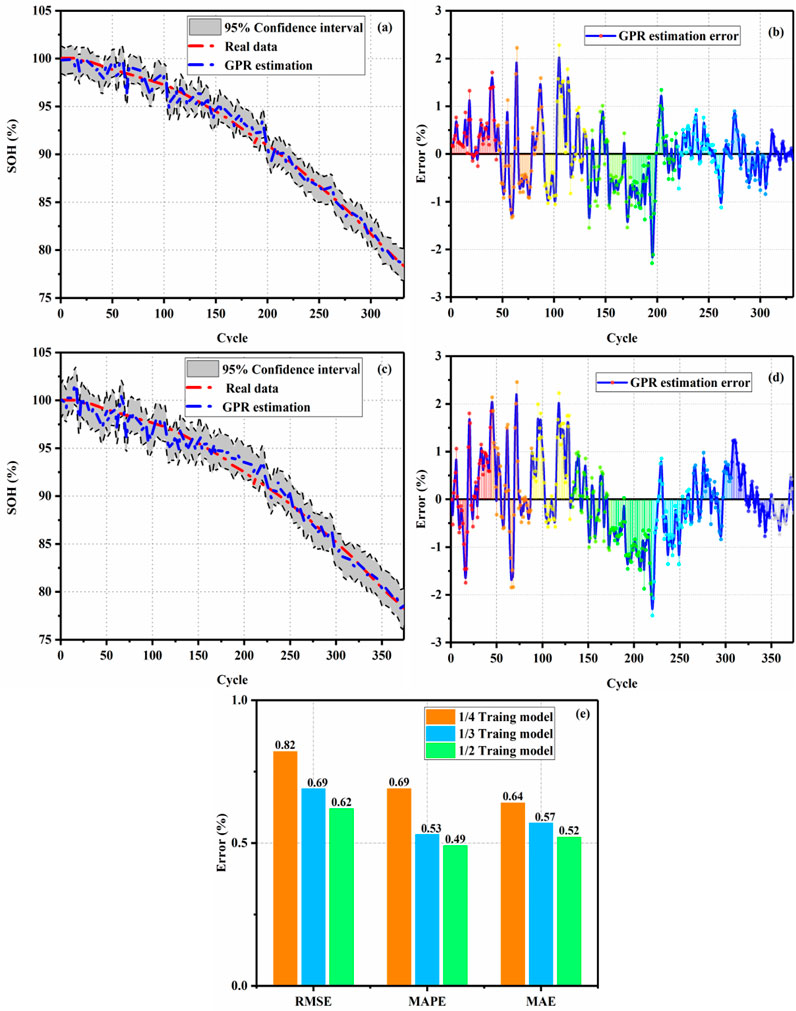
FIGURE 9. (A) SOH estimation under 1/3 training data, (B) error under 1/3 training data, (C) SOH estimation under 1/4 training data, and (D) SOH estimation under 1/4 training data. (E) Evaluation index for results.
We can see that when the training samples are reduced, the proposed method can obtain good SOH estimation, and the error of the estimation results is within 3%. When the training data increases, the evaluation indicators (i.e., RMSE, MAPE, and MAE) of SOH estimation results tend to decrease slightly. Although the model can obtain more information when the training period increases, the accuracy of SOH estimation is improved. In summary, the proposed method not only has good accuracy with a 95% confidence interval but also has strong robustness.
To further show the superiority of the GPR method, the proposed method is compared with the existing BPNN with particle swarm optimization (BPNN-PSO) and ELM methods. As shown in Figure 10, the 50% cycle data are introduced as the training data, and the rest of the data is set as test data for SOH estimation under different methods. It is obvious to see that although BPNN-PSO and ELM can achieve SOH estimation, the accuracy of those methods is low and cannot characterize the confidence interval of SOH estimation. To better demonstrate the superiority of the GPR method, Figure 10E shows the SOH estimation performance under different estimation methods, respectively. We can find that the estimation performances of the proposed methods are all below 1%. In summary, the GPR method-based ICA can achieve reliable and accurate SOH estimation under a small sample of slight overcharge voltage cycling for the LFP battery Liu F. et al., 2021.
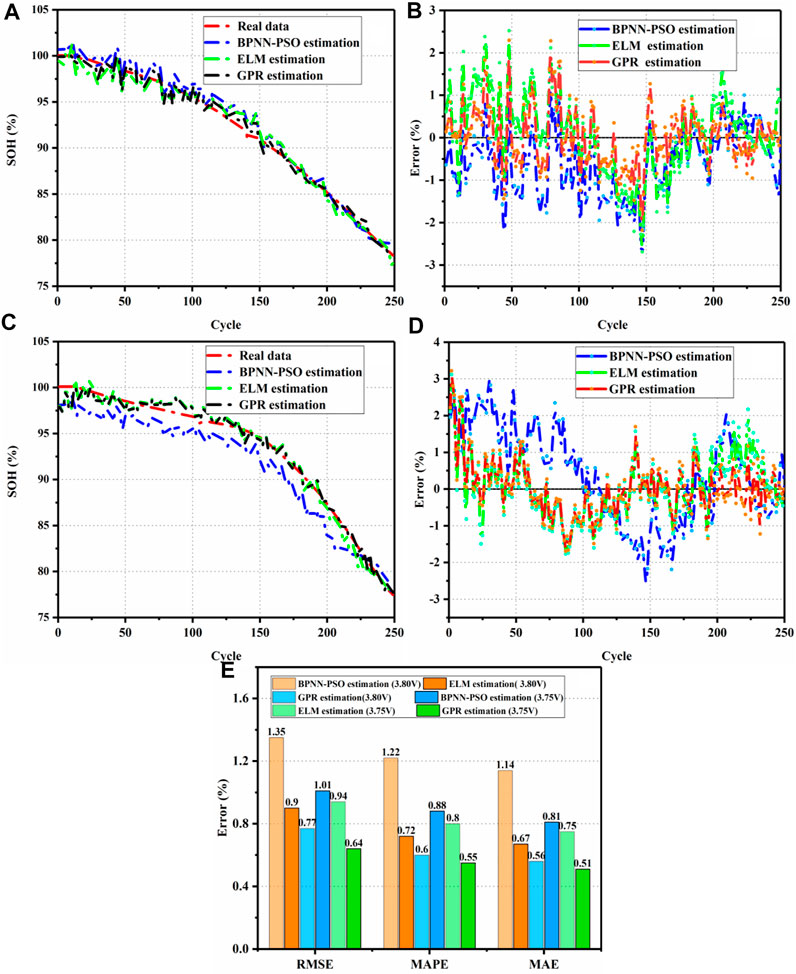
FIGURE 10. (A) SOH estimation under 3.75 V slight overcharge cycling, (B) error under 3.75 V slight overcharge voltage cycling, (C) SOH estimation under 3.80 V slight overcharge voltage cycling, and (D) error under 3.80 V slight overcharge voltage cycling. (E) Evaluation index for results.
4 Conclusion
In this study, the LFP batteries are investigated under slight overcharge voltage cycling (i.e., an upper cut-off voltage of 3.65, 3.75, and 3.80 V). An online and accurate SOH estimation model is established based on ICA and GPR. The aging mechanism under slight overcharge cycling is discussed based on ICA and DVA. The health indicators are extracted, and correlations are analyzed based on IC curves (i.e., peak B and peak C). Then, the fusion health indicator is obtained based on PCA. Finally, the GPR method is established for SOH estimation under a small sample of slight overcharge voltage cycling. The main conclusions are as follows:
1) The study investigated LFP batteries under slight overcharge voltage cycling (i.e., 3.75 and 3.80 V). The life of the battery is shortened by about 75% compared with the normal voltage (i.e., 3.65 V).
2) The study is explained by the aging mechanism for LFP batteries under slight overcharge cycling based on ICA and DVA, showing that loss of lithium ion is the main reason for battery degeneration, accompanied by loss of active material.
3) The eight potential indirect health indicators (i.e., parameters from peak B and peak C) are extracted, and a syncretic health indicator is obtained. In comparison with the existing methods, the proposed method exhibits good robustness and higher accuracy for SOH estimation, with the error being limited to 3%.
In the future, more experiments on LFP batteries under different environmental conditions will be investigated to further verify the proposed method.
Data availability statement
The original contributions presented in the study are included in the article/Supplementary Material; further inquiries can be directed to the corresponding author.
Author contributions
MY: conceptualization, methodology, supervision, project administration, and writing—review and editing. MW: conceptualization, methodology, formal analysis, and investigation. QW formal analysis, investigation, and visualization. GL: methodology and experiment. YM: formal analysis and investigation.
Acknowledgments
Thanks for the support of the National Natural Science Foundation of China (No. 51805041), the Science and Technology Innovation Team of Shaan’xi Provincial (2020TD0012), and Henan Outstanding Foreign Scientist Workshop (No. GZS2022004). WM expresses gratitude for an excellent doctoral project in central universities CHD (No. 300203211251).
Conflict of interest
The authors declare that the research was conducted in the absence of any commercial or financial relationships that could be construed as a potential conflict of interest.
Publisher’s note
All claims expressed in this article are solely those of the authors and do not necessarily represent those of their affiliated organizations, or those of the publisher, the editors, and the reviewers. Any product that may be evaluated in this article, or claim that may be made by its manufacturer, is not guaranteed or endorsed by the publisher.
References
Chen, Z., Zhao, H., Zhang, Y., Shen, S., Shen, J., and Liu, Y. (2022). State of health estimation for lithium-ion batteries based on temperature prediction and gated recurrent unit neural network. J. Power Sources 521, 230892. doi:10.1016/j.jpowsour.2021.230892
Dubarry, M., Liaw, B. Y., Chen, M. S., Chyan, S. S., Han, K. C., Sie, W. T., et al. (2011). Identifying battery aging mechanisms in large format Li ion cells. J. Power Sources 196 (7), 3420–3425. doi:10.1016/j.jpowsour.2010.07.029
Feng, X., Li, J., Ouyang, M., Lu, L., and He, X. (2013). Using probability density function to evaluate the state of health of lithium-ion batteries. J. Power Sources 232, 209–218. doi:10.1016/j.jpowsour.2013.01.018
Gao, Y., Jiang, J., Zhang, C., Zhang, W., and Ma, Z. (2017). Lithium-ion battery aging mechanisms and life model under different charging stresses. J. Power Sources 356, 103–114. doi:10.1016/j.jpowsour.2017.04.084
Hu, X., Xu, L., Lin, X., and Pecht, M. (2020). Battery lifetime prognostics. Joule 4 (2), 310–346. doi:10.1016/j.joule.2019.11.018
Hu, X. (2022). Preface for feature topic on advanced battery management for electric vehicles. Automot. Innov. 5, 105–106. doi:10.1007/s42154-022-00182-4
Huang, H., Meng, J., Wang, Y., Cai, L., Peng, J., Wu, J., et al. (2022). An enhanced data-driven model for lithium-ion battery state-of-health estimation with optimized features and prior knowledge. Automot. Innov. 5, 134–145. doi:10.1007/s42154-022-00175-3
Juarez-Robles, D., Vyas, A. A., Fear, C., Jeevarajan, J. A., and Mukherjee, P. P. (2020). Overcharge and aging analytics of Li-ion cells. J. Electrochem. Soc. 167 (9), 090547. doi:10.1149/1945-7111/ab9569
Khaleghi, S., Hosen, M. S., Karimi, D., Behi, H., Beheshti, S. H., Van Mierlo, J., et al. (2022). Developing an online data-driven approach for prognostics and health management of lithium-ion batteries. Appl. Energy 308, 118348. doi:10.1016/j.apenergy.2021.118348
Li, J., Ye, M., Gao, K., Xu, X., Wei, M., and Jiao, S. (2021). Joint estimation of state of charge and state of health for lithium-ion battery based on dual adaptive extended Kalman filter. Int. J. Energy Res. 45 (9), 13307–13322. doi:10.1002/er.6658
Li, X., Yuan, C., Wang, Z., He, J., and Yu, S. (2022). Lithium battery state-of-health estimation and remaining useful lifetime prediction based on non-parametric aging model and particle filter algorithm. eTransportation 11, 100156. doi:10.1016/j.etran.2022.100156
Li, X., Wang, Z., Zhang, L., Zou, C., and Dorrell, D. D. (2019). State-of-health estimation for Li-ion batteries by combing the incremental capacity analysis method with grey relational analysis. J. Power Sources 410, 106–114. doi:10.1016/j.jpowsour.2018.10.069
Li, X., Yuan, C., Li, X., and Wang, Z. (2020). State of health estimation for Li-Ion battery using incremental capacity analysis and Gaussian process regression. Energy 190, 116467. doi:10.1016/j.energy.2019.116467
Li, Y., Stroe, D. I., Cheng, Y., Sheng, H., Sui, X., and Teodorescu, R. (2021). On the feature selection for battery state of health estimation based on charging–discharging profiles. J. Energy Storage 33, 102122. doi:10.1016/j.est.2020.102122
Liu, J., Duan, Q., Feng, L., Ma, M., Sun, J., and Wang, Q. (2020). Capacity fading and thermal stability of LiNiCoMnO2/graphite battery after overcharging. J. Energy Storage 29, 101397. doi:10.1016/j.est.2020.101397
Liu, F., Liu, Y., Su, W., and Jiao, C. (2021). Online estimation of lithium-ion batteries state of health during discharge. Int. J. Energy Res. 45 (7), 10112–10128. doi:10.1002/er.6502
Liu, K., Shang, Y. L., Ouyang, Q., and Widanage, W. D. (2021). A data-driven approach with uncertainty quantification for predicting future capacities and remaining useful life of lithium-ion battery. IEEE Trans. Ind. Electron. 68, 3170–3180. doi:10.1109/tie.2020.2973876
Liu, J., Peng, W., Yang, M., Jin, K., Liu, P., Sun, J., et al. (2022). Quantitative analysis of aging and detection of commercial 18650 lithium-ion battery under slight overcharging cycling. J. Clean. Prod. 340, 130756. doi:10.1016/j.jclepro.2022.130756
Ma, Y., Wu, L., Guan, Y., and Peng, Z. (2020). The capacity estimation and cycle life prediction of lithium-ion batteries using a new broad extreme learning machine approach. J. Power Sources 476, 228581. doi:10.1016/j.jpowsour.2020.228581
Ouyang, M., Chu, Z., Lu, L., Li, J., Han, X., Feng, X., et al. (2015). Low temperature aging mechanism identification and lithium deposition in a large format lithium iron phosphate battery for different charge profiles. J. Power Sources 286, 309–320. doi:10.1016/j.jpowsour.2015.03.178
Pang, H., Guo, L., Wu, L., and Jin, X. (2020). An enhanced temperature-dependent model and state-of-charge estimation for a Li-Ion battery using extended Kalman filter. Int. J. Energy Res. 44 (9), 7254–7267. doi:10.1002/er.5435
Reniers, J. M., Mulder, G., and Howey, D. A. (2019). Review and performance comparison of mechanical-chemical degradation models for lithium-ion batteries. J. Electrochem. Soc. 166 (14), A3189–A3200. doi:10.1149/2.0281914jes
Richardson, R. R., Osborne, M. A., and Howey, D. A. (2017). Gaussian process regression for forecasting battery state of health. J. Power Sources 357, 209–219. doi:10.1016/j.jpowsour.2017.05.004
Semeraro, C., Caggiano, M., Olabi, A. G., and Dassisti, M. (2022). Battery monitoring and prognostics optimization techniques: Challenges and opportunities. Energy 255, 124538. doi:10.1016/j.energy.2022.124538
Shu, X., Li, G., Zhang, Y., Shen, J., Chen, Z., and Liu, Y. (2020). Online diagnosis of state of health for lithium-ion batteries based on short-term charging profiles. J. Power Sources 471, 228478. doi:10.1016/j.jpowsour.2020.228478
Tian, J., Xu, R., Wang, Y., and Chen, Z. (2021). Capacity attenuation mechanism modeling and health assessment of lithium-ion batteries. Energy 221, 119682. doi:10.1016/j.energy.2020.119682
Vichard, L., Ravey, A., Venet, P., Harel, F., Pelissier, S., and Hissel, D. (2021). A method to estimate battery SOH indicators based on vehicle operating data only. Energy 225, 120235. doi:10.1016/j.energy.2021.120235
Wang, S., Fernandez, C., Yu, C., Fan, Y., Cao, W., and Stroe, D. I. (2020). A novel charged state prediction method of the lithium ion battery packs based on the composite equivalent modeling and improved splice Kalman filtering algorithm. J. Power Sources 471, 228450. doi:10.1016/j.jpowsour.2020.228450
Wang, S., Takyi-Aninakwa, P., Jin, S., Yu, C., Fernandez, C., and Stroe, D. I. (2022). An improved feedforward-long short-term memory modeling method for the whole-life-cycle state of charge prediction of lithium-ion batteries considering current-voltage-temperature variation. Energy 254, 124224. doi:10.1016/j.energy.2022.124224
Wei, M., Ye, M., Wang, Q., Xu, X., and Twajamahoro, J. P. (2022). Remaining useful life prediction of lithium-ion batteries based on stacked autoencoder and Gaussian mixture regression. J. Energy Storage 47, 103558. doi:10.1016/j.est.2021.103558
Wu, L., Liu, K., and Pang, H. (2021). Evaluation and observability analysis of an improved reduced-order electrochemical model for lithium-ion battery. Electrochim. Acta 368, 137604. doi:10.1016/j.electacta.2020.137604
Wu, L., Pang, H., Geng, Y., Liu, X., Liu, J., and Liu, K. (2022). Low-complexity state of charge and anode potential prediction for lithium-ion batteries using a simplified electrochemical model-based observer under variable load condition. Int. J. Energy Res. 46 (9), 11834–11848. doi:10.1002/er.7949
Xiong, R., Li, L., and Tian, J. (2018). Towards a smarter battery management system: A critical review on battery state of health monitoring methods. J. Power Sources 405, 18–29. doi:10.1016/j.jpowsour.2018.10.019
Xiong, R., Sun, W., Yu, Q., and Sun, F. (2020). Research progress, challenges and prospects of fault diagnosis on battery system of electric vehicles. Appl. Energy 279, 115855. doi:10.1016/j.apenergy.2020.115855
Yang, D., Zhang, X., Pan, R., Wang, Y., and Chen, Z. (2018). A novel Gaussian process regression model for state-of health estimation of lithium-ion battery using charging curve. J. Power Sources 384, 387–395. doi:10.1016/j.jpowsour.2018.03.015
Yao, F., He, W., Wu, Y., Ding, F., and Meng, D. (2022). Remaining useful life prediction of lithium-ion batteries using a hybrid model. Energy 248, 123622. doi:10.1016/j.energy.2022.123622
Keywords: lithium-ion batteries, slight overcharge, state of health, aging mechanism, incremental capacity analysis
Citation: Ye M, Wei M, Wang Q, Lian G and Ma Y (2022) State of health estimation for lithium-ion batteries based on incremental capacity analysis under slight overcharge voltage. Front. Energy Res. 10:1001505. doi: 10.3389/fenrg.2022.1001505
Received: 23 July 2022; Accepted: 05 September 2022;
Published: 23 September 2022.
Edited by:
Ranjusha Rajagopalan, Central South University Changsha, ChinaReviewed by:
Jiaolong Zhang, Dongguan University of Technology, ChinaShunli Wang, Southwest University of Science and Technology, China
Copyright © 2022 Ye, Wei, Wang, Lian and Ma. This is an open-access article distributed under the terms of the Creative Commons Attribution License (CC BY). The use, distribution or reproduction in other forums is permitted, provided the original author(s) and the copyright owner(s) are credited and that the original publication in this journal is cited, in accordance with accepted academic practice. No use, distribution or reproduction is permitted which does not comply with these terms.
*Correspondence: Min Ye, bWluZ3llQGNoZC5lZHUuY24=