- 1Department of Power System Study, Electric Power Research Institute of China Southern Power Grid, Guangzhou, China
- 2Dispatching and Control Center, China Southern Power Grid, Guangzhou, China
Multi-frequency oscillation is a new type of electromagnetic oscillation issue in power systems caused by the increasing penetration of renewable power and power electronic devices. This study investigates the risks and influencing factors of multi-frequency oscillation in a prosumer power network where a variety of converter-based resources exists. For the feasibility of analysis, the internal and external stability of the study system are defined and analyzed based on sequence impedance models. Analysis results show the impacts of control parameters of prosumers, length of cables, transformer ratios, local grid strength, and power and capacity of prosumers on the risks of oscillation. Accordingly, despite the poorly tuned control parameters, the study system has higher risks of multi-frequency oscillation with longer cables, lower-rated voltage of cables, larger capacity, and inductive power consumption of the neighboring prosumers. Frequency-domain analysis results are demonstrated by EMTDC/PSCAD simulations.
Introduction
In recent years, problems of multi-frequency oscillation have been raised by the increasing penetration of renewables and power electronics. This article studies the risks of multi-frequency oscillation in a prosumer power network where different converter-based resources are closely integrated.
A modern prosumer power network is heavily dependent on the stable operation of a variety of converter-based resources, including distributed renewable generation, energy storage, bidirectional EV charging, controllable loads, and more. In the published articles, distributed voltage control algorithms are proposed to overcome challenges of voltage regulation in multiphase unbalanced distribution networks with photovoltaic (PV) generation (Li et al., 2020). Another study proposed a data-driven distributional robust co-optimization model for the peer-to-peer energy trading and network operation of interconnected microgrids (Li et al., 2021). For better bridging PV power to the grid, a power-decoupled current-source inverter has been proposed which can provide the required reactive power compensation to regulate the PCC voltage (Wang M. H et al., 2021). Different types and applications of a family of elastic load demand control technologies called electric springs have been comprehensively discussed, which enhance the power quality and system stability in a renewable-penetrated power network (Wang M. et al., 2021). Applications of controllable series capacitors in HVDC scenarios to enhance the system stability have been discussed (Xue and Zhang, 2017; Xue et al., 2019). With the increasing penetration of converters in a prosumer power network, the risks of multi-frequency oscillation are continuously raised and need to be assessed in details.
The multi-frequency oscillation issue has been identified along with a number of events. In October 2009, southern Texas, sub-synchronous oscillation (SSO) events occurred in a DFIG-based wind farm connected to a series-compensated line (Adams et al., 2012), which was later identified as sub-synchronous control interaction (SSCI). In 2011, Hebei Guyuan, China, hundreds of SSCI events were observed in DFIG-based wind farms connected to a series-compensated grid. In July 2015, Xinjiang Hami, China, an SSO event occurred in a PMSG-based wind farm connected to the local grid without series compensation, tripping off thermal power stations 300 km away (Li et al., 2017). In England, SSCI events have occurred in a PMSG-based offshore wind farm connected to the onshore grid through two submarine cables when one cable was out of service (Shuai et al., 2018). In the North Sea, 451 Hz oscillation was reported in offshore wind farms integrated through MMC-HVDC (Buchhagen et al., 2016). In 2013, Germany, several oscillation events over 250 Hz occurred in the offshore AC cable grid of project BorWin1 (Buchhagen et al., 2015). In 2014, Guangdong Nan’ao, China, SSCI events occurred between a DFIG-based wind farm and the sending end of an MMC-HVDC system (Lv et al., 2015).
For DFIG-based problems, the on-site data of 58 SSCI events that occurred in Hebei Guyuan, China, were analyzed, and the dominant impacting factors were investigated (Xie et al., 2017). Negative resistance from induction generation effect and control of DFIG were responsible for these oscillation events. Detailed modeling of the DFIG wind farm integration system, including the VSC-HVDC system, was presented to comprehensively study the possible oscillatory modes (Kunjumuhammed et al., 2016). A mitigation method using TCSC has been proposed to provide auxiliary damping control based on synchrophasor data (Mahish and Pradhan, 2020). Leon and Solsona (2015) discussed methods to mitigate oscillations using supplementary damping control of DFIG at the rotor-side and grid-side converter without additional hardware. Ali et al. (2020) studied a method to eliminate DFIG-based SSCI by properly tuning the proportional gain of the rotor-side converter controller with no need of supplementary damping.
For PMSG-based problems, Fan and Miao (2018) comparatively studied the 4 Hz oscillation in Texas and the 30 Hz oscillation in west China based on eigenvalues and indicated the impacts of PLL parameters on the oscillation frequency. Du et al. (2017) studied the impacts of PLL parameters based on the modal resonance method. SSCI of PMSG-based wind farms’ integration through MMC-HVDC was studied based on eigenvalue analysis and the impedance method (Wang et al., 2019; Lyu et al., 2016). Despite PLL and current loop control, the circulating current control of MMC has big impacts on the oscillation risks between wind farms and the MMC rectifier. Lyu et al. (2018) also proposed a method to optimize the control parameters of MMC to improve the oscillation stability. An impedance network model of PMSG-based wind farms has been discussed (Liu and Xie, 2018; Tao et al., 2020), which aggregates many impedance models of individual turbines in a wind farm so that impacts of distributed wind speed on different turbines could be analyzed. Liu and Sun (2014) studied the stability of an offshore wind farm integrated through medium voltage AC collection and HVDC transmission based on sequence impedance models. Besides, Du et al. (2019) discussed dynamic aggregation of parallel connected wind turbines of the same type and found the oscillation risk to be raised by the increasing number of turbines. A complete impedance model of the PMSG-based wind power conversion system considering the machine-side effects has been developed, which is used when the DC capacitor is small and the machine-side effects cannot be ignored (Xue et al., 2021).
Given the reviewed studies, this article investigates the multi-frequency oscillation risks in a prosumer power network where a variety of converter-based resources exists. Published articles are limited when it comes to impacts of neighboring power electronic devices and cables on the oscillation risks. In this study, focuses are put on multi-frequency oscillations beneath the typical bandwidth of the current loop of converters (about 800 Hz). Discussions of factors affecting the high-frequency oscillation issue (over 1 kHz) such as skin effects of cables and sampling delays of VSC controllers are not included in this article. Nevertheless, high-frequency oscillations rarely happen in power networks beneath 35 kV due to sufficient damping from relatively large resistance–reactance ratios.
The rest of this article is arranged as follows. Section2 discusses the basic principle to analyze the study system. Section 3 presents/develops the impedance models. Section 4 and Section 5 discusses the internal and external stability and how they would be affected by different influencing factors. Section 6 demonstrates the analysis results based on PSCAD simulations. Finally, Section 7 concludes the study.
General Discussions
Stability Criteria
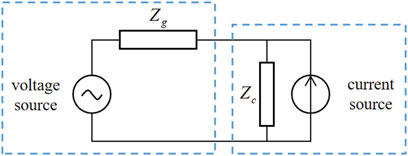
This study is based on analysis of small-signal sequence impedance models of components in a prosumer power network. A system of grid-connected converters is considered a current source (converter) connected to a voltage source (grid) with their impedance as shown in Figure 1 (Sun, 2011). The voltage source impedance is Zg(s) and the current source impedance is Zc(s). The system would be stable under the following three conditions:
1 the grid side is open-loop stable when it is open-circuit;
2 the converter side is open-loop stable when connected to an ideal voltage source; and
3 the transfer function of Zg(s)/Zc(s) satisfies the Nyquist Criteria in the Nyquist diagram.
In this analysis, one key question is how to define the “grid side” and the “converter side” and on what principles should we group the passive components into one or another. The answer is that the impedance interface could be arbitrarily set, and the oscillation stability at that interface would be determined by the Nyquist Criteria as long as the open-loop stability of both sides is validated. Theoretically, the entire system is stable only when it is stable at all possible interfaces. Since it is neither feasible nor necessary to examine all interfaces, practically, only the interfaces of high risk are selected and examined.
For convenience of analysis, in this study, the Nyquist Criteria is further translated into the criteria based on a bode diagram. According to the Nyquist Criteria, the study system would be stable as long as the transfer function Zg(s)/Zc(s) has a positive phase margin, which means that the phase difference between Zg(s) and Zc(s) is less than 180° when their magnitudes are equal. Therefore, given a bode diagram depicting Zg(s) and Zc(s), the stability criteria is as follows: the study system is stable as long as the difference of their phase response is less than 180° at all frequencies where their magnitudes cross to each other. Otherwise, the system is unstable. One advantage of using a bode diagram is that it shows frequency information and can directly tell the frequency of possible oscillations.
Configuration of the Study System
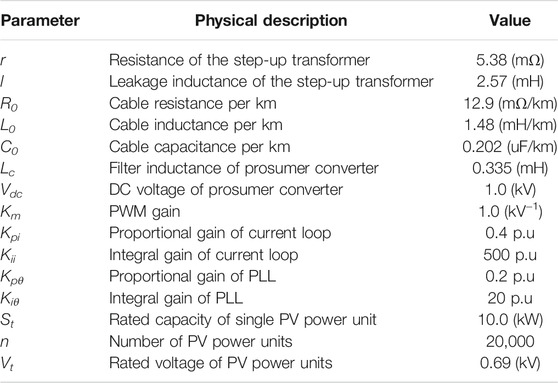
A schematic diagram of the study system is depicted in Figure 2. A PV power station is integrated through an AC cable in parallel with a neighboring VSC device, which could be but is not limited to energy storage or an EV charging station controlled as a current source to the local network. The neighboring VSC component could also be the interface of a smart home system, where all the controllable loads are integrated to the DC link represented by a voltage source. Therefore, the proposed study system is feasible for the analysis of prosumer power networks with a variety of VSC-based prosumer resources. In the rest of this article, all the analysis and simulations are based on key parameters of the study system listed in Table 1.
It takes two steps to analyze the study system in Figure 2. First, we need to verify the open-loop stability of the PV branch when it is connected to an ideal voltage source (with zero impedance), including the PV power station, step-up transformer, and cable as depicted in Figure 3. This open-loop stability verification is called the internal stability analysis. Second, once the internal stability is verified, the local grid accounts for the voltage source and the rest of the system is aggregated as the current source to study the oscillation risks. This is called the external stability analysis. It is reasonable to assume that the open-loop stability of the neighboring VSC is promised by the manufacturer and needs no extra verification. In other words, verification of the internal stability of the PV branch is a precondition of the external stability analysis of the entire study system. The oscillation stability of the study system is only validated as long as both the internal and external stability are validated.

FIGURE 3. Schematic diagram of the voltage source and current source in the internal stability analysis.
Internal Stability
The internal stability in this study is defined as the open-loop stability of the PV branch (including the PV power station, step-up transformer, and cable) when it is connected to an ideal voltage source. As shown in Figure 3, the cable-side impedance Zca(s) accounts for the voltage source impedance, and the PV station impedance Zf(s) accounts for the current source impedance. Again, one question is how to determine the impedance interface between the voltage and current sources in this case. The answer is that it does not matter as long as the open-loop stability of the defined current source is verified. In this analysis, the current source is defined so since the open-loop stability of the PV power generation unit is promised by the manufacturer.
External Stability
The external stability is defined as the oscillation stability between the local grid (voltage source) and the integrated prosumers (current source) including the PV power station in parallel with the neighboring VSC as depicted in Figure 4 in this case. The grid-side impedance is Zg(s) and the converter-side impedance is Zc(s). In the external stability analysis, it is assumed that the internal stability of the PV branch has been verified.

FIGURE 4. Schematic diagram of the voltage source and current source in the external stability analysis.
Impedance Modeling and Verification
Sequence impedance models include positive, negative, and zero sequence impedance. The focus of this study is laid on positive sequence impedance for it has higher risks of oscillation than negative and zero sequence impedance due to dq transform. The impacts of zero sequence impedance are mainly under a condition of three-phase imbalance, which is not covered in the topic of this article.
Impedance of a Single VSC-Based Resource
Converter-based resources in the study system are based on full-rated converters (FRCs). The converter control is based on conventional dq decoupling current control and phase lock loop (PLL). The detailed positive-sequence impedance model of grid-connected VSC Zp(s) was derived and verified in the previous study (Cespedes and Sun, 2014) as follows:
The reference direction of the AC current is from the converter to the grid. C1∠ϕc1 is the phasor of dq voltage reference as follows:
and Hi(s) is the PI control function of the current loop as follows:
and TPLL is the closed-loop function of PLL as follows:
In the above equations, Lc is the filter inductance of VSC, Km the PWM gain, Vdc the DC voltage, ω1 the fundamental frequency, Kd the dq decoupling gain in the current loop, Gi(s) the AC current sampling delay, Kf(s) the grid voltage feedforward compensation, Gv(s) the grid voltage sampling delay, V1 the grid voltage magnitude, I1∠ϕi1 the AC current phasor, Kpi and Kii the PI parameters of the current loop, and Kpθ and Kiθ the PI parameters of PLL.
This model has sufficient details but needs to be specified to highlight the purpose of this study. Assumptions are made below:
1 with the focus of this study being from the subsynchronous to the medium frequency range, the AC current and voltage sampling delays are ignored (which have effects only in the high frequency range) so Gi(s) = Gv(s) = 1;
2 the DC voltage is assumed to be a rated constant and KmVdc = 1; and
3 the dq decoupling gain Kd is designed to be equal to ω1Lc.
The sampling delays only affect the high-frequency (over 1 kHz) oscillation stability of grid-connected converters (Sun et al., 2019). With the sampling delays ignored, the validity of discussions of oscillations beneath 800 Hz are not undermined.
With the above assumptions, the impedance model of a single VSC could be derived from Eq. 1, 2 as follows:
Note that when Hi(s) is tuned based on per unit values of AC voltages and currents, the term I1/V1 in Eq. 5 is also in per unit value and I1/V1 is 1.0 under the rated power output.
Based on Eq. 5 and parameters in Table 1, Figure 5 shows how the VSC impedance would be affected by current loop control parameters, PLL control parameters, and the operating point of power (active power and power factor).
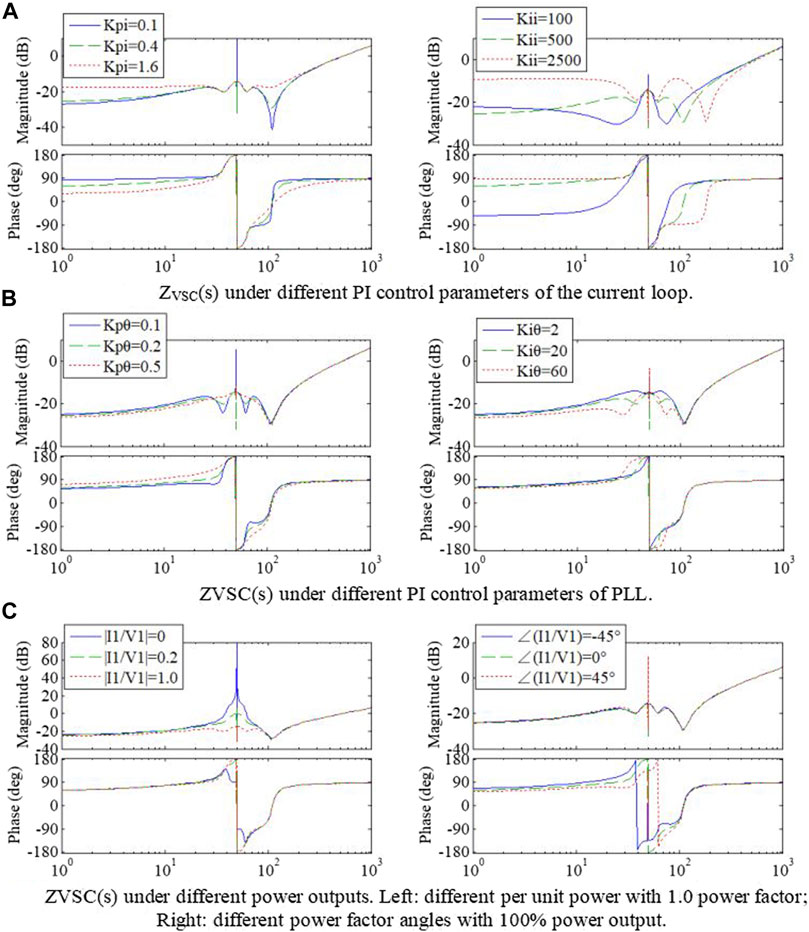
FIGURE 5. Bode diagrams of the impedance model of a single VSC under different control parameters and operating points. X-axis in Hz. (A) ZVSC(s) under different PI control parameters of the current loop. (B) ZVSC(s) under different PI control parameters of PLL. (C) ZVSC(s) under different power outputs. Left: different per unit power with 1.0 power factor; Right: different power factor angles with 100% power output.
From Figure 5A, larger Kpi makes less magnitude dip and more phase margin, both of which are helpful to enhance the stability. Increasing Kii would enlarge the impedance magnitude in the subsynchronous range, but lead the frequency of magnitude dip to higher frequency and decrease the phase margin from super-synchronous to that frequency.
From Figure 5B, both larger proportional and integral gain of PLL make the negative-resistance frequency range (of phase over ±90°) around the fundamental frequency expand and raise the risks of oscillation.
From Figure 5C, the impedance magnitude decreases as the output power increases. The main effect of power factor change is to shift the phase response in the sub- and super-synchronous ranges.
Conclusively, under-tuned PI gains of the current loop and over-tuned PI gains of PLL and high power output would decrease the impedance magnitude, expand the frequency range of negative damping, and therefore increase the oscillation risks.
Impedance of Cable and Transformer
As shown in Figure 3, the impedance model Zca(s) seen from the PV power station is used for the internal stability analysis. A frequency-dependent model (derived from and equivalent to the distributed parameter model, but presented in a pi-circuit format) represents the impedance of the cable. r, l are the resistance and leakage inductance of the step-up transformer at the high voltage side. X(ω) and Y(ω) are the series and shunt frequency dependent impedance of the cable, respectively. According to the theory of the transmission line, the accurate X(ω) and Y(ω) are as follows:
where L0 is the cable inductance per km, C0 the cable capacitance per km, R0 the cable resistance per km, and d the length of cable in km. Based on the accurate models of cable impedance, Zca(ω) is as follows:
This accurate model is complicated and cannot be presented in the s-domain. Based on the Taylor series (till first-order of sine and second-order of cosine), as long as the phase
Given parameters of R0, L0, and C0 in Table 1, this s-domain approximation is reasonable when ωd is less than 2×10⁴ (kmHz). For instance, the approximated model is valid beneath 2 kHz for a 10-km cable or 5 kHz for a 4-km cable. This model is feasible for oscillation analysis of most prosumer power networks.
To verify the impedance model of the cable plus transformer, Figure 6 compares the impedance magnitudes of Zca(s) modeled by Eq. 9 and scanned from the frequency-dependent cable model in PSCAD. The scanned impedance is in agreement with the theoretical model, especially beneath the typical bandwidth of the current loop of VSC (500–800 Hz). The minimum magnitude (at 400 Hz) of the theoretical model is smaller than the scanned value, possibly due to the extra resistance brought by the skin effect of the cable. Note that the y-axis is in the log scale, the actual difference is small, and the minimum magnitude has little impact on the oscillation stability. In the high frequency range over 600 Hz, the scanned impedance has other LC resonances which are not reflected by the theoretical model. Conclusively, the developed model is of good accuracy to analyze the majority of multi-frequency oscillation issues in a prosumer power network in sub-synchronous, super-synchronous, and current loop control bandwidth range.
Impedance of the PV Branch Seen From the Local Grid
The impedance model of the PV branch is used for the external stability analysis. It consists of the AC cable, the step-up transformer, and the PV power station observed from the local grid. Zf(s) is the total impedance of the PV station seen at the high voltage side of the transformer, which is as follows:
where k is the total transformer ratio (may include more than one step-up transformer) and n is the number of turbines.
In actual projects, the resistance of the transformer is negligible compared to |Zf(s)|. From the last subsection 3.B, the pi-circuit model based on the aggregated parameter is a good approximation when ωd is less than 2×10⁴ (kmHz). Accordingly, the impedance model of the PV branch is derived as follows:
Impedance characteristics of Zw(s) under different active power generations and different lengths of cable are depicted in Figure 7. Active power variation has significant impacts in the sub/super-synchronous frequency range (20–100 Hz). Higher active power makes the impedance magnitude of the PV branch smaller and less stable. Longer cable would lead negative resistance (of phase over ±90°) to lower frequency range and increase the oscillation risks.
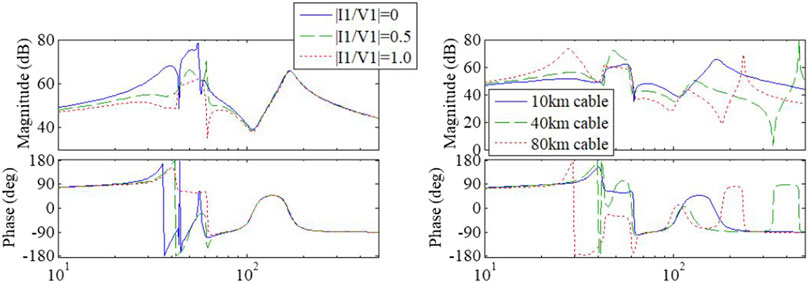
FIGURE 7. Zw(s) under different per unit active power (left, with 10 km cable) and length of cable (right, with full-rated power output). X-axis in Hz.
Impedance of the Local Grid
In this study, the local grid impedance Zg(s) is simplified as a resistance-inductance branch to represent the short-circuit ratio (SCR) of the local grid
where Lg and Rg are the grid inductance and resistance, respectively.
Distributed capacitance of grid networks would lead to parallel resonance of Zg(s) in the high frequency range (over 800 Hz). Yet the oscillation risks in the high frequency range are beyond the discussions of this article, and the grounding capacitance is not considered in the grid impedance model.
Internal Stability Analysis
As discussed in Section 2, the internal stability of the PV branch is to be verified as a precondition of the external stability analysis of the prosumer power network. For this purpose, Zca(s) and Zf(s) account for the voltage and current source impedance, respectively, as depicted in Figure 3. Based on the parameters in Table 1, bode diagrams of Zca(s) and Zf(s) are depicted in Figure 8. Zca(s) is plotted based on different lengths of cable. It is seen that a power network under a 220-kV cable is stable regardless of the length of the cable.
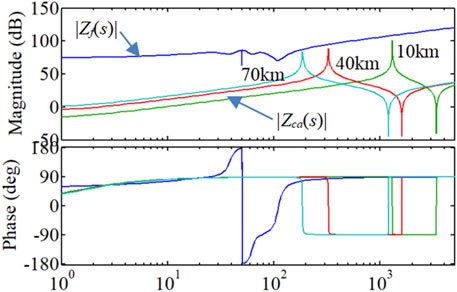
FIGURE 8. Bode diagrams of Zf(s) and Zca(s) of different lengths of 220-kV cable for the internal stability analysis. X-axis in Hz. Cable length: 10, 40, 70 (km).
However, the rated voltage of a prosumer power network is much lower, and the oscillation stability would be undermined as the rated voltage of the network becomes lower. To study the impacts of the rated voltage of the cable on the oscillation stability, we analyze the internal stability under a 35-kV cable. From Eq. 10, the magnitude of Zf(s) is proportional to the square of the total transformer ratio. For a 35-kV cable, |Zf(s)| would be much smaller and have intersections with |Zca(s)| in the bode diagram. Once the phase difference between Zf(s) and Zca(s) is close to or larger than 180° at the frequency of magnitude intersection, the phase margin of Zca(s)/Zf(s) in the Nyquist diagram would be close to zero or even negative, and the power network becomes unstable.
Figure 9 shows the bode diagram of Zf(s) and Zca(s) and the Nyquist diagram of Zca(s)/Zf(s) based on 35-kV cables of 10 and 15 km. Both the bode and Nyquist diagrams are in agreement and show that the PV branch is unstable with a 15-km 35-kV cable. In the 10-km case, the magnitudes intersect at 90 Hz, where the phase difference is still less than 180° with positive damping. In the 15-km case, the magnitudes intersect at 60 Hz, where the phase difference is over 180°, which refers to a super-synchronous oscillation of 60 Hz.
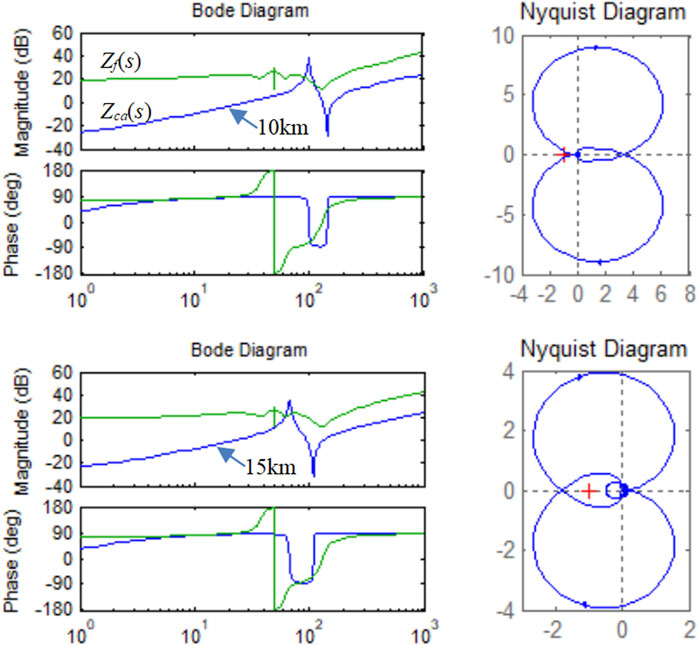
FIGURE 9. Bode diagrams of Zca(s) and Zf(s) and Nyquist diagrams of Zca(s)/Zf(s) for the internal stability analysis based on 35-kV cable of 10 and 15 km.
Conclusively, due to the large total transformer ratio, the internal stability is ensured with high-voltage cable. The stability margin would be smaller with lower-rated voltage of cable applied in a prosumer power network. In this case, the PV branch becomes open-loop unstable with 35-kV cable to a certain length (about 10–15 km). The oscillation risks would be further raised in a power network at lower-rated voltage with longer collector cable.
External Stability Analysis
In the external stability analysis of the prosumer power network, the PV branch is assumed to be an open-loop stable current source with an impedance of Zw(s). The impedance of the total current source consists of the PV branch and the neighboring VSC device as depicted in Figure 4 as follows:
Zn(s) is the impedance of the neighboring VSC seen from the local grid. It has the same form of ZVSC(s) in math but with independent parameters. The voltage source impedance is the grid impedance Zg(s). “//” is the parallel operator. Impacts of key influencing factors are presented in the case studies below.
Power of the Neighboring VSC
The neighboring VSC represents an energy storage or EV charging station in a prosumer power network with bidirectional active and reactive power. Figure 10 shows the impacts of different power of the neighboring VSC on Zc(s), together with the grid impedance of a short-circuit ratio (SCR) of 1.0, 2.5, and 5. The length of the cable is 30 km. The PV power is full-rated output. The rated capacity of the neighboring VSC is 20% of the PV station.
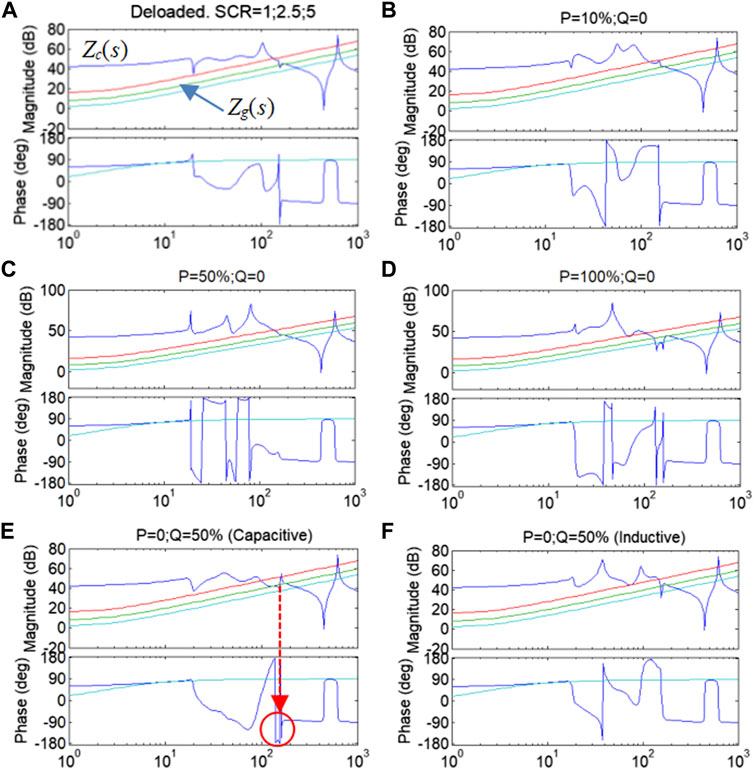
FIGURE 10. Zg(s) (SCR = 1; 2.5; 5) and Zc(s) for external stability analysis with different power of the neighboring VSC. Case (e) is unstable with negative damping at frequencies of magnitude intersections. X-axis in Hz. (A) Deloaded, SCR=1;2,5;5. (B) P=10%;Q=0. (C) P=50%;Q=0. (D) P=100%;Q=0. (E) P=0;Q=50% (Capacitive). (F) P=0;Q=50% (Inductive).
When the grid strength or transformer ratio changes, the magnitude response will shift accordingly so the frequency of magnitude intersection changes, while the phase response remains the same. Since the grid impedance is almost purely inductive over 10 Hz, focuses are laid on the frequencies where the phase of Zc(s) is smaller than −90°, which is called the negative-resistance range (NRR) in this study. The phase difference of NRR is over 180°, so the total resistance is negative, and the system would be unstable once there are magnitude intersections in NRR.
In this case, analysis results show that oscillations are most likely to happen at about 150 Hz when the neighboring VSC outputs half-rated capacitive reactive power (or absorbs inductive power) as indicated in Figure 10E. In other power conditions, although the magnitudes intersect at 150–200 Hz, the phase difference in that frequency range is almost always less than 180°; thus, the system is stable with a positive phase margin. Conclusively, inductive power consumption of the neighboring VSC would undermine the oscillation stability of the prosumer power network.
Length of the Collector Cable
Figure 11 shows the impacts of different lengths of cable of 10–70 km. The NRR with potential magnitude intersections is highlighted. The PV power is full-rated output. The neighboring VSC is full-rated output in the unity power factor, and its rated capacity is 20% of the PV station. Figure 11B has the same case as Figure 10D, presented again for better comparison.
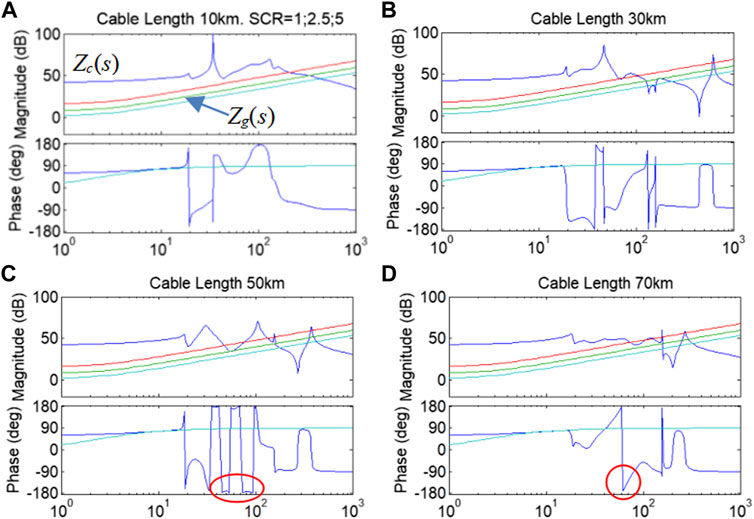
FIGURE 11. Zg(s) (SCR = 1; 2.5; 5) and Zc(s) for external stability analysis with different lengths of cable. X-axis in Hz. (A) Cable length 10 km. SCR=1;2.5;5. (B) Cable length 30 km. (C) Cable length 50 km. (D) Cable length 70 km.
As the results present, the power network is stable with a 10-km cable. For a 30-km cable, there is a very narrow NRR in between 100 and 200 Hz which does not present notable odds of oscillation, and the system is still stable. For the length of cable over 50 km, oscillations at 50–80 Hz are likely to happen under a weak local grid (SCR<2.5) as indicated in Figures 11C,D. Conclusively, oscillations are more likely to happen with a long collector cable in a weak local grid.
Capacity Ratio Between Prosumers
Figure 12 shows the impacts of different capacity ratios between prosumers. The length of cable is 30 km. Both the PV power station and the VSC are full-rated output in the unity power factor. As the results present, larger capacity of the neighboring VSC makes |Zc(s)| smaller and increases the risks of oscillation. When the capacity ratio of VSC to the PV station is 20%, the NRR with impedance magnitude intersections is narrow and the system is considered stable. When the capacity ratio is increased to 80%, there is a wide NRR from 40 Hz to about 150 Hz. Oscillations could happen in this frequency range, and the exact frequency of oscillation depends on the grid strength. Conclusively, oscillations are more likely to happen as the capacity of the neighboring VSC increases.
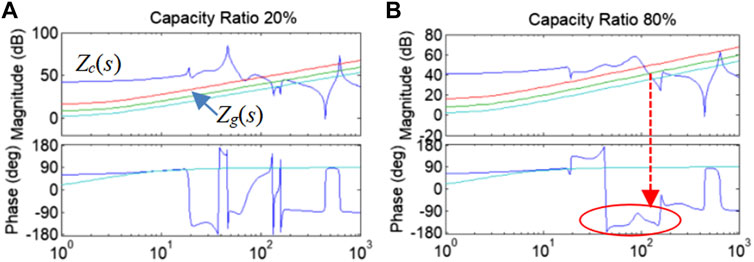
FIGURE 12. Zg(s) (SCR = 1; 2.5; 5) and Zc(s) for external stability analysis with different capacity ratios of the neighboring VSC to the PV station. X-axis in Hz. (A) Capacity Ratio 20%. (B) Capacity Ratio 20%.
Simulation and Demonstration
In this section, time-domain simulations based on PSCAD demonstrate the frequency domain analysis of selected cases with high risks of oscillations in Section 4 and Section 5.
Impacts of the Rated Voltage of Network
According to the analysis in Section 4, the internal stability of the PV branch is undermined at lower-rated voltage of the power network. In this case, a system with a 35-kV cable is simulated to demonstrate the frequency domain analysis in Figure 9. The PV power station of 200 MW is connected to a frequency-dependent model of cable through 0.69/35 kV transformers. Figure 13 shows three-phase voltage and current at the 35-kV side of transformers and the frequency spectrum of voltage when the cable is 15 km. Figure 14 shows the results when the cable is 10 km. Accordingly, when the cable is 15 km, there are mainly 61 Hz oscillation and a small oscillation of 39 Hz (symmetrical with respect to the fundamental). When the cable is 10 km, the system is stable. Simulation results are in agreement with the frequency domain analysis in Section 4, which demonstrate that the oscillation risks are raised in a prosumer power network at lower-rated voltage.
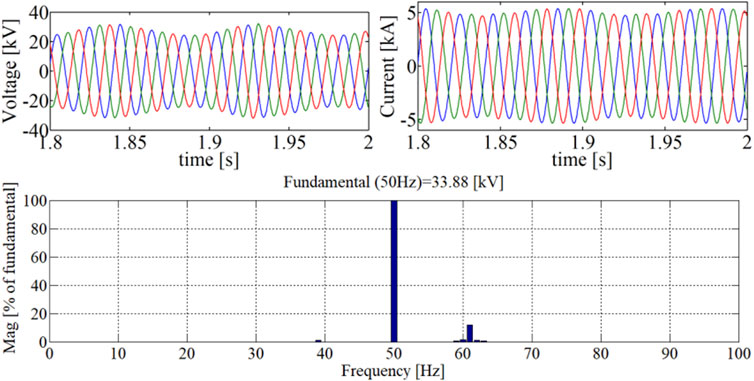
FIGURE 13. Three-phase voltage and current at the 35-kV side of transformers and the FFT of voltage with 35-kV cable of 15 km.
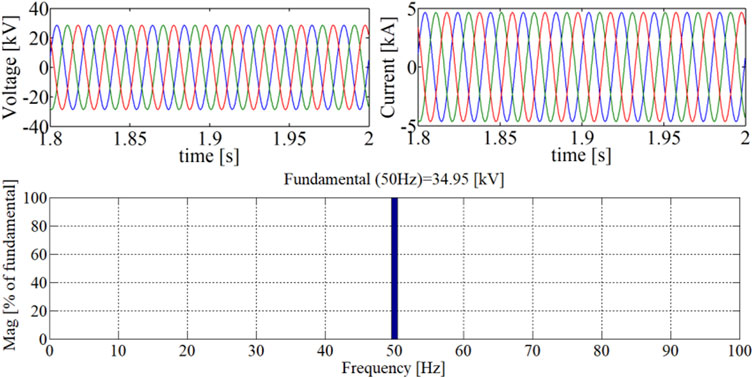
FIGURE 14. Three-phase voltage and current at the 35-kV side of transformers and the FFT of voltage with 35-kV cable of 10 km.
Impacts of Power of the Neighboring VSC
In this case, the study system is simulated under different power conditions of the neighboring VSC as discussed in Figure 10. Figure 15 shows three-phase voltage and current at the local grid side and the frequency spectrum of the voltage with SCR of 2.5 and 50% capacitive reactive power output of the neighboring VSC. According to the simulation results, there is about 162 Hz oscillation under this operating point, which is in agreement with the frequency domain analysis in Section 5.A. The system oscillates with only certain values of SCR and becomes stable when SCR is increased to 5.0. The simulation results demonstrate that the capacitive reactive power output of the neighboring VSC undermines the oscillation stability. In a real prosumer power network, however, a large proportion of reactive power output of prosumers is rare.
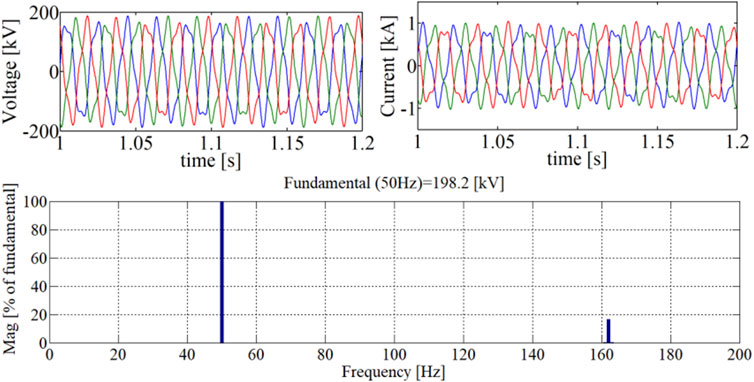
FIGURE 15. Three-phase voltage and current at the local grid side and the FFT of voltage with 50% capacitive reactive power output of VSC. SCR = 2.5.
Impacts of the Length of Cable
The stability of the study system also depends on the compatibility between the length of the cable and the SCR of the local grid. In this case, the power network is simulated with a cable of 70 km. The SCR of the grid is 2.0. Power outputs of both the PV station and VSC are full-rated in the unity power factor. As shown in Figure 16, the system mainly has 78 Hz oscillation. The system becomes stable when the SCR is increased to over 2.5. The simulation results are in agreement with the frequency domain analysis discussed in Section 5.B, which demonstrates that the system oscillates when a prosumer resource is integrated into a weak local grid through long distance cable.
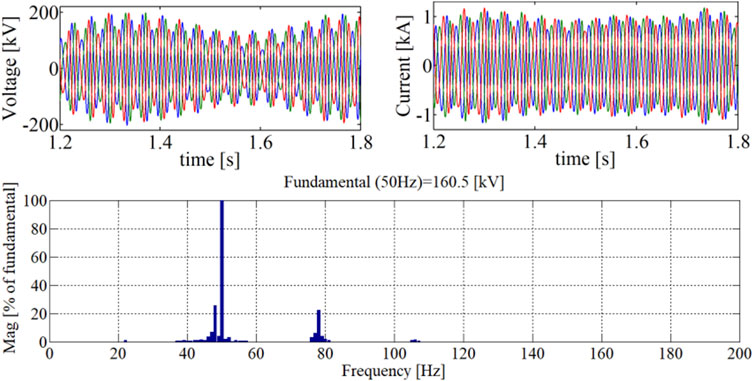
FIGURE 16. Three-phase voltage and current at the local grid side and the FFT of voltage with a cable of 70 km. SCR = 2.0.
Impacts of the Capacity Ratio of Prosumers
In this case, the study system is simulated under different installed capacity ratios of the neighboring VSC resource to the PV power station. The length of cable is 30 km, and all prosumers are full-rated output in the unity power factor. The system is stable when the capacity ratio is 20%. Figure 17 shows three-phase voltage and current at the local grid side and the frequency spectrum of the voltage when the VSC capacity is enlarged to 80% of the PV station. There is about 148 Hz oscillation under this condition, which is in agreement with the frequency domain analysis in Section 5.C. The simulation results demonstrate that the oscillation stability of the study system is undermined as a neighboring VSC device of high capacity is equipped.
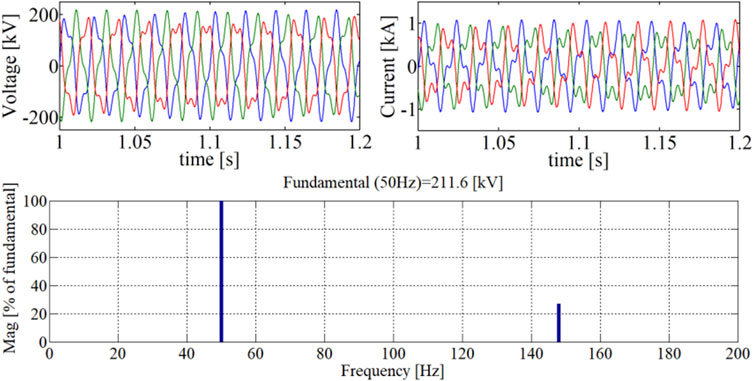
FIGURE 17. Three-phase voltage and current at the local grid side and the FFT of voltage when the capacity ratio is 80%. SCR = 5.0.
Conclusion
This article has studied the multi-frequency oscillation stability in a prosumer power network consisting of converter-based resources (PV power station, energy storage, EV charging station, etc.) based on sequence impedance models. Focuses are put on the impacts of the collector cable and the neighboring VSC resource on the system stability. The open-loop stability of the PV branch (including the PV power station, step-up transformer, and cable) connected to an ideal voltage source is defined as the internal stability of the study system. The internal stability must be verified as a precondition of the external stability of the entire power network. The impedance model of each sector of the study system has been developed for the internal and external stability analysis. Results of frequency domain analysis are demonstrated by time-domain simulations based on PSCAD. In general, the neighboring VSC resource and the collector cable have negative effects on the oscillation stability of the power network. Despite poorly tuned control parameters, frequency domain analysis and time-domain simulations are in agreement in showing how lower-rated voltage of the network, longer cable, higher capacity of the neighboring VSC resource, and its inductive power consumption would increase the risks of multi-frequency oscillations of the study system.
Data Availability Statement
The raw data supporting the conclusions of this article will be made available by the authors, without undue reservation.
Author Contributions
Conceptualization and formal analysis, ZY; investigation, ZY; resources and supervision, CH; validation and writing—original draft preparation, ZY; writing—review and editing, CH. All authors have read and agreed to the published version of the manuscript.
Conflict of Interest
Authors ZY and CH were employed by the company China Southern Power Grid.
The remaining authors declare that the research was conducted in the absence of any commercial or financial relationships that could be construed as a potential conflict of interest.
Publisher’s Note
All claims expressed in this article are solely those of the authors and do not necessarily represent those of their affiliated organizations, or those of the publisher, the editors, and the reviewers. Any product that may be evaluated in this article, or claim that may be made by its manufacturer, is not guaranteed or endorsed by the publisher.
References
Adams, J., Carter, C., and Huang, S. (2012). “ERCOT Experience with Sub-synchronous Control Interaction and Proposed Remediation,” in PES T&D 2012, Orlando, USA, 7-10 May 2012. doi:10.1109/tdc.2012.6281678
Ali, M. T., Zhou, D., Song, Y., Ghandhari, M., Harnefors, L., and Blaabjerg, F. (2020). Analysis and Mitigation of SSCI in DFIG Systems with Experimental Validation. IEEE Trans. Energ. Convers. 35 (2), 714–723. doi:10.1109/tec.2019.2953976
Buchhagen, C., Greve, M., Menze, A., and Jung, J. (2016). “Harmonic Stability—Practical Experience of a TSO,” in Proceedings of the 15th Wind Integration Workshop, Vienna, Austria, 15-17 November 2016.
Buchhagen, C., Rauscher, C., Menze, A., and Jung, J. (2015). “BorWin1-first Experiences with Harmonic Interactions in Converter Dominated Grids,” in International ETG Congress 2015; Die Energiewende-Blueprints for the New Energy Age, Bonn, Germany, 17-18 Nov 2015.
Cespedes, M., and Jian Sun, J. (2014). Impedance Modeling and Analysis of Grid-Connected Voltage-Source Converters. IEEE Trans. Power Electron. 29 (3), 1254–1261. doi:10.1109/tpel.2013.2262473
Du, W., Chen, X., and Wang, H. (2017). PLL-induced Modal Resonance of Grid-Connected PMSGs with the Power System Electromechanical Oscillation Modes. IEEE Trans. Sustain. Energ. 8 (4), 1581–1591. doi:10.1109/tste.2017.2695563
Du, W., Dong, W., Wang, H., and Cao, J. (2019). Dynamic Aggregation of Same Wind Turbine Generators in Parallel Connection for Studying Oscillation Stability of a Wind Farm. IEEE Trans. Power Syst. 34 (6), 4694–4705. doi:10.1109/tpwrs.2019.2920413
Fan, L., and Miao, Z. (2018). Wind in Weak Grids: 4 Hz or 30 Hz Oscillations? IEEE Trans. Power Syst. 33 (5), 5803–5804. doi:10.1109/tpwrs.2018.2852947
Kunjumuhammed, L., Pal, B., Oates, C., and Dyke, K. (2016). “Electrical Oscillations in Wind Farm Systems: Analysis and Insight Based on Detailed Modeling,” in 2016 IEEE Power and Energy Society General Meeting (PESGM), Boston, USA, 17-21 July 2016.
Leon, A. E., and Solsona, J. A. (2015). Sub-Synchronous Interaction Damping Control for DFIG Wind Turbines. IEEE Trans. Power Syst. 30 (1), 419–428. doi:10.1109/tpwrs.2014.2327197
Li, J., Khodayar, M. E., Wang, J., and Zhou, B. (2021). Data-Driven Distributionally Robust Co-optimization of P2P Energy Trading and Network Operation for Interconnected Microgrids. IEEE Trans. Smart Grid 12 (6), 5172–5184. doi:10.1109/tsg.2021.3095509
Li, J., Liu, C., Khodayar, M. E., Wang, M.-H., Xu, Z., Zhou, B., et al. (2020). Distributed Online VAR Control for Unbalanced Distribution Networks with Photovoltaic Generation. IEEE Trans. Smart Grid 11 (6), 4760–4772. doi:10.1109/tsg.2020.2999363
Li, M. J., Yu, Z., Xu, T., and He, J. (2017). Study of Complex Oscillation Caused by Renewable Energy Integration and its Solution. Power Syst. Tech. 41 (4), 1034–1042. doi:10.13335/j.1000-3673.pst.2016.3049
Liu, H., and Sun, J. (2014). Voltage Stability and Control of Offshore Wind Farms with AC Collection and HVDC Transmission. IEEE J. Emerg. Sel. Top. Power Electron. 2 (4), 1181–1189. doi:10.1109/jestpe.2014.2361290
Liu, H., and Xie, X. (2018). Impedance Network Modeling and Quantitative Stability Analysis of Sub-/Super-synchronous Oscillations for Large-Scale Wind Power Systems. IEEE Access 6, 34431–34438. doi:10.1109/access.2018.2849830
Lv, J., Dong, P., Shi, G., Cai, X., and Li, X. (2015). Subsynchronous Oscillation and its Mitigation of MMC-Based HVDC with Large Doubly-Fed Induction Generatorbased Wind Farm Integration. Proc. CSEE 35 (19), 4852–4860. doi:10.13334/j.0258-8013.pcsee.2015.19.002
Lyu, J., Cai, X., and Molinas, M. (2016). Frequency Domain Stability Analysis of MMC-Based HVdc for Wind Farm Integration. IEEE J. Emerg. Sel. Top. Power Electron. 4 (1), 141–151. doi:10.1109/jestpe.2015.2498182
Lyu, J., Cai, X., and Molinas, M. (2018). Optimal Design of Controller Parameters for Improving the Stability of MMC-HVDC for Wind Farm Integration. IEEE J. Emerg. Sel. Top. Power Electron. 6 (1), 40–53. doi:10.1109/jestpe.2017.2759096
Mahish, P., and Pradhan, A. K. (2020). Mitigating Subsynchronous Resonance Using Synchrophasor Data Based Control of Wind Farms. IEEE Trans. Power Deliv. 35 (1), 364–376. doi:10.1109/tpwrd.2019.2929616
Shuai, L., Sharma, R., Pirzada, S., et al. (2018). “Eigenvalue-based Stability Analysis of Sub-synchronous Oscillation in an Offshore Wind Power Plant,” in 17th International Workshop on Large-Scale Integration of Wind Power into Power Systems as well as on Transmission Networks for Offshore Wind Power Plants, Stockholm, Sweden, Oct 16-18 2018.
Sun, J. (2011). Impedance-Based Stability Criterion for Grid-Connected Inverters. IEEE Trans. Power Electron. 26 (11), 3075–3078. doi:10.1109/tpel.2011.2136439
Sun, J., Vieto, I., Larsen, E. V., and Buchhagen, C. (2019). ““Impedance-Based Characterization of Digital Control Delay and its Effects on System Stability,” in 2019 20th Workshop on Control and Modeling for Power Electronics (COMPEL), Toronto, Canada, 17-20 June 2019. doi:10.1109/compel.2019.8769719
Tao, S., Zhao, L., Liu, Y., and Liao, K. (2020). Impedance Network Model of D-PMSG Based Wind Power Generation System Considering Wind Speed Variation for Sub-synchronous Oscillation Analysis. IEEE Access 8, 114784–114794. doi:10.1109/access.2020.3003754
Wang, M., He, Y., Xu, X., Dong, Z., and Lei, Y. (2021). A Review of AC and DC Electric Springs. IEEE Access 9, 14398–14408. doi:10.1109/access.2021.3051340
Wang, M. H., He, Y., Jia, Y., and Xu, Z. (2021). A Power-Decoupled Current-Source Inverter for PV Energy Harvest and Grid Voltage Regulation. IEEE Trans. Ind. Electron. 68 (10), 9540–9549. doi:10.1109/tie.2020.3026264
Wang, Y., Zhao, C., Guo, C., and Rehman, A. U. (2019). Dynamics and Small Signal Stability Analysis of PMSG-Based Wind Farm with an MMC-HVDC System. CSEE J. Power Energ. Syst. 6 (1), 226–235. doi:10.17775/CSEEJPES.2019.02550
Xie, X., Zhang, X., Liu, H., Liu, H., Li, Y., and Zhang, C. (2017). Characteristic Analysis of Subsynchronous Resonance in Practical Wind Farms Connected to Series-Compensated Transmissions. IEEE Trans. Energ. Convers. 32 (3), 1117–1126. doi:10.1109/tec.2017.2676024
Xue, T., Lyu, J., Wang, H., and Cai, X. (2021). A Complete Impedance Model of a PMSG-Based Wind Energy Conversion System and its Effect on the Stability Analysis of MMC-HVDC Connected Offshore Wind Farms. IEEE Trans. Energ. Convers. 36, 3449–3461. Early Access. doi:10.1109/tec.2021.3074798
Xue, Y., and Zhang, X.-P. (2017). Reactive Power and AC Voltage Control of LCC HVDC System with Controllable Capacitors. IEEE Trans. Power Syst. 32 (1), 753–764. doi:10.1109/tpwrs.2016.2557342
Keywords: multi-frequency oscillation, sub-synchronous oscillation, super-synchronous oscillation, prosumer power network, converter-driven stability
Citation: Yan Z and Hong C (2022) Analysis of Multi-Frequency Oscillation Stability in a Prosumer Power Network. Front. Energy Res. 9:829988. doi: 10.3389/fenrg.2021.829988
Received: 06 December 2021; Accepted: 20 December 2021;
Published: 19 January 2022.
Edited by:
Jian Zhao, Shanghai University of Electric Power, ChinaReviewed by:
Zhi Wu, Southeast University, ChinaConghuan Yang, University of Birmingham, United Kingdom
Jinlei Sun, Nanjing University of Science and Technology, China
Copyright © 2022 Yan and Hong. This is an open-access article distributed under the terms of the Creative Commons Attribution License (CC BY). The use, distribution or reproduction in other forums is permitted, provided the original author(s) and the copyright owner(s) are credited and that the original publication in this journal is cited, in accordance with accepted academic practice. No use, distribution or reproduction is permitted which does not comply with these terms.
*Correspondence: Zuanhong Yan, dGhlbWljaGFlbHlhbkBvdXRsb29rLmNvbQ==bWFpbHRvOnRoZW1pY2hhZWx5YW5Ab3V0bG9vay5jb20=
 Zuanhong Yan
 Chao Hong2