 Yuanqi Li1
 Bo Yang
 Yiming Han
94% of researchers rate our articles as excellent or good
Learn more about the work of our research integrity team to safeguard the quality of each article we publish.
Find out more
ORIGINAL RESEARCH article
Front. Energy Res. , 19 January 2022
Sec. Process and Energy Systems Engineering
Volume 9 - 2021 | https://doi.org/10.3389/fenrg.2021.824691
This article is part of the Research Topic Advanced Technologies for Planning and Operation of Prosumer Energy Systems View all 111 articles
With the improvement in the integration of solar power generation, photovoltaic (PV) power forecasting plays a significant role in ensuring the operation security and stability of power grids. At present, the widely used backpropagation (BP) and improved BP neural network algorithm in short-term output prediction of PV power stations own the drawbacks of neglection of meteorological factors and weather conditions in inputs. Meanwhile, the existing traditional BP prediction model lacks a variety of numerical optimization algorithms, such that the prediction error is large. Therefore, based on the PV power plant in Lijiang, considering the related factors that influence PV output such as solar irradiance, environmental temperature, atmospheric pressure, wind velocity, wind direction, and historical generation data of the PV power station, three neural network algorithms (i.e., BP, GA-BP, and PSO-BP) are utilized respectively in this work to construct a short-term forecasting model of PV output. Simulation results show that GA-BP and PSO-BP network forecasting models both obtain high prediction accuracy, which indicates GA and PSO methods can effectively reduce the prediction errors in contrast to the original BP model. In particular, PSO owns better applicability than GA, which can further reduce the errors of the PV power prediction model.
Over the recent decades, global photovoltaic (PV)-installed capacity has been steadily and gradually expanded (Yang et al., 2015; Yang et al., 2020a; Muniappan, 2021). It is worth noting that the PV unit output is greatly affected by the operation environment, which is characterized by volatility, intermittence, and periodicity (Yao et al., 2015; Zhang et al., 2015). As an uncontrolled energy source, its fluctuation also brings new challenges to the stable and economic operation of power grids (Wang Q et al., 2020; Padhy and Panda, 2021). For a PV power generation system, its geographical position, configuration, and the performance of the equipment are critical inherent factors influencing the PV power output. Moreover, PV power generation will also be influenced by external conditions, such as illumination intensity, cloud cover, temperature, and wind velocity. Due to the characteristics of uncertainty, randomness, and periodicity change with such meteorological factors, the output power of the PV system is consequently random and varies intermittently, which severely reduces the stability of the PV generator-set power output. It is verified from relevant studies that when the PV power penetration exceeds 10% of the total power, the maximum peak-valley difference of the power grid will be significantly increased, resulting in difficulties in peak load regulation, and affecting the power quality and the stability of power grid operation.
Therefore, to predict the output power of the PV system in 24 h utilizing weather information, we formulated reasonable dispatching and management scheme of the PV power plant and duly adjusted the proportion of PV connected to the grid, which can effectively reduce the impact to the power grid caused by the disproportionality of PV connected to the grid, and then achieving the security of grid-connected operation, smooth running, and economic dispatch for better economic benefit and social benefit.
Nowadays, the power forecasting approaches can be classified into statistical prediction techniques, physical prediction methods, and artificial intelligence prediction ways in view of the principle of forecasting methods. In the literature (Kazem and Yousif, 2017), the multi-layer perceptron (MLP), self-organizing feature mapping (SOFM) network, feedforward network (FFN), and support vector machine (SVM) model are compared in terms of prediction performance and prediction accuracy, and SOFM gets the lowest mean square error (MSE) value while the FFN attains the highest prediction accuracy. The literature (Tang et al., 2016) combines the entropy method and extreme learning machine (ELM) to predict the PV output power. First, the entropy method pre-process initial data which are the training set of the network, and finally, the PV output power is predicted by ELM, and experiments show that the combination of the entropy method and ELM can efficiently accelerate the prediction accuracy and the calculation speed. The solar zenith angle and solar azimuth angle are added to the input data set of the neural network to forecast PV power outputs. The results show that the proposed artificial neural network (ANN) model attains high accuracy in forecasting the PV power output under any weather conditions (Huang et al., 2016; Li et al., 2021).
Until now, the technique of the backpropagation (BP) neural network algorithm applied to solar power generation forecasting has attained certain achievements (Kaushika et al., 2014; Shen et al., 2019; Erdiwansyah et al., 2021). However, existing research studies mostly adopt one single algorithm, the genetic algorithm (GA) or particle swarm optimization (PSO), to improve the BP prediction model, lacking the comparative study of these two algorithms on the optimization effect for the BP prediction model (Liu et al., 2015; Liu et al., 2016; Liu et al., 2021).
To overcome the above problems, this work comprehensively considers the wind velocity, solar irradiance, wind direction, atmospheric pressure, humidity, ambient temperature, and other meteorological factors and the historical power generation data of PV plants, and adopts three neural network algorithms, i.e., BP, GA-BP, and PSO-BP, to construct a short-term prediction model of PV power generation which can forecast the power outputs of the PV system every 15 min during the working time. The simulation test results verify that the modified GA-BP and PSO-BP prediction models have less error in contrast to the original BP forecasting model. Especially, the PSO has better adaptability than GA in optimizing the BP neural network.
The structure of this study is organized as follows: The principle of the BP neural network and the power forecasting model of traditional BP are introduced in Section 2. The main optimization principle of how GA and PSO optimize the weights and threshold values is elaborated in Section 3. In the meantime, the PV output power short-term prediction models by GA-BP and PSO-BP algorithms are constructed in Section 3. Simulation tests of three algorithms and detailed statistical analysis on the effectiveness of network optimization and forecasting model are elaborated and analyzed in Section 4. Ultimately, three conclusions are given in Section 5.
The BP neural network is a kind of multilayer feedforward neural network with error backpropagation training, which displays good performance in self-organizing learning and achieves an arbitrary nonlinear map from inputs to outputs (Huang et al., 2021; Zhao et al., 2021). Through the onward spread of input data and the backward spread of the error value, the BP network prediction model realizes the training process and then processes large-scale data in parallel (Yan et al., 2020; Zhu et al., 2021). In addition, it has certain robustness and fault tolerance, and the typical construction of a common three-layer BP neural network is represented in Figure 1.
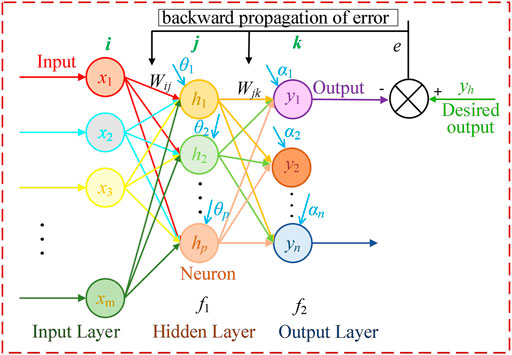
FIGURE 1. Basic structure of the BP neural network.
As shown in Figure 1, the number of neuron nodes in the input layer, hidden layer, and output layer are m, p and n, respectively. Wij is the weight connected with the input layer and the hidden layer; Wjk is the weight connected with the hidden layer and the output layer;
The two stages of BP network learning are as follows: the onward spread of input signals and the backward spread of error (Wagner and Mccomb, 2019). In the first stage, the training sample information is inputted in the input layer and then processed by the hidden layer before being transferred to the output layer. If there is an error between the actual output and the predicted output, the second stage will be executed. The second process is to transfer the error of the output signal from the hidden layer to the input layer through the original path. Then, based on the assigned error signal, each neuron of all layers adjusts the connection weights and threshold values of each network and finally makes the error signal gradually decrease. These two processes are performed alternately and repeatedly until the algorithm converges and the satisfactory error accuracy is obtained.
The fundamental execution procedure of the BP algorithm is elaborated as below:
a) Initialize all the weights and threshold values of the BP network, i.e., set as a random figure within the range of [−1,+1];
b) Specify a network training sample set, which contains the input vector
c) Calculated the output values of the hidden layer and output layer;
d) Adjust the connection weights and thresholds of the network. The standard BP neural network algorithm adopts the gradient descent learning approach to modify the weight and threshold vector:
where the
e) Repeat the steps b) to d) until attaining satisfactory error accuracy.
In this work, the BP neural network algorithm is employed to forecast the output power of a 10 MW PV station in Lijiang, China. The three-layered construction is employed, and the input layer is the atmospheric environment parameters consisting of environment temperature, humidity, illumination intensity, wind velocity, wind direction, atmospheric pressure, real irradiance, and practical power outputs.
The initial node number of the hidden layer neuron p is determined by empirical Eq. 2. And then, the trial-and-error method is used to gradually adjust the number of the hidden layer node to minimize the error of the neural network. Finally, the number of the hidden layer node is set to be 10.
where the value of v ranges from 1 to 10.
The output layer has one neuron node. Therefore, the three-layer neural network structure used for short-term power prediction is 8-10-1.
The BP neural network algorithm can fit various complex nonlinear relations between any inputs and outputs through continuous training and learning and consequently has certain robustness and generalization ability. However, the BP neural network algorithm has inherent defects (Karakose et al., 2014). The BP neural network algorithm is likely to trap in local extremum during data training, resulting in data training failure since it adopts the standard gradient descent algorithm. Meanwhile, the BP algorithm has the drawback of data overfitting phenomenon (Wang G et al., 2020). Generally speaking, the prediction ability of the neural network is directly proportional to the sample training ability. In fact, with the improvement of the sample training ability, the prediction ability of the BP neural network will reach an extreme limit and then decline, which is the so-called overfitting phenomenon. To settle the aforementioned shortcomings of the BP neural network algorithm, GA and PSO are employed to optimize the network structure of BP.
The main inspiration and the optimization process of GA-BP and PSO-BP are elaborated in this section, respectively.
GA is a multiple-agent searching global optimization algorithm based on biological evolution and therefore can avoid falling into local optimal solutions (Deshkar et al., 2015). GA adopts the heuristic principle and manages the search agents according to their fitness function values. Specifically, GA selects individuals with high fitness for genetic operation (selection, chromosomal chiasma, and mutation) and simulates the natural evolution process of survival of the fittest, to search for the optimal solution (Yang et al., 2021a).
The traditional divination model of the BP network has some defects, such as easily falling into local optimum, low convergence speed, and the data overfitting phenomenon. Because GA has a strong macro exploration ability and good global optimization performance (Rajan et al., 2017), it is used to optimize the connection weight and threshold value between various layers in the BP neural network model. Theoretically, GA can make up for the defects of the BP neural network algorithm and improve the prediction approximation ability of the BP neural network model. The optimization procedure of the BP neural network by GA mainly includes population initialization, fitness function establishment, selection, crossover, and mutation operation.
Common chromosome encoding methods of GA include binary encoding, real encoding, character encoding, and string encoding (Zhou et al., 2020; Yang et al., 2021b). There are eight environment input variables, one output neuron nodes, and 10 neuron nodes in the hidden layer. Hence, the number of weight Wij and Wjk are
Based on the connection weights and thresholds attained by the individual code, the absolute value sum of the forecasting bias of training data is regarded as single fitness, which can be calculated as below:
where
The GA selection operation is executed based on roulette, i.e., selection on fitness proportion. The selected probability
where
In order to ensure the balance between population diversity and convergence of GA, an adaptive crossover mutation operator is adopted. When one individual fitness is less than the average fitness, the proposed GA increases the probability of crossover and mutation to promote individual updating and population diversity; otherwise, GA decreases that to guarantee the high fitness one’s proportion in population and improve the convergence speed of GA.
The adaptive crossover operator can be expressed by the following equation:
The adaptive mutation operator can be expressed by
where
Above all, the summation of connection weights between various layers and of thresholds of each layer is determined based on the BP network construction. Second, the individuals in the population are encoded. And then, the optimal individual is obtained by selection, crossover, and mutation which are regarded as the best original weights and thresholds. Lastly, the BP network is applied to training data and prediction simulation until the prediction error is acceptable or the iterations terminate. The flow chart of the GA-BP algorithm is represented in Figure 2
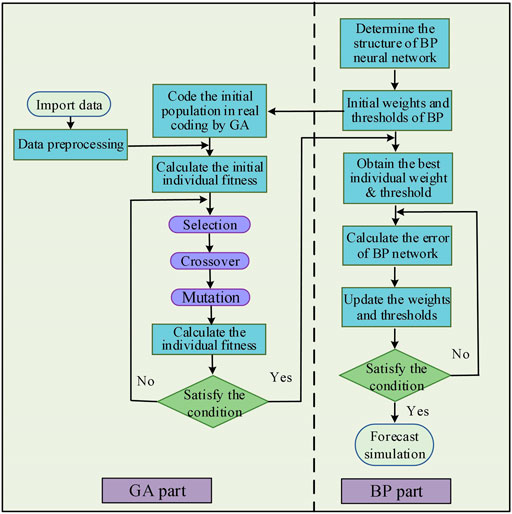
FIGURE 2. Flowchart of the GA-BP algorithm.
PSO is a swarm intelligence optimization algorithm derived from the predation behavior of birds in nature (Kennedy and Eberhart, 1995; Yang et al., 2020b). During the birds foraging, each bird usually follows the one closest to the food and searches its surroundings to get food (Dhanalakshmi and Rajasekar, 2017; Zhang X et al., 2021; Yang et al., 2021c). Similar to GA, PSO also utilizes the fitness of individuals in the population to evaluate the cost of individuals but without the operation of crossover and mutation. Each particle in the population that contains information of every weight and threshold in the BP neural network is characterized by three indicators, i.e., particle position, speed, and fitness. Moreover, the best initialization weights and thresholds of the BP neural network can be obtained by tracking the optimal positions of individuals and populations. Thus, both the convergence speed and prediction performance of the BP neural network can be improved.
Based on the construction of the BP neural network, the initialization population of the PSO algorithm is a 101 dimensional vector. Moreover, the fitness function still adopts the training error summation in GA-BP calculated by Eq. 3. And then, the optimal population particle obtained by iteration searching represents the optimal initialization weights and thresholds of the BP neural network. Afterward, the BP neural network is applied to the training data and prediction simulation.
For each iteration of the PSO algorithm, every particle updates its own velocity and position through individual historical extremum and global extremum (Xi et al., 2016; Babu et al., 2018; Zhang K et al., 2021). The update formulas are as follows.
velocity updating:
position updating:
where t is the current iteration;
And, the inertia weight is alterable calculating as below:
where
Compared with GA, PSO does not encode the chromosome during the initialization but initializes the speed and position of the particle swarm on the basis of the total number of connection weights between various layers and of thresholds of each layer based on the construction of the BP network. Moreover, PSO-BP adopts the same fitness function with GA-BP. After the iterative search for the individual and population best solution, the global best agent which includes all weights and threshold values is regarded as the initial parameters of the BP neural network for improving its prediction effect. The flow chart of the PSO-BP algorithm is demonstrated in Figure 3.
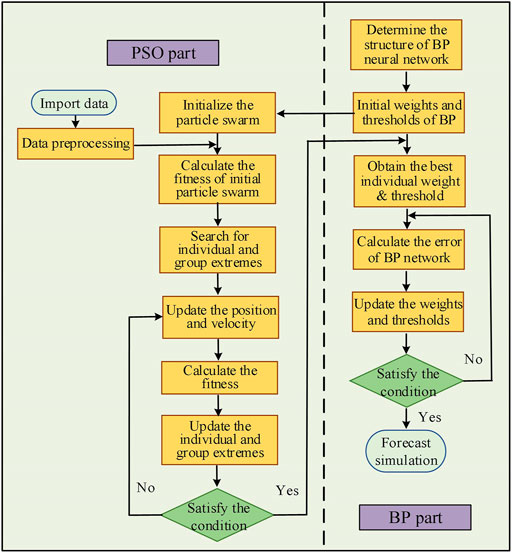
FIGURE 3. Flowchart of the PSO-BP algorithm.
The experimental data in this work are derived from the historical record data of the PV power plant in Lijiang, Yunnan, China. In this work, meteorological environment data and historical power generation data from January 1, 2017, to April 30, 2018, are extracted from the database, including six meteorological indicators, i.e., solar irradiance, wind speed, wind direction, temperature, atmospheric pressure, and humidity. At an interval of 15 min, a total of 43,737 pieces of data are reserved for the simulation test after screening and sorting, among which 43,688 pieces of data are used to train the neural network, and the latter 49 pieces of data are regarded as a test set.
On account of the particularity of the selected data and the large fluctuation of PV power generation within a day, the output power varies greatly at all times. In addition, the units of the historical PV output power data and meteorological data and their values are different. Therefore, it will affect the accuracy and effect of prediction to directly input them into the power prediction model. To guarantee the validity of experimental results, the premnmx function is adopted to uniformize the experimental data which will be evenly distributed between 0 and 1 after uniformization processing. Besides, the premnmx function is formulated as the following equation.
where
For the sake of accurately reflecting the actual deviation of the prediction error of the proposed model, two error indicators are introduced. Concretely speaking, the root mean square error (RMSE) (Chen et al., 2019) and mean absolute percentage error (MAPE) (Zhang et al., 2016) are the error indexes of local PV power station output forecasting. Particularly, the specific reference formulas are:
where N is the summation of test data in the test set,
The power output data of the forecasting model are trained by BP, GA-BP, and PSO-BP neural network algorithms, respectively. And, the prediction results and measured results are compared and analyzed. Moreover, after repeated imitation tests, the training parameters of each algorithm are determined as shown in Table 1. In particular, all simulation tests are performed by Matlab 2019b through a personal computer with IntelR CoreTMi5 CPU at 3.0 GHz and 16 GB of RAM.
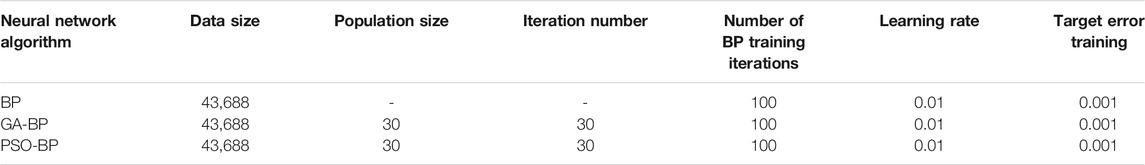
TABLE 1. Parameter settings of each neural network algorithm.
In the simulation test, the neuron number for each layer of the designed network (i.e., input, hidden, and output layer) is 8, 10, and 1, respectively. The comparison curves between the predicted power and measured power of the three neural network algorithms are shown in Figure 4, and the error curves of the three algorithms are depicted in Figures 5, 6. Besides, the corresponding prediction error average of the three algorithms is shown in Table 2.
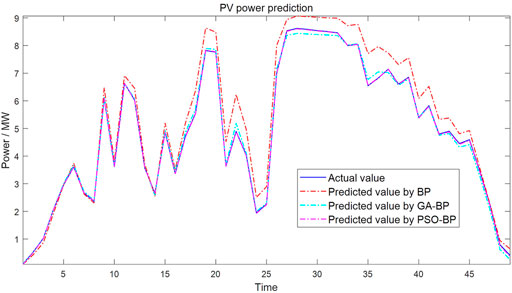
FIGURE 4. Predicted power curves of three neural networks.
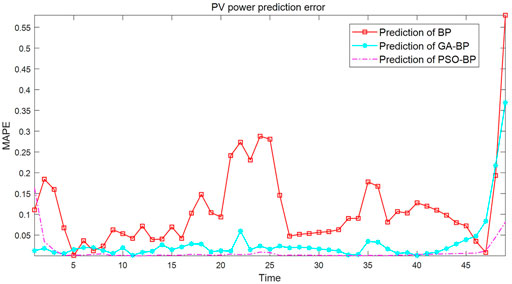
FIGURE 5. MAPE of three PV power prediction models.
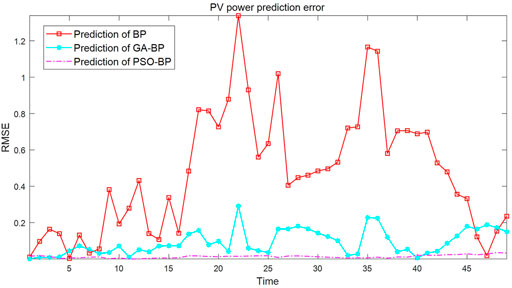
FIGURE 6. MAPE of three PV power prediction models.
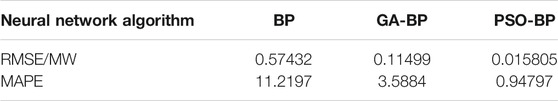
TABLE 2. Prediction error data of each neural network algorithm.
Based on the above comparison power curves of the PV power station between short-term prediction and the actual measured value and the prediction error data, it can be inferred that PSO-BP and GA-BP both can realize the short-term power forecasting of the PV plant, but the original BP neural network algorithm has a relatively large error with larger forecasting power than the actual value. Particularly, the PSO-BP network has more accurate prediction performance than GA-BP due to smaller values in two error indicators of the RMSE and MAPE. In other words, both of GA and PSO can optimize the BP prediction model and effectively reduce the prediction error of the BP prediction model. In addition, the optimization effect of PSO is better than that of GA, which indicates that PSO has better applicability.
In this work, given the lack of multiple numerical optimization algorithms in the existing traditional BP prediction model, the negligence of meteorological factors and weather conditions in inputs and the large prediction error, GA and PSO are introduced to improve the network construction of the BP algorithm and further establish the PV power generation short-term prediction model, thus improving the weights and thresholds of BP neural networks. Thus, three PV output short-term forecasting models of BP, GA-BP, and PSO-BP are established. Meanwhile, the comparison between the predicted and measured power curves and error analysis are studied. The following conclusions can be stated:
• Both GA and PSO algorithms can efficiently enhance the forecasting accuracy of the BP divination model and optimize the prediction effect;
• Compared with GA, PSO has stronger applicability in neural network structure optimization;
• The PSO-BP prediction model has a higher prediction accuracy and can be used as an effective short-term power prediction model for this aforementioned PV power station in Lijiang.
The results show that this work is crucial for the power management department to formulate the reasonable energy management and dispatch scheme to undertake the stability and safety of large grid-connected PV.
The original contributions presented in the study are included in the article/Supplementary Material, further inquiries can be directed to the corresponding author.
YL contributed to conceptualization, formal analysis, and writing of the original draft; LZ helped with the supervision and review and editing of the manuscript; PG performed visualization and validation; BY contributed to data curation and visualization; YH was responsible for formal analysis and software; CL was responsible for investigation, validation, and supervision.
Authors YL and LZ were employed by the company SGCC Jiangsu Electric Power Co, Ltd Suzhou branch. Authors PG, BY and YH were employed by the company SGCC Jiangsu Electric Power Co, Ltd Pingdingshan branch.
The remaining author declares that the research was conducted in the absence of any commercial or financial relationships that could be construed as a potential conflict of interest.
All claims expressed in this article are solely those of the authors and do not necessarily represent those of their affiliated organizations, or those of the publisher, the editors, and the reviewers. Any product that may be evaluated in this article, or claim that may be made by its manufacturer, is not guaranteed or endorsed by the publisher.
Wij and Wjk, weights of the network;
Babu, T. S., Ram, J. P., Dragicevic, T., Miyatake, M., Blaabjerg, F., and Rajasekar, N. (2018). Particle Swarm Optimization Based Solar PV Array Reconfiguration of the Maximum Power Extraction under Partial Shading Conditions. IEEE Trans. Sustain. Energ. 9 (1), 74–85. doi:10.1109/tste.2017.2714905
Chen, J., Yao, W., Zhang, C.-K., Ren, Y., and Jiang, L. (2019). Design of Robust MPPT Controller for Grid-Connected PMSG-Based Wind Turbine via Perturbation Observation Based Nonlinear Adaptive Control. Renew. Energ. 134, 478–495. doi:10.1016/j.renene.2018.11.048
Deshkar, S. N., Dhale, S. B., Mukherjee, J. S., Babu, T. S., and Rajasekar, N. (2015). Solar PV Array Reconfiguration under Partial Shading Conditions for Maximum Power Extraction Using Genetic Algorithm. Renew. Sust. Energ. Rev. 43, 102–110. doi:10.1016/j.rser.2014.10.098
Dhanalakshmi, B., and Rajasekar, N. (2017). The Particle Swarm Optimization Algorithm for Maximum Power Extraction of Solar PV Array. Adv. Smart Grid Renew. Energ. 2, 39–48. doi:10.1007/978-981-10-4286-7_5
Erdiwansyah, E., Taleb, M. A., Husin, H., Nasaruddin, S., Zaki, M., and Muhibbuddin, (2021). A Critical Review of the Integration of Renewable Energy Sources with Various Technologies. Prot. Control. Mod. Power Syst. 6 (1), 37–54. doi:10.1186/s41601-021-00181-3
Huang, C., Bensoussan, A., Edesess, M., and Tsui, K. L. (2016). Improvement in Artificial Neural Network-Based Estimation of Grid Connected Photovoltaic Power Output. Renew. Energ. 97, 838–848. doi:10.1016/j.renene.2016.06.043
Huang, S., Wu, Q., Liao, W., Wu, G., Li, X., and Wei, J. (2021). Adaptive Droop-Based Hierarchical Optimal Voltage Control Scheme for VSC-HVDC Connected Offshore Wind Farm. IEEE Trans. Ind. Inf. 17, 8165–8176. doi:10.1109/TII.2021.3065375
Karakose, M., Baygin, M., and Parlak, K. S. (2014). “A New Real-Time Reconfiguration Approach Based on Neural Network in Partial Shading for PV Arrays,” in 3rd International Conference on Renewable Energy Research and Applications, Milwaukee, WI, USA, 19-22 October, 2014 (IEEE), 633–637. 10.1109/ICRERA.2014.7016462.
Kaushika, N. D., Tomar, R. K., and Kaushik, S. C. (2014). Artificial Neural Network Model Based on Interrelationship of Direct, Diffuse and Global Solar Radiations. Solar Energy 103, 327–342. doi:10.1016/j.solener.2014.02.015
Kazem, H. A., and Yousif, J. H. (2017). Comparison of Prediction Methods of Photovoltaic Power System Production Using a Measured Dataset. Energ. Convers. Manag. 148, 1070–1081. doi:10.1016/j.enconman.2017.06.058
Kennedy, J., and Eberhart, R. (1995). “Particle Swarm Optimization,” in IEEE International Conference on Neural Networks, Perth, Australia, 27 Nov-1 Dec, 1995 (IEEE), 1942–1948. 10.1109/ICNN.1995.488968.
Li, Y., Han, M., Yang, Z., and Li, G. (2021). Coordinating Flexible Demand Response and Renewable Uncertainties for Scheduling of Community Integrated Energy Systems with an Electric Vehicle Charging Station: a Bi-level Approach. IEEE Trans. Sustain. Energ. 12 (4), 2321–2331. doi:10.1109/tste.2021.3090463
Liu, J., Fang, W., Zhang, X., and Yang, C. (2015). An Improved Photovoltaic Power Forecasting Model with the Assistance of Aerosol index Data. IEEE Trans. Sust. Energ. 6 (2), 1–9. doi:10.1109/tste.2014.2381224
Liu, J., Wen, J., Yao, W., and Long, Y. (2016). Solution to Short‐term Frequency Response of Wind Farms by Using Energy Storage Systems. IET Renew. Power Gener. 10 (5), 669–678. doi:10.1049/iet-rpg.2015.0164
Liu, S., Zhou, C., Guo, H., Shi, Q., Song, T. E., Schomer, I., et al. (2021). Operational Optimization of a Building-Level Integrated Energy System Considering Additional Potential Benefits of Energy Storage. Prot. Control. Mod. Power Syst. 6 (1), 55–64. doi:10.1186/s41601-021-00184-0
Muniappan, M. (2021). A Comprehensive Review of DC Fault protection Methods in HVDC Transmission Systems. Prot. Control. Mod. Power Syst. 6 (1), 1–20. doi:10.1186/s41601-020-00173-9
Padhy, S., and Panda, S. (2021). Application of a Simplified Grey Wolf Optimization Technique for Adaptive Fuzzy PID Controller Design for Frequency Regulation of a Distributed Power Generation System. Prot. Control. Mod. Power Syst. 6 (1), 21–36. doi:10.1186/s41601-021-00180-4
Rajan, N. A., Shrikant, K. D., Dhanalakshmi, B., and Rajasekar, N. (2017). Solar PV Array Reconfiguration Using the Concept of Standard Deviation and Genetic Algorithm. Energ. Proced. 117, 1062–1069. doi:10.1016/j.egypro.2017.05.229
Shen, Y., Yao, W., Wen, J., He, H., and Jiang, L. (2019). Resilient Wide-Area Damping Control Using GrHDP to Tolerate Communication Failures. IEEE Trans. Smart Grid 10 (3), 2547–2557. doi:10.1109/tsg.2018.2803822
Tang, P., Chen, D., and Hou, Y. (2016). Entropy Method Combined with Extreme Learning Machine Method for the Short-Term Photovoltaic Power Generation Forecasting. Chaos Solitons Fractals 89, 243–248. doi:10.1016/j.chaos.2015.11.008
Wagner, K. H., and Mccomb, S. M. (2019). Optical Rectifying Linear Units for Back-Propagation Learning in a Deep Holographic Convolutional Neural Network. IEEE J. Selected Top. Quan. Elect. 26 (1), 1. 10.1109/JSTQE.2019.2946655 .
Wang Q, Q., Yao, W., Fang, J., Ai, X., Wen, J., Yang, X., et al. (2020). Dynamic Modeling and Small Signal Stability Analysis of Distributed Photovoltaic Grid-Connected System with Large Scale of Panel Level DC Optimizers. Appl. Energ. 259, 114132. doi:10.1016/j.apenergy.2019.114132
Wang G, G., Awad, O. I., Liu, S., Shuai, S., and Wang, Z. (2020). Nox Emissions Prediction Based on Mutual Information and Back Propagation Neural Network Using Correlation Quantitative Analysis. Energy 198, 117286. doi:10.1016/j.energy.2020.117286
Xi, L., Yu, T., Yang, B., Zhang, X. S., and Qiu, X. Y. (2016). A Wolf Pack Hunting Strategy Based Virtual Tribes Control for Automatic Generation Control of Smart Grid. Appl. Energ. 178, 198–211. doi:10.1016/j.apenergy.2016.06.041
Yan, E., Song, J., Liu, C., Luan, J., and Hong, W. (2020). Comparison of Support Vector Machine, Back Propagation Neural Network and Extreme Learning Machine for Syndrome Element Differentiation. Artif. Intell. Rev. 53 (4), 2453–2481. doi:10.1007/s10462-019-09738-z
Yang, B., Jiang, L., Yao, W., and Wu, Q. H. (2015). Perturbation Estimation Based Coordinated Adaptive Passive Control for Multimachine Power Systems. Control. Eng. Pract. 44, 172–192. doi:10.1016/j.conengprac.2015.07.012
Yang, B., Zhu, T., Wang, J., Shu, H., Yu, T., Zhang, X., et al. (2020). Comprehensive Overview of Maximum Power point Tracking Algorithms of PV Systems under Partial Shading Condition. J. Clean. Prod. 268, 121983. doi:10.1016/j.jclepro.2020.121983
Yang, B., Wang, J., Zhang, X., Wang, J., Shu, H., Li, S., et al. (2020). Applications of Battery/supercapacitor Hybrid Energy Storage Systems for Electric Vehicles Using Perturbation Observer Based Robust Control. J. Power Sourc. 448, 227444. doi:10.1016/j.jpowsour.2019.227444
Yang, B., Ye, H., Wang, J., Li, J., Wu, S., Li, Y., et al. (2021). PV Arrays Reconfiguration for Partial Shading Mitigation: Recent Advances, Challenges and Perspectives. Energ. Convers. Manag. 247, 114738. doi:10.1016/j.enconman.2021.114738
Yang, B., Chen, Y., Guo, Z., Wang, J., Zeng, C., Li, D., et al. (2021). Levenberg‐Marquardt Backpropagation Algorithm for Parameter Identification of Solid Oxide Fuel Cells. Int. J. Energ. Res. 45, 17903–17923. doi:10.1002/er.6929
Yang, B., Guo, Z., Wang, J., Wang, J., Zhu, T., Shu, H., et al. (2021). Solid Oxide Fuel Cell Systems Fault Diagnosis: Critical Summarization, Classification, and Perspectives. J. Energ. Storage 34, 102153. doi:10.1016/j.est.2020.102153
Yao, W., Lin Jiang, L., Jinyu Wen, J. Y., Qinghua Wu, Q. H., and Shijie Cheng, S. J. (2015). Wide-Area Damping Controller for Power System Interarea Oscillations: A Networked Predictive Control Approach. IEEE Trans. Contr. Syst. Technol. 23 (1), 27–36. doi:10.1109/tcst.2014.2311852
Zhang, X., Yu, T., Yang, B., Zheng, L., and Huang, L. (2015). Approximate Ideal Multi-Objective Solution Q(λ) Learning for Optimal Carbon-Energy Combined-Flow in Multi-Energy Power Systems. Energ. Convers. Manag. 106, 543–556. doi:10.1016/j.enconman.2015.09.049
Zhang, X., Yu, T., Yang, B., and Li, L. (2016). Virtual Generation Tribe Based Robust Collaborative Consensus Algorithm for Dynamic Generation Command Dispatch Optimization of Smart Grid. Energy 101, 34–51. doi:10.1016/j.energy.2016.02.009
Zhang X, X., Tan, T., Zhou, B., Yu, T., Yang, B., and Huang, X. (2021). Adaptive Distributed Auction-Based Algorithm for Optimal Mileage Based AGC Dispatch with High Participation of Renewable Energy. Int. J. Electr. Power Energ. Syst. 124, 106371. doi:10.1016/j.ijepes.2020.106371
Zhang K, K., Zhou, B., Or, S. W., Li, C., Chung, C. Y., and Voropai, N. I. (2021). Optimal Coordinated Control of Multi-Renewable-To-Hydrogen Production System for Hydrogen Fueling Stations. IEEE Trans. Ind. Applicat., 1. doi:10.1109/TIA.2021.3093841
Zhao, J., Nguyen, H., Nguyen-Thoi, T., Asteris, P. G., and Zhou, J. (2021). Improved Levenberg-Marquardt Backpropagation Neural Network by Particle Swarm and Whale Optimization Algorithms to Predict the Deflection of RC Beams. Eng. Comput. doi:10.1007/s00366-020-01267-6
Zhou, Y., Zhou, N., Gong, L., and Jiang, M. (2020). Prediction of Photovoltaic Power Output Based on Similar Day Analysis, Genetic Algorithm and Extreme Learning Machine. Energy 204, 117894. doi:10.1016/j.energy.2020.117894
Keywords: photovoltaic power short-term forecasting, BP neural network algorithm, GA-BP algorithm, PSO-BP algorithm, solar energy
Citation: Li Y, Zhou L, Gao P, Yang B, Han Y and Lian C (2022) Short-Term Power Generation Forecasting of a Photovoltaic Plant Based on PSO-BP and GA-BP Neural Networks. Front. Energy Res. 9:824691. doi: 10.3389/fenrg.2021.824691
Received: 29 November 2021; Accepted: 15 December 2021;
Published: 19 January 2022.
Edited by:
Jian Zhao, Shanghai University of Electric Power, ChinaReviewed by:
Yaxing Ren, University of Warwick, United KingdomCopyright © 2022 Li, Zhou, Gao, Yang, Han and Lian. This is an open-access article distributed under the terms of the Creative Commons Attribution License (CC BY). The use, distribution or reproduction in other forums is permitted, provided the original author(s) and the copyright owner(s) are credited and that the original publication in this journal is cited, in accordance with accepted academic practice. No use, distribution or reproduction is permitted which does not comply with these terms.
*Correspondence: Yiming Han, a21oeW0xOTkzQHNpbmEuY29t
Disclaimer: All claims expressed in this article are solely those of the authors and do not necessarily represent those of their affiliated organizations, or those of the publisher, the editors and the reviewers. Any product that may be evaluated in this article or claim that may be made by its manufacturer is not guaranteed or endorsed by the publisher.
Research integrity at Frontiers
Learn more about the work of our research integrity team to safeguard the quality of each article we publish.