 Quanyi Gong
 Ke Peng
 Wei Wang*
94% of researchers rate our articles as excellent or good
Learn more about the work of our research integrity team to safeguard the quality of each article we publish.
Find out more
METHODS article
Front. Energy Res. , 17 January 2022
Sec. Smart Grids
Volume 9 - 2021 | https://doi.org/10.3389/fenrg.2021.824414
This article is part of the Research Topic Integration and Digitalization of Urban Energy Systems View all 9 articles
With the increase of various loads connected to the low-voltage distribution system, the difficulty of identifying low-voltage series fault arcs has greatly increased, which seriously threatens the electricity safety. Aiming at such problems, a neural network algorithm based on multi-feature fusion is proposed. The fault current has the characteristics of randomness, high frequency noise, and singularity. A GA-BP neural network model is built, and the wavelet analysis method (based on singularity), Fourier transform method (based on high frequency noise), current cycle difference method (based on randomness), and current cycle similarity derivation method (based on randomness) are used for feature extraction and can more comprehensively reflect the characteristics of arc faults. Simulation results show that the multi-feature fusion algorithm has a higher recognition rate than other algorithms. Moreover, compared with the support vector machine model, logistic regression model, and AlexNet model, the GA-BP neural network model has a higher recognition accuracy than the other three models, which can reach 99%.
According to the statistics of the Fire Department of the Ministry of Public Security, the proportion of electrical fires in the United States in recent years is about 30% and is showing an upward trend. The number of electrical fires has ranked first among all types of fires (USFA, 2018). The fault arc is an important cause of electrical fire. The arc can be drawn when the current exceeds 0.5 A under 220 V AC. The temperature of the fault point can reach several thousand degree Celsius if it is not handled in a timely and accurate manner, which will seriously affect the safety of electricity use. In civil occasions after the electric meter, under normal circumstances, when parallel arc faults and grounding arc faults occur, traditional low-voltage protection devices are easy to detect and disconnect the circuit to protect it. However, Yu et al. (2021) discovered a series arc faults caused by poor contact and insulation failure, and the circuit current decreases when a fault occurs. This causes traditional protection devices such as circuit breakers and fuses to reject trips. Therefore, in order to ensure the safety of electricity consumption in civil occasions, effectively solving the low-voltage series fault arc has become a problem and has been widely concerned and studied by scholars at home and abroad.
At present, the detection methods for low-voltage AC arcs are mainly divided into two categories: 1) analyze the current signal according to the change law of the line current and voltage signal when an arc fault occurs and propose a corresponding identification method (Parise et al., 2013; Soheili et al., 2016; Wang et al., 2017; Shekhar et al., 2018); 2) under the premise of knowing the specific location where the fault arc may occur in advance, use the arc’s arc light, arc sound, electromagnetic radiation, temperature, and other physical characteristics to detect the arc. These methods have great limitations in detecting arc faults. It is generally used to detect arcs in specific switch cabinets (Li et al., 2020; Dong et al., 2021). At present, the most widely used method is to use the current waveform characteristics to analyze the arc fault. Zhang et al. (2016) summarize some characteristics of fault arc current, such as current peak characteristics and continuous multiple cycles of current signal loss, strict periodicity, and other characteristics (Abdullah et al., 2018) and use the irregular characteristics to detect the fault arc. Although the detection method has strong real-time performance, it is difficult to determine the public threshold at the same time. The Fourier transform on the current signal for frequency domain analysis is performed, and the characteristic components are extracted (Artale et al., 2017; Guo et al., 2020). The disadvantage of this method is that the detection method has poor real-time performance and a large amount of calculation. The algorithms used in (Lu et al., 2017; Tan, 2017; Bai and Xu, 2020) are all established on the basis of the wavelet transform. The wavelet transform is a localized analysis method for time and frequency, which is prone to spectrum aliasing. An artificial neural network, machine learning, and other methods to detect the fault arc in combination with the characteristics of fault arc current are used, but it needs a lot of training and screening data to ensure the accuracy of the algorithm (Caldron-Mendoza et al., 2019; Jiang et al., 2019; Lu et al., 2020).
Therefore, a single threshold standard is difficult to meet the detection requirements. In response to the above problems, this article proposes a multi-feature fusion detection method. The major contributions of the article are summarized as follows:
1) An arc fault characteristic analysis method based on multi-feature fusion is proposed. When an arc occurs, the line current has the characteristics of abrupt randomness, increased high-frequency components, and singularity. Aiming at the above characteristics, use of the methods of Fourier transform (reflecting high-frequency characteristics), wavelet analysis (reflecting singularity), current cycle-to-cycle difference, and derivation of cycle-to-cycle similarity (reflecting randomness) for fusion of multiple feature vectors can more comprehensively reflect the fault characteristics. Compared with the algorithm established by a single characteristic, it has stronger universality and is suitable for a variety of load types.
2) A neural network algorithm for multi-feature fusion is proposed. Aligning the characteristic values of arcs extracted by the four methods to realize multi-feature fusion can make up for the shortcomings between each method. Compared with the method of directly applying multiple criteria to the four methods, the neural network algorithm has stronger adaptability. For situations that are not satisfied with the four methods, it can spontaneously search for feature information from multi-feature fusion vectors and feature tags to achieve accurate recognition. The test results show that the multi-feature fusion algorithm has a higher detection accuracy than a single algorithm.
3) The GA-BP neural network model is established, and the training data of the model are established on the basis of the arc characteristic values extracted by the four methods. Before the data are input to the neural network, the arc characteristic information is effectively amplified, which greatly reduces the workload of the neural network to extract the characteristic information; therefore, the model training process is simple.
4) Compared with the support vector machine, logistic regression model, and AlexNet model, as far as the algorithm in this article is concerned, the GA-BP model has better detection performance in terms of detection accuracy and training timeliness.
The remainder of this article is organized as follows: in Section 2, we collect low-voltage AC series current data and analyze fault characteristics. Section 3 introduces the extraction method of each arc characteristic value and comparison of the test results of different loads. In Section 4, we build and train a neural network detection model and propos an arc fault detection algorithm. In Section 5, we perform simulation verification on the constructed neural network model and compare it with other methods. Finally, conclusions are summarized in Section 6.
The national standard GB/14287.4 stipulates that the fault arc detector is aimed at the voltage level of China’s civil use and applications where the rated voltage is 220 V (AC 50 Hz) and the maximum power level is 10 kW. According to the GB/14287.4 standard, to build a series fault arc experimental circuits as shown in Figure 1, it consists of AC power supply, a switch, a load, an arc generator, and a data acquisition device. The arc generator used includes a stationary carbon electrode with a diameter of 6.4 mm and a copper moving electrode.
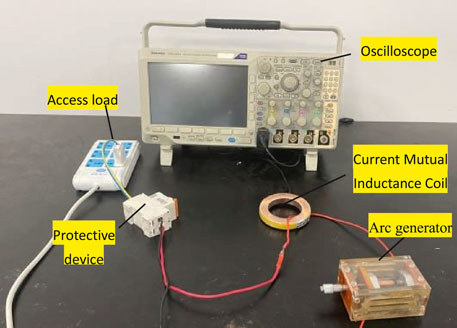
FIGURE 1. AC series fault arc test circuit.
First, we perform average filtering on the collected current signal, the principle of filtering is to take the average of every few points in a section of the waveform, and replace it with the average. Essentially, a digital filter to reduce interference and noise, the filtered current frequency is 5 kHz.
From the analysis of Figure 2, during t1∼t2, the voltage uh applied to the arc at t1 drops to 0, the current I also drops to 0, and the arc is extinguished. The voltage across the arc gap will continue to increase in accordance with the sine law. Since the arc gap resistance Rh is very large when the arc gap is not broken down, uh can be approximately regarded as the power supply voltage u at this time, and I will be basically 0 and will be maintained, showing a “zero rest” phenomenon. In an AC circuit, when a series fault arc occurs, the line current is very close to 0 during the continuous time of the natural zero-crossing point. When an arc fault occurs, the line current has the characteristics of singularity. uh changes according to the law of sine, and its amplitude keeps increasing until when uh reaches the arc voltage Uz at time t2, the arc gap is broken down and the arc reignites, at which time Rh will decrease rapidly. Since Rh is basically negligible relative to the load impedance Z at this time, ih will rapidly increase from 0 to Uz/Z, it is manifested as a sudden current phenomenon when a series fault arc occurs.
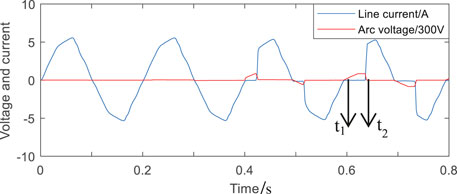
FIGURE 2. Voltage and line current waveforms at both ends of the AC arc.
It can also be seen from Figure 2 that the value of Uz in different power frequency half-cycles is not exactly the same. The main reason is that when a series fault arc occurs, the arc combustion is often accompanied by the partial volatilization of the electrode, resulting in dynamic changes in the arc gap spacing, the composition of the surrounding gas, and the degree of arc cooling. Each time a series arc fault occurs, the arcing voltage Uz cannot be exactly the same, resulting in certain randomness of the line current I in the adjacent half-power frequency cycle whether it is the effective value or the time of current sudden change. Moreover, due to the ionization discharge process during arcing, the current contains high-frequency noise in the high-frequency range. In summary, when a low-voltage AC series arc fault occurs on the line, the current has the characteristics of singularity, high-frequency noise, and randomness.
When a resistive load has a fault arc, the “zero rest” phenomenon is obvious. When the current increases from 0, there will be a sudden change, and it will naturally decrease to 0 according to the sinusoidal law. When an arc fault occurs in an inductive load, the current “zero rest” phenomenon is not obvious, and it basically changes according to the sine law. When a capacitive load has an arc fault, a pulse current will be generated, and there will be a sudden change in the line current, which basically changes according to the sinusoidal law. When an arc fault occurs in a resistive inductive load, the “zero rest” phenomenon is obvious, there is a pulse current, and it basically changes according to the sinusoidal law. When a fault arc occurs in a nonlinear load, there may also be a “zero rest” phenomenon during normal operation. The “zero rest” time is relatively shorter than that when a fault occurs. The current waveform has no normal laws at all, and it is prone to missing waveforms and positive and negative waveforms. In the case of semi-axis asymmetry, multiple pulse currents may occur in the power frequency half-cycle, the number of pulse currents is not fixed, and there is a sudden change in the line current. It is classified as linear and nonlinear, which can comprehensively cover all load types.
Figure 3 shows the current waveforms of a typical load vacuum cleaner and a computer, representing linear and nonlinear load. The first five cycles are the normal operating current, and the last five cycles are the fault arc current.
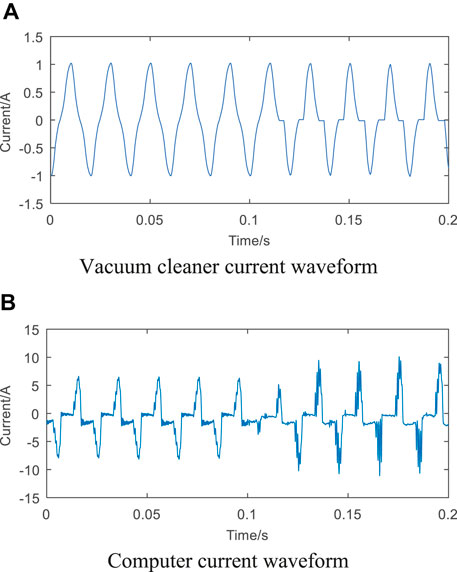
FIGURE 3. Typical load normal and fault current waveform. (A) Vacuum cleaner current waveform. (B) Computer current waveform.
From Figure 3, it can be observed that the arc current of the vacuum cleaner has a “zero rest” phenomenon almost every time before the zero- crossing point, that is, “flat shoulders”, the current is basically reduced to 0 according to the sine law, and there is a sudden change. However, for computers, there are “zero rest” features during normal work, it is prone to missing waveforms and asymmetry of positive and negative semi-axes, and the current waveform has no sine law at all. It is difficult to satisfy multiple load types such as linear load and nonlinear load at the same time by using a detection method established by the single characteristic of the current when an arc occurs. In order to improve the universality of the algorithm, a multi-characteristic algorithm based on the singularity of current, high-frequency noise, and randomness is proposed.
When the electrical appliance is working normally, the line current has strong stability; when a fault arc occurs, it will be affected by the arc voltage, and a random characteristic will appear in the current signal. This characteristic is a variable that depends on many factors, such as gap width, the electrode material, the type of discharge medium, temperature, humidity of the environment, etc. Algorithms established on the basis of randomness can be carried out from two aspects of current cycle similarity and cycle-to-cycle difference.
A method of derivation of similarity between current cycles based on randomness is proposed. First, the collected current signal is high-pass-filtered to eliminate the influence of the stable signal, highlighting the high-frequency random characteristics. A notch filter centered on zero frequency is proposed, and its transfer function is as follows:
The filter is a high-pass filter; the higher the frequency, the weaker the signal attenuation, where a is set to 0.77; after passing through the filter, the DC component is completely filtered out, and the fundamental frequency is greatly suppressed. Then, we perform Pearson transformation under a sliding window on the filtered current signal; the sliding step is the distance of a sampling point. In order to adapt to the calculation of the sliding window, the Pearson calculation formula under the mean value is adopted (Hine and Wetherill, 1975):
where xk is the sampled current of the load, and the r value is calculated on it; the result is shown in Figure 4.
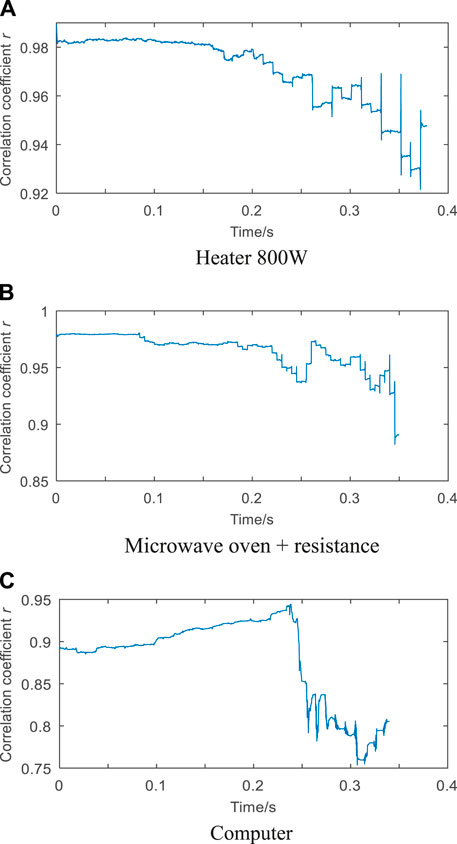
FIGURE 4. Curve graph of correlation coefficient r after Pearson transformation. (A) Heater 800 W. (B) Microwave oven + resistance. (C) Computer.
Through the calculation of r for a variety of loads, if r is directly used as the detection standard, it does not meet all load types. By observing the graph of the correlation coefficient r, under the normal working state of the load, no matter what the value of r, it is in a relatively stable state, and there is no major change in the value, but in the event of a fault arc, there is a large rate of change between the correlation coefficients. Therefore, the rate of change between correlation coefficients (first derivative) can be used as the detection standard. When the load is working normally, r is in the stable stage, the first derivative value approaches 0, and the fault stage is variable. The extraction process of the first derivative is as follows:
First, we perform Taylor expansion at 0, o (tn) is the Peano remainder, and n is an integer. Because the first derivative is calculated, n is 3; then, we perform Laplace transform and derivation, and finally, after the inverse Laplace transform, we can get (Lezama et al., 2015; Tisserand et al., 2015)
We discretize Eq. 4; t is the time scale of the integration window, and τ is the real-time sampling point. We perform derivative calculations under the trapezoidal integral idea, where the sliding window size takes the distance of 10 sampling points, and finally get
We use Eq. 5 to calculate the first derivative of the correlation coefficient r, and the calculation result is given as an absolute value. The result is shown in Figure 5.

FIGURE 5. First derivative of the correlation coefficient r for different loads. (A) Heater 800 W. (B) Microwave + computer.
It can be seen from Figure 5 that there is a big difference between the first-derivative value of the correlation coefficient when the load is running normally and when a fault occurs, it can effectively judge the fault arc and can be used as the characteristic quantity of the arc. The d1 value is taken as the arc characteristic quantity.
When a series arc fault occurs, because the current contains high-frequency noise, we perform Fourier transform on the signal, extract high-frequency signals, and perform fault analysis. In order to improve the accuracy of the transformation of nonlinear loads, the fast Fourier transform (FFT) is selected here.
The FFT is defined as
In Eq. 6, the continuous frequency spectrum of the signal x(t) is calculated. It can be obtained in the actual control system as the discrete sample value x (nT) of the continuous signal x(t). Therefore, it is necessary to use the discrete x (nT) to calculate the frequency spectrum of the signal x(t)
In Eq. 7, j is the imaginary part of the complex number. We perform FFT on the collected current signal, and the result is shown in Figure 6.
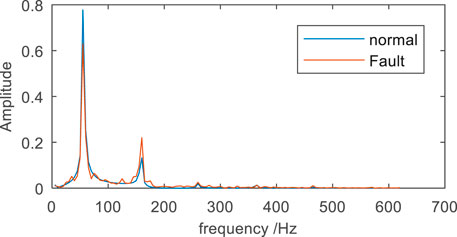
FIGURE 6. Spectrum diagram under Fourier transform.
From Figure 6, when a series arc fault occurs, the high-frequency component in the line current waveform is significantly higher than the high-frequency component during normal operation. The area of amplitude integration when a fault occurs has a greater change than that during normal operation. The FFT can be performed on each half-cycle of the current, and the frequency band above 100 HZ is extracted. The converted amplitude is numerically integrated as the arc characteristic quantity d2.
The wavelet analysis method is suitable for singularity detection. Compared with the Fourier transform method, the wavelet analysis method solves the shortcomings of the Fourier transform window size that does not vary with the frequency and can provide an adaptive “time-frequency” window that changes with frequency. Different shapes of window functions (wavelet basis functions) can be used to analyze and process signals to achieve higher frequency resolution at low frequencies and higher time resolution at high frequencies (Huang and Zeng, 2021).
The wavelet basis function is defined as
Among them, φ(t) is the basis wavelet or mother wavelet function, and after the scale factor c and the translation factor h are transformed, φc,h(t) is collectively called the wavelet.
Discrete cases
A discrete wavelet transform (DWT) is used to decompose the original time-domain waveform signal to obtain the approximate (low frequency) component and the detailed (high frequency) component of the original signal. Wavelet decomposition means that the low-frequency components of the original signal after DWT transformation are then DWT-transformed, and the number of cycles is determined by the number of decomposition layers. We perform wavelet transform on the collected current data; in order to more easily analyze the wavelet coefficients of each layer between different loads after the wavelet transform, it is necessary to normalize the collected current data before the wavelet transform. Although this changes the value of the wavelet coefficients of each layer under the original current signal, it does not change the detailed information, which is helpful for comparative analysis among multiple loads, and it is easy to find the classification threshold. Then, we use the DB4 wavelet base to perform four-layer decomposition and reconstruction, as shown in Figure 7.

FIGURE 7. Wavelet transform detail components.
Before and after the fault, the first-layer coefficient changes significantly and can be clearly observed, which can be used as the arc characteristic quantity, and the maximum value of the absolute value of the first-layer coefficient is taken as the arc characteristic quantity d3.
The current cycle difference method is also proposed on the basis of randomness, and the line current and its distortion point have a stable period. After the arc occurs, the line current waveform changes from the normal situation, a strong randomness is superimposed on the periodic basis, and the corresponding position and amplitude of the distortion will also show a certain degree of randomness. Therefore, by obtaining the default threshold of the waveform difference signal of adjacent periods, the influence of noise is eliminated by the wavelet denoising method of the zero-setting strategy, the denoised signal is divided by the average value of the original absolute value of the current period, and the influence of the stable period signal is weakened.
First, the current signal is subtracted from adjacent periods to obtain the waveform difference signal (9)
In Eqs 10, 11, I1k(t) and I2k(t) are the instantaneous current values of the k cycle when the electrical appliance is working normally and the arc occurs, e(t) is the noise signal, and A(t) represents the random characteristic of the arc current. If the adjacent period is subtracted, the normal signal becomes
The arc current signal becomes
It can be seen that after the adjacent periods are subtracted, the normal current signal only has the noise signal, and the arc current signal has another item besides the noise signal. This signal is related to the stable periodic signal of the normal current on one hand, and on the other hand, it is related to the random characteristics of the arc. Then, the waveform difference signal is denoised by wavelet threshold, and then, the denoised signal is normalized. Next, the maximum value of each cycle is extracted as the arc characteristic quantity, and the common threshold is obtained according to the data analysis result. Finally, we count the number of arc characteristic quantities greater than the reference value for the specified time to determine the occurrence of the arc.
The calculation result is shown in Figure 8.
FIGURE 8. Results of the difference method between current cycles.
From Figure 8, the calculation result of the current cycle difference method changes greatly before and after the fault, which can effectively distinguish the fault state and can be used as the arc characteristic quantity d4.
We respectively adopt the method of derivation of similarity between current cycles and the difference between current cycles, the wavelet analysis, and Fourier transform to simulate and verify vacuum cleaners, electric heaters, and resistance + microwave oven loads. The 10 current cycles before 0.2 s are in the normal working state, and the last 10 cycles are in the fault arc state. The identification effect of the similarity derivation method between current cycles is shown in Figure 9.
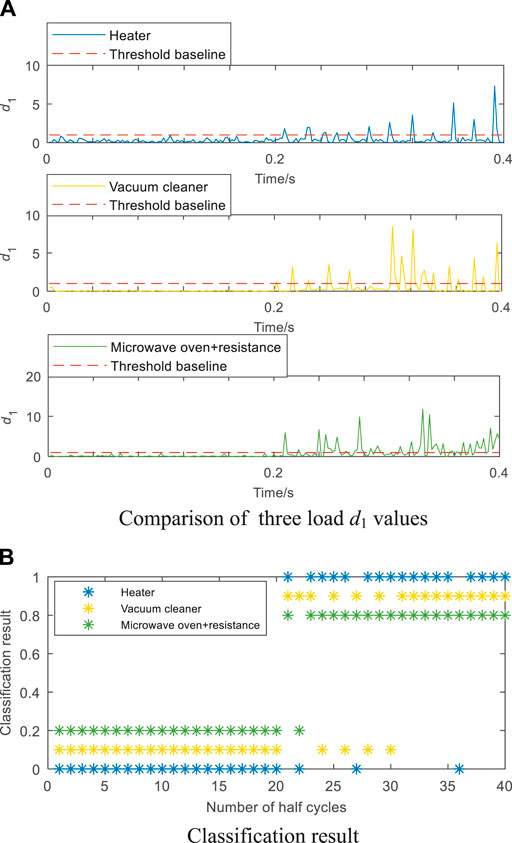
FIGURE 9. Effect of the current cycle similarity derivation method on three kinds of load detection. (A) Comparison of three load d1 values. (B) Classification result.
The values 1, 0.9, and 0.8 are taken to represent the classification results of the arc half-cycle of the three loads of the vacuum cleaner, electric heater, and resistance + microwave oven, respectively. In addition, 0, 0.1, and 0.2 are taken to represent the classification results of the non-arc half-cycle of the three loads of the vacuum cleaner, electric heater, and resistance + microwave oven, respectively. From Figure 9, all three load types can perform arc fault judgment under the condition of a threshold of 1. For the 20 half-cycles of arc faults, the microwave oven + resistance has the best detection effect, only one arc half cycle is misjudged, and the worst detection effect is the vacuum cleaner load, which misjudges four-arc half-cycles. However, all three load types have identified 14 or more arc half-cycles within 0.2, which fully meets the requirements of GB/14287.4.
A total of 100 groups of current half-cycle data are collected for the other seven load types, including 50 groups for normal and 50 groups for the fault. We perform fault detection, and the results are shown in Table 1.
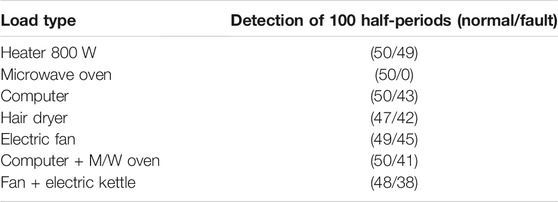
TABLE 1. Statistics of arc fault detection results (d1).
From Table 1, this method cannot effectively detect arc faults in microwave ovens.
Using the Fourier transform method, the threshold value of the arc characteristic quantity d2 is set to 0.18, and the detection effect is shown in Figure 10.
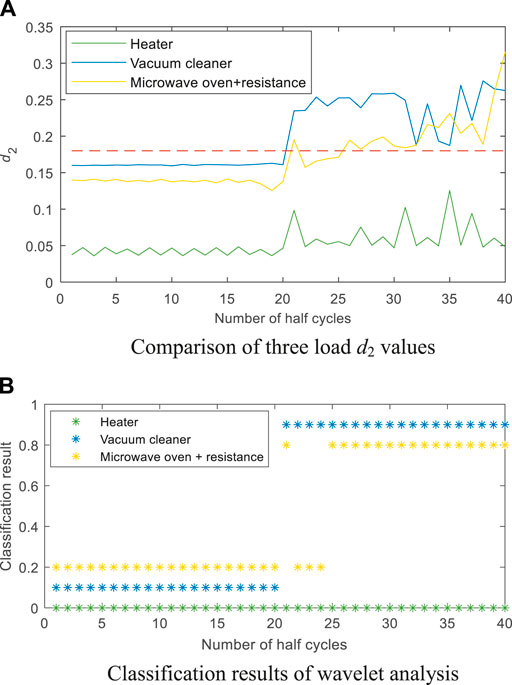
FIGURE 10. Fourier transform method detection effect. (A) Comparison of three load d2 values. (B) Classification results of wavelet analysis.
From Figure 10, when a fault arc occurs, the integral value after Fourier transform has a greater change than when there is no fault arc. However, finding a common threshold that satisfies a variety of load types is difficult. Under a threshold of 0.15, only the vacuum cleaner and the microwave oven + resistance can accurately identify the fault, and the electric heater is completely misjudged. For the Fourier transform method, if we want to accurately identify the existence of a fault arc, then we need to train a classification model to classify the load before judgment, which results in a large amount of algorithm calculations.
The detection effect of this method on the other seven kinds of loads is shown in Table 2.
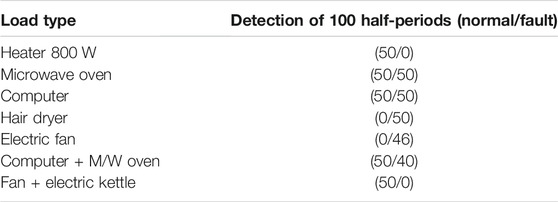
TABLE 2. Statistics of arc fault detection results (d2).
The Fourier transform method has a high detection accuracy for the load type that meets the threshold and has less misjudgment of the arc half-cycle, but it is limited by the load type and has poor universality.
The wavelet analysis method is used to calculate the arc characteristic quantity d3 of the sampled current; the threshold is set to 0.01, and the recognition effect is shown in Figure 11.
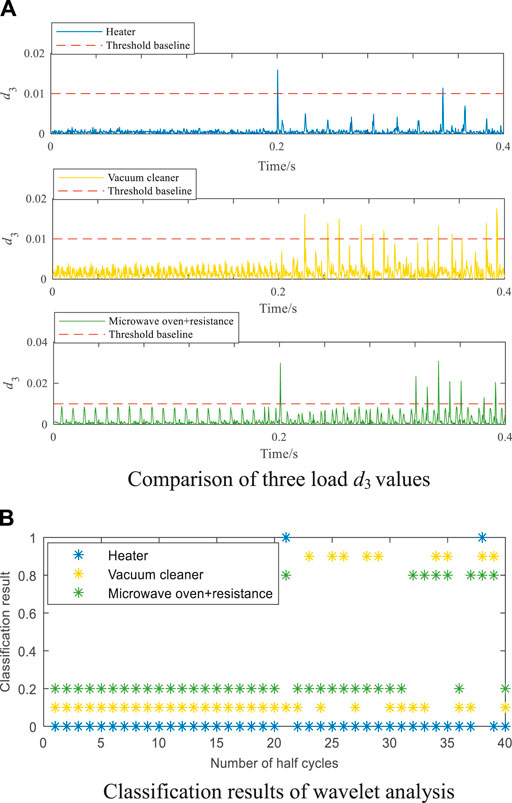
FIGURE 11. Wavelet analysis method detection effect. (A) Comparison of three load d3 values. (B) Classification results of wavelet analysis.
From Figure 11, in the 20 half-cycles of the arc fault, the wavelet analysis method can effectively identify the number of arc half-cycles of the vacuum cleaner, electric heater, and resistance + microwave oven as 2, 8, 8, and 8, respectively. There are many misjudgments, poor detection timeliness, and failure to quickly remove faults.
The detection effect of this method on the other seven kinds of loads is shown in Table 3.

TABLE 3. Statistics of arc fault detection results (d3).
The wavelet analysis method has strong universality, but the detection accuracy of the arc half-cycle is low, resulting in poor timeliness of the algorithm.
The current cycle difference method extracts the arc characteristic quantity according to the method of subtracting adjacent cycles, wavelet threshold denoising, and dividing the denoised signal by the average value of the absolute value of the original current cycle d4; the threshold is 0.6, and the recognition effect is shown in Figure 12.
FIGURE 12. Detection effect of the current cycle difference method. (A) Comparison of three load d4 values. (B) Classification results of the current cycle difference method.
The current cycle difference method effectively recognizes that the number of 10 arc cycles is 8, 6, and 9, respectively, for the three loads of the vacuum cleaner, electric heater, and resistance + microwave oven, which are 16, 12, and 18 when converted to arc half-cycles.
The detection effect of this method on the other seven kinds of loads is shown in Table 4.
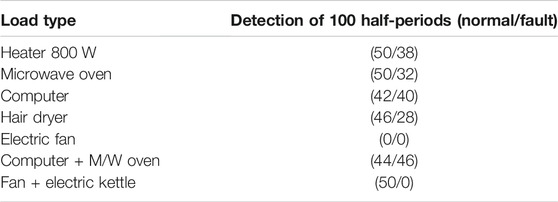
TABLE 4. Statistics of arc fault detection results (d4).
The method cannot effectively detect arc faults in the Fan + Electric kettle and Electric fan in Table 4.
Through the comparative analysis of the four methods, on the basis of randomness, two methods based on similarity and difference are selected, which have the characteristics of strong timeliness and a high accuracy. However, in practical applications, it will be affected by the complex and changeable environment, which will cause greater interference to the input signal, and the algorithm constructed by using randomness is greatly affected by interference. Therefore, using two random-based methods at the same time can effectively enhance the anti-interference of the fusion algorithm and ensure the high timeliness and recognition rate of the algorithm. The singularity-based wavelet algorithm has poor accuracy but has strong generalization ability, which can improve the generalization ability of the fusion algorithm for multiple load types. The Fourier transform method based on high-frequency characteristics has a high accuracy but poor generalization ability. The accuracy of the algorithm is improved. Therefore, a multi-feature fusion method is proposed on this basis, and the input feature vector covers the three characteristics of the arc fault current signal.
In summary, the multi-feature fusion algorithm proposed in this article has the following characteristics:
1) The proposed algorithm is established on the basis of randomness, singularity, and high-frequency characteristics and can more comprehensively reflect the three fault characteristics of the fault arc current.
2) There is no redundancy between the arc feature values corresponding to the three features, and the algorithm corresponding to each feature is used to improve the timeliness, versatility, and accuracy of the fusion algorithm.
From the BP network, a large number of mapping relationships between input and output modes are learned and stored, and there is no need to reveal the mathematical equations describing this mapping relationship in advance. Its learning rule is the gradient descent method, which continuously adjusts the weights and thresholds of the network through backpropagation to minimize the sum of squared errors of the network. The BP neural network has three layers: input layer, hidden layer, and output layer. The traditional BP neural network algorithm is easy to fall into the local minimization problem, and the convergence speed is slow. Therefore, this article adopts the GA-BP neural network model. The genetic algorithm has the ability to search for the global optimal solution and has strong robustness. The algorithm applies the genetic algorithm to the weight and threshold optimization of the neural network, reduces the distribution range of the optimal solution, and optimizes and accurately solves it again through the BP algorithm to avoid the network falling into a local minimum point so as to accelerate the convergence, the purpose of reducing the number of training. The GA-optimized BP neural network flowchart is shown in Figure 13.
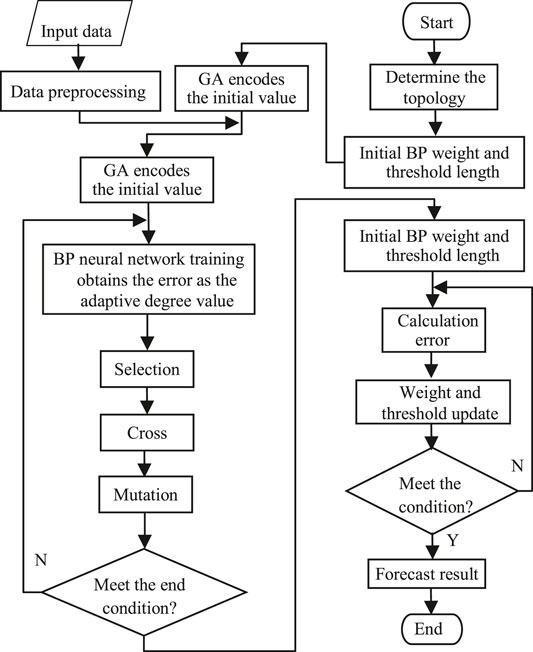
FIGURE 13. General model of the BP neuron.
We aligned the features extracted by the Fourier transform method, wavelet analysis method, current cycle difference method, and current cycle similarity derivation method and used the aligned data as the final arc feature array entering a deep neural network to distinguish between normal and fault currents. This model uses a fully connected 10-layer neural network with eight hidden layers with 16, 32, and 16 neurons. Each neuron connects all neurons through learnable weights. The product of the input signal and the weight is the output of the hidden layer. The output layer uses the Sigmoid function as the activation function for binary classification. The basic framework of the multi-feature fusion network is shown in Figure 14.
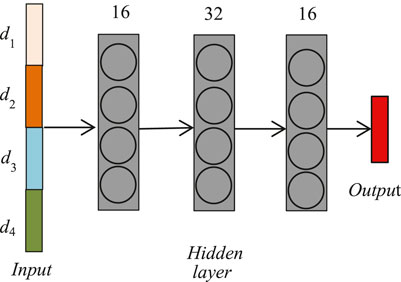
FIGURE 14. Basic framework of the multi-feature.
Before substituting the data into the neural network for training, the collected current data need to be preprocessed as follows:
1) Select the current data of the same time length as the sampling current, calculate the four-arc characteristic quantities, and perform characteristic alignment.
2) Make a one-to-one correspondence between the aligned arc feature array and the feature label, the normal state is 0 and the fault state is 1 to avoid confusion.
Through the built test platform, the current signals of the eight load types mentioned in Table 5 are collected. In MATLAB, first, preprocess the collected current signal and then use the trained GA-BP neural network to simulate the collected current signal. The first detection method proposed in this article is that there is no need to classify the load during the detection process. The second is that the neural network model extracts characteristic information from the four-arc characteristic values, carrying out simple two-class classification, so the training process is simple. Compared with the method of relying on the neural network to extract the arc feature quantity for the two-class classification, the neural network’s dependence on the original data is greatly reduced. In order to reflect these two points, all preprocessed data of different load types are randomly shuffled and mixed, and 500 sets of data are randomly selected, the selection of input parameters is also random, and there is no need to filter the original training data, which greatly reduces the workload of the pretraining period. The 500 sets of data are divided into the data set at a ratio of 9 to 1, of which 450 sets are randomly selected as the training and 50 sets as the test, the GA-BP neural network for training is input, and the same data to train the BP neural network is chosen. The training process is shown in Figure 15.
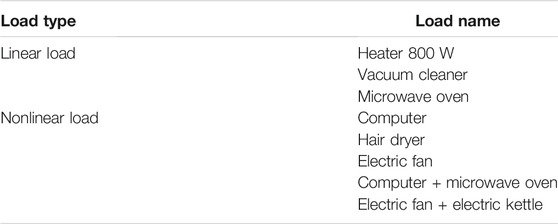
TABLE 5. Types of loads in the experiment.
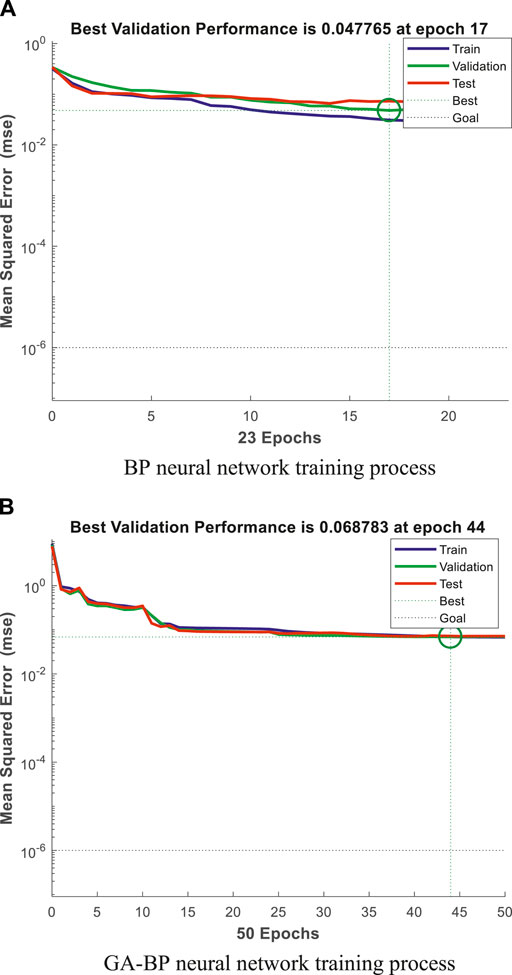
FIGURE 15. Two kinds of the network training process. (A) BP neural network training process. (B) GA-BP neural network training process.
It can be concluded from Figure 15 that the performance of the BP neural network after GA optimization is significantly better than that before optimization in terms of the mean square error accuracy and the number of iterations.
According to GB/14287.4, if 14 or more half-cycle arc faults occur within 1s, the arcing fault circuit breaker (Arcing Fault Detectors, AFD) should send out an alarm signal within 30 s and nine or less half-cycles within 1s when the arc fault occurs, but no alarm is given. Based on this, the algorithm flow is shown in Figure 16.
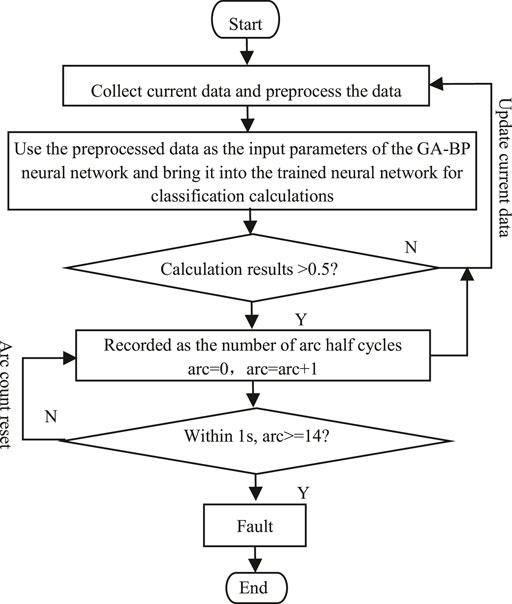
FIGURE 16. GA-BP algorithm flow chart.
The output result of the test set is shown in Figure 17A. When the output result is greater than 0.5, we take 1 and judge it as a fault half-cycle; when the output result is less than 0.5, we take 0 and judge it as a non-fault half-cycle, and we export test set classification results. The detection results for the mixed data of eight different load types are shown in Figure 17B, and there is no misjudgment phenomenon. Therefore, the multi-feature fusion algorithm proposed in this article greatly improves the detection accuracy. Therefore, the multi-feature fusion algorithm proposed in this article can be effectively used for arc fault detection.
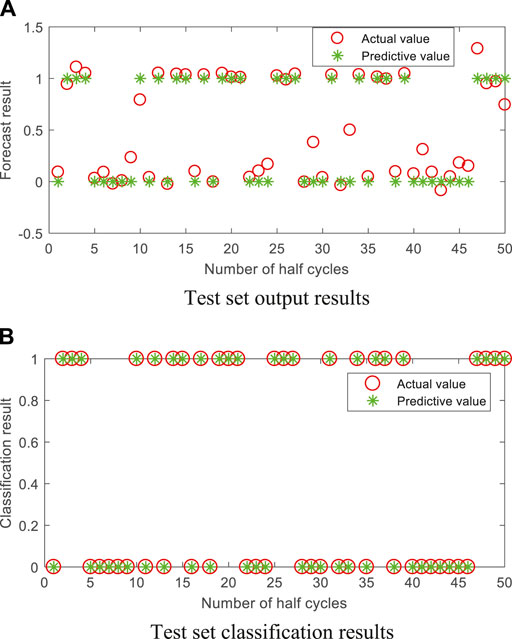
FIGURE 17. Arc half-cycle classification results of different load types in the test set. (A) Test set output results. (B) Test set classification results.
To further verify the feasibility of the GA-BP neural network model, we select typical electrical appliances and their combinations, with each load combination collecting 30 groups of current data, and perform simulation verification. The results are shown in Table 6.

TABLE 6. Statistics of arc fault detection results (GA-BP model).
The above test results verify the effectiveness of the network, but the test samples are all training set load types, and to verify the practicability of the algorithm for unknown loads, in actual engineering applications, the actual terminal power load is complex and changeable. Therefore, it is necessary to verify the detection performance of the non-training set load. For each load combination, 30 groups of current data are collected, and simulation verification is performed. The results are shown in Table 7.
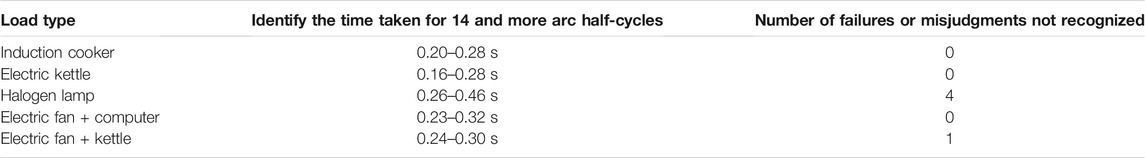
TABLE 7. Non-training set load detection results.
The detection timeliness is reduced compared to the non-training set load, there are many misjudgments of arc half-cycles, but the judgment of 14 arc half-cycles is still completed within the aging. Therefore, it also has a higher detection accuracy for the non-training set load, and the GA-BP neural network model can still guarantee a high recognition rate. Therefore, the GA-BP neural network model based on multi-feature fusion can be effectively used as a low-voltage AC series fault arc detection algorithm.
The input data of the AlexNet model are composed of 500 groups of current data after filtering and denoising, including groups of faults and non-faults, and based on the folder where the data file is located, an array is generated (marked as 1 for arc faults and 0 for no faults) to train the network, and its detection accuracy rate is 76%. However, the training data are expanded to 10,000 groups (Zhu et al., 2021), and the detection accuracy can reach 99%. There is a high detection accuracy, but the initial workload is huge and 10,000 sets of training data cannot guarantee the comprehensiveness of the data. If the test data are a load that is not in the training set, guaranteeing the recognition accuracy is difficult. Therefore, this method requires huge data support to ensure the training accuracy of the network and the comprehensiveness of the data. Substituting 500 sets of feature-aligned data used to train and test the GA-BP model into the support vector machine and logistic regression model, 450 sets of training data and 50 sets of test data are consistent with the GA-BP model. The support vector machine model is similar to a three-layer feedforward neural network. Its kernel function uses the Gauss’ kernel function RBF. After the support vector machine model training, its accuracy rate is 94%. The linear regression model uses the glmfit function to perform logistic regression with an accuracy rate of 90%. However, in Figure 17, the recognition rate of the 50 sets of test data in the constructed GA-BP network model can reach 100%.
Through the extraction of arc characteristic quantities in the early stage of the algorithm, the process of spontaneously extracting arc characteristic information like the AlexNet network model is avoided. Only the preprocessed arc characteristic array is required to extract the characteristics, which greatly reduces the GA-BP network model’s large batch of data dependence. The training process is a simple two-classification process, and the four methods of extracting arc characteristic quantities are complementary. Even if the test load is a load type that is not in the training set, as long as one of the arc characteristic quantities is satisfied, the algorithm can guarantee accuracy. Even if the four-arc characteristic values cannot effectively identify the arc fault, the neural network can also find characteristic information from the arc characteristic vector formed by the four-arc characteristic values and the characteristic label. If we directly make a decision on the test results of the four methods, the evaluation results of load types that are not satisfied with the four methods have greater rigidity. The GA-BP neural network model has strong adaptability and can spontaneously search for characteristic information from the four-arc characteristic quantities. Although the more comprehensive the training set data, the higher the detection accuracy, in practical applications, it is not possible to incorporate all load types into the training set. For various impacts (environmental changes, noise, non-training set load types, etc.) and situations and the data generated, due to the self-adaptability of the GA-BP neural network model, it is more suitable as an arc fault detection algorithm.
Aiming at the problem of strong concealment of low-voltage AC series arc faults, which seriously threatens the safety of electricity use in civil occasions, we propose a neural network algorithm based on multi-feature fusion; extract the arc characteristic quantity by the wavelet analysis method, Fourier transform method, current cycle difference method, and current cycle similarity derivation method; establish a GA-BP neural network model for training; and use the trained GA-BP neural network model for arc fault identification. The effectiveness of the method is verified by simulation by MATLAB, and the conclusions of this article are as follows:
1) The multi-feature fusion algorithm has a higher recognition rate than other single algorithms, and the GA-BP neural network model is integrated, which makes the algorithm judgment have a certain degree of adaptability. It has a better recognition effect for the non-training set load, and it also has a good detection effect for the non-training set load.
2) Compared with the support vector machine, logistic regression model, and AlexNet neural network, the results show that the GA-BP neural network model based on multi-feature fusion has a higher recognition rate for the test set load than the other three molds, which can reach 100%.
3) The training process of GA-BP is the neural network that extracts characteristic information from the four-arc characteristic values, carrying out simple two-class classification, so the training process is simple. Compared with the method of relying on the neural network to extract the arc feature quantity for the two-class classification, the neural network’s dependence on the original data is greatly reduced. The algorithm in this article is a good combination of traditional algorithms and neural networks and provides analysis ideas for the identification of fault arcs in low-voltage systems and the research and development of civil power safety issues after electric meters.
The original contributions presented in the study are included in the article/Supplementary Material, further inquiries can be directed to the corresponding author.
QG: responsible for resources, software, formal analysis, program compilation, and writing original draft. KP: responsible for methodology, project administration, and funding acquisition. WW: responsible for writing review and editing. BX: responsible for visualization and supervision. XZ: responsible for investigation and resources. YC: responsible for obtaining the experimental data.
The study in this article was sponsored by the project supported by the National Natural Science Foundation of China (No. 51807112) and the National Key Research and Development Program (No. 2016YFB0900600).
The authors declare that the research was conducted in the absence of any commercial or financial relationships that could be construed as a potential conflict of interest.
All claims expressed in this article are solely those of the authors and do not necessarily represent those of their affiliated organizations or those of the publisher, the editors, and the reviewers. Any product that may be evaluated in this article or claim that may be made by its manufacturer is not guaranteed or endorsed by the publisher.
Abdullah, Y., Hu, B., Wei, Z., Wang, J., and Emrani, A. (2018). “Adaptive Detection of DC Arc Faults Based on hurst Exponents and Current Envelope,” in IEEE Applied Power Electronics Conference and Exposition, 3392–3397. doi:10.1109/APEC.2018.8341590
Artale, G., Cataliotti, A., Cosentino, V., Di Cara, D., Nuccio, S., and Tine, G. (2017). Arc Fault Detection Method Based on CZT Low-Frequency Harmonic Current Analysis. IEEE Trans. Instrum. Meas. 66 (5), 888–896. doi:10.1109/TIM.2016.2627248
Bai, H., and Xu, Z. H. (2020). Arc Fault Identification Method Based on Wavelet Packet Transform and High-Order Cumulant. Electric Power Automation Equipment 40 (11), 195–202. doi:10.16081/j.epae.202007033
Calderon-Mendoza, E., Schweitzer, P., and Weber, S. (2019). Kalman Filter and a Fuzzy Logic Processor for Series Arcing Fault Detection in a home Electrical Network. Int. J. Electr. Power Energ. Syst. 107, 251–263. doi:10.1016/j.ijepes.2018.11.002
Dong, P., Yang, X., Jia, P. F., Qiu, W., Zhong, M. L., and Lei, J. C. (2021). Simulation and Safety Design of Internal Short-Circuit Arc Impact Process of 10 kV High Voltage Switchgear. High Voltage Eng. doi:10.13336/j.1003-6520.hve.20201395
Guo, F. Y., Gao, H. X., Tang, A. X., and Wang, Z. Y. (2020). Series Arc Fault Detection and Line Selection Based on Local Binary Pattern Histogram Matching. Trans. China Electro Tech. Soc. 35 (8), 1653–1660. doi:10.19595/j.cnki.1000-6753.tces.190118
Hine, J., and Wetherill, G. B. (1975). “Coefficient of Correlation,” in A Programmed Text in Statistics Book 4 (Netherlands: Springer), 32–41. doi:10.1007/978-94-011-6509-9_5
Huang, Q., and Zeng, X. Y. (2021). An Underwater Acoustic Target Recognition Method Combining Wavelet Decomposition and Improved Convolutional Neural Network. Xian: Journal of Harbin Engineering University. Available: https://kns.cnki.net/kcms/detail/23.1390.U.20211026.1112.002.htm.
Jiang, J., Wen, Z., Zhao, M., Bie, Y., Li, C., Tan, M., et al. (2019). Series Arc Detection and Complex Load Recognition Based on Principal Component Analysis and Support Vector Machine. IEEE Access 7 (12), 47221–47229. doi:10.1109/ACCESS.2019.2905358
Lezama, J., Schweitzer, P., Tisserand, E., Humbert, J.-B., Weber, S., and Joyeux, P. (2015). An Embedded System for AC Series Arc Detection by Inter-period Correlations of Current. Electric Power Syst. Res. 129, 227–234. doi:10.1016/j.epsr.2015.08.005
Li, M., Guo, P. C., Wang, Y. W., Li, L., and Wu, Y. F. (2020). Radiation Characteristics of Internal Fault Arc in an Enclosed Tank. High Voltage Eng. 46 (6), 2021–2029. doi:10.13336/j.1003-6520.hve.20200528015
Lu, K. F., Zhang, F., Zhang, S. W., and Wang, Y. K. (2020). Fault Arc Identification Method Based on Combination of BP Neural Network and Current Feature Extraction. Electr. Automation 42 (3), 45–48. doi:10.3969/j.issn.1000-3886.2020.03.014
Lu, Q. W., Wang, T., Li, Z. R., and Wang, C. (2017). Detection Method of Series Arcing Fault Based on Wavelet Transform and Singular Value Decomposition. Trans. China Electro Tech. Soc. 32 (17), 212–221. doi:10.19595/j.cnki.1000-6753.tces.170196
Parise, G., Martirano, L., and Laurini, M. (2013). Simplified Arc-Fault Model: The Reduction Factor of the Arc Current. IEEE Trans. Ind. Applicat. 49 (4), 1703–1710. doi:10.1109/IAS.2012.6374104doi:10.1109/tia.2013.2256452
Shekhar, A., Ramirez-Elizondo, L., Bandyopadhyay, S., Mackay, L., and Bauera, P. (2018). Detection of Series Arcs Using Load Side Voltage Drop for Protection of Low Voltage DC Systems. IEEE Trans. Smart Grid 9 (6), 6288–6297. doi:10.1109/TDC.2018.844050910.1109/tsg.2017.2707438
Soheili, A., Sadeh, J., Lomei, H., and Muttaqi, K. (2016). “A New High Impedance Fault Detection Scheme: Fourier Based Approach,” in IEEE International Conference on Power System Technology, 1–6. doi:10.1109/POWERCON.2016.7754052
Tan, Q. Q. (2017). Low Voltage Arc Fault Detection Method and Device. master’s thesis. Shandong(China): Shandong Jianzhu University.
Tisserand, E., Lezama, J., Schweitzer, P., and Berviller, Y. (2015). Series Arcing Detection by Algebraic Derivative of the Current. Electric Power Syst. Res. 119, 91–99. doi:10.1016/j.epsr.2014.09.011
Wang, Y., Wei, Q. Q., Ge, L. J., Niu, F. F., Li, K., and Zhang, L. (2017). Series AC Arc Fault Detection Based on High-Frequency Components of Arc Current. Electric Power Automation Equipment 37 (7), 191–197. doi:10.16081/j.issn.1006-6047.2017.07.029
Yu, Q. F., Lu, W. H., and Yang, Y. (2021). Multi-Branch Series Fault Arc Detection Method Based on Deep Long Short-Term Memory Network. J. Comp. Appl. 41 (S1), 321–326. doi:10.11772/j.issn.1001-9081.2020091502
Zhang, G. Y., Zhang, X. L., Liu, H., and Wang, Y. H. (2016). Online Detection Method for Series Arcing Fault in Low Voltage System. Trans. China Electrotechnical Soc. 31 (8), 109–115. doi:10.19595/j.cnki.1000-6753.tces.2016.08.01410.1109/tpwrd.2016.2518738
Keywords: low-voltage series arc, neural networks, fault identification, multi-feature fusion, arc fault characteristics
Citation: Gong Q, Peng K, Wang W, Xu B, Zhang X and Chen Y (2022) Series Arc Fault Identification Method Based on Multi-Feature Fusion. Front. Energy Res. 9:824414. doi: 10.3389/fenrg.2021.824414
Received: 29 November 2021; Accepted: 16 December 2021;
Published: 17 January 2022.
Edited by:
Rufeng Zhang, Northeast Electric Power University, ChinaReviewed by:
Yunyun Xie, Nanjing University of Science and Technology, ChinaCopyright © 2022 Gong, Peng, Wang, Xu, Zhang and Chen. This is an open-access article distributed under the terms of the Creative Commons Attribution License (CC BY). The use, distribution or reproduction in other forums is permitted, provided the original author(s) and the copyright owner(s) are credited and that the original publication in this journal is cited, in accordance with accepted academic practice. No use, distribution or reproduction is permitted which does not comply with these terms.
*Correspondence: Wei Wang, d3dzZHV0QDE2My5jb20=
Disclaimer: All claims expressed in this article are solely those of the authors and do not necessarily represent those of their affiliated organizations, or those of the publisher, the editors and the reviewers. Any product that may be evaluated in this article or claim that may be made by its manufacturer is not guaranteed or endorsed by the publisher.
Research integrity at Frontiers
Learn more about the work of our research integrity team to safeguard the quality of each article we publish.